Jump to a detailed profile or search site with Google Custom Search

Mission Viejo, CA (California) Houses and Residents

Estimated median house or condo value in 2022: $1,016,800 (it was $288,700 in 2000)
Mission Viejo:

$1,016,800
California:

$715,900
Lower value quartile - upper value quartile: $814,600 - $1,228,300

Mean price in 2022:

Detached houses: $1,105,131
Here:

$1,105,131
State:

$988,808

Townhouses or other attached units: $670,974
Here:

$670,974
State:

$838,546

In 3-to-4-unit structures: $521,063
Here:

$521,063
State:

$824,253

In 5-or-more-unit structures: $518,505
Here:

$518,505
State:

$730,996

Total population: 97,209 (Urban population: 92,780, Rural population: 0)

Houses: 33,176 (32,252 occupied: 23,298 owner occupied, 8,954 renter occupied)

% of renters here:

28%
State:

44%

Housing density: 1,778 houses/condos per square mile

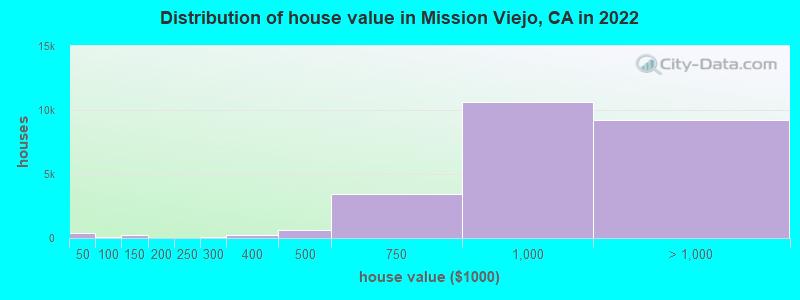
Median price asked for vacant for-sale houses and condos in 2022: $930,320.

Median contract rent in 2022: over $2,000 (lower quartile is over $2,000, upper quartile is over $2,000)


Median rent asked for vacant for-rent units in 2022: $3,497


Median gross rent in Mission Viejo, CA in 2022: over $2,000

Housing units in Mission Viejo with a mortgage: 17,940 (2,141 second mortgage, 111 home equity loan, 1,698 both second mortgage and home equity loan)
Houses without a mortgage: 399

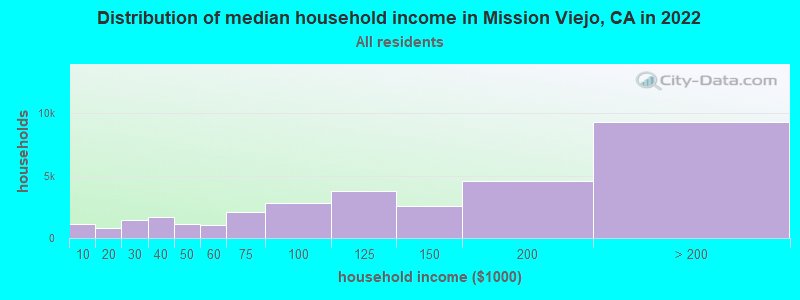
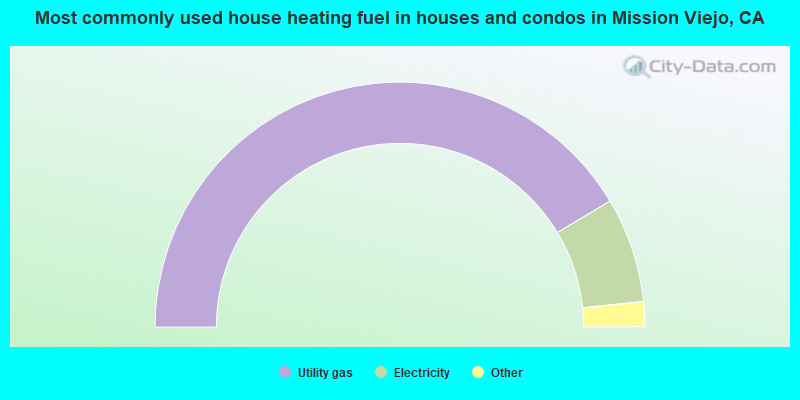
Median household income for houses/condos with a mortgage: $157,644

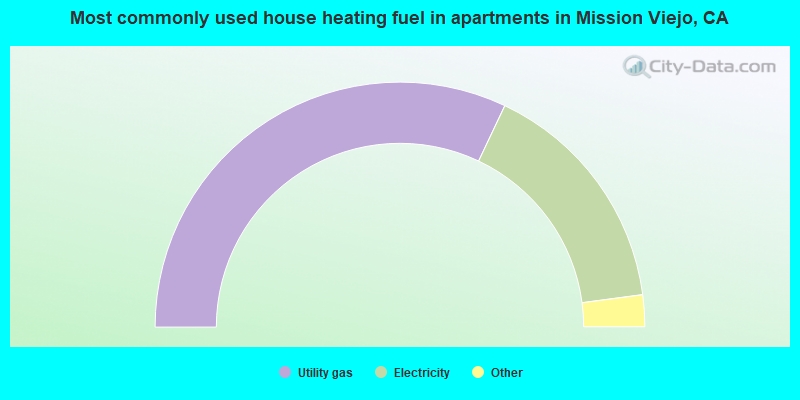
Median household income for apartments without a mortgage: $108,170

Median monthly housing costs: $2,636

Compare current foreclosures in Mission Viejo, CA:

Check out more offers in Mission Viejo, CA.
Powered by Foreclosure.com

Settings
X
Data:
Loading data...
Based on 2000-2022 data
Loading data...

123
Hide US histogram

Mission Viejo, California Age and Sex of Residents
Median year house/condo built: 1979

Median year apartment built: 1985

Household type by relationship:

Households: 91,775
  • Male householders: 17,625 (2,568 living alone), Female householders: 14,627 (3,908 living alone)
  • 19,036 spouses (19,002 opposite-sex spouses), 1,883 unmarried partners, (1,883 opposite-sex unmarried partners), 27,145 children (25,343 natural, 1,417 adopted, 385 stepchildren), 2,416 grandchildren, 1,591 brothers or sisters, 1,405 parents, 0 foster children, 2,396 other relatives, 1,550 non-relatives
  • In group quarters: 2,101

Size of family households: 9,069 2-persons, 5,685 3-persons, 5,636 4-persons, 1,901 5-persons, 770 6-persons, 547 7-or-more-persons.

Size of nonfamily households: 6,476 1-person, 1,986 2-persons, 182 3-persons.

13,657 married couples with children.
2,866 single-parent households (481 men, 2,385 women).

68.6% of residents of Mission Viejo speak English at home.
12.0% of residents speak Spanish at home (66% speak English very well, 20% speak English well, 11% speak English not well, 3% don't speak English at all).
8.3% of residents speak other Indo-European language at home (74% speak English very well, 20% speak English well, 5% speak English not well).
9.4% of residents speak Asian or Pacific Island language at home (57% speak English very well, 27% speak English well, 14% speak English not well, 1% don't speak English at all).
1.7% of residents speak other language at home (77% speak English very well, 10% speak English well, 13% speak English not well).

Foreign born population: 17,902 (19.5%)
(65.1% of them are naturalized citizens)

Median number of rooms in houses and condos:
Here:

6.6
State:

6.0

Median number of rooms in apartments
Here:

4.3
State:

3.9

Owner-occupied Renter-occupied
Bedrooms in owner-occupied houses and condos in Mission Viejo, California
  • Bedrooms in owner-occupied houses and condos in Mission Viejo, California
  • 0no bedroom
  • 3731 bedroom
  • 3,5512 bedrooms
  • 8,2723 bedrooms
  • 7,8084 bedrooms
  • 3,2945+ bedrooms
Bedrooms in renter-occupied apartments in Mission Viejo, California
  • Bedrooms in renter-occupied apartments in Mission Viejo, California
  • 324no bedroom
  • 1,6631 bedroom
  • 3,1982 bedrooms
  • 2,7343 bedrooms
  • 8494 bedrooms
  • 1865+ bedrooms
Owner-occupied Renter-occupied
Cars and other vehicles available in Mission Viejo in owner-occupied houses/condos
  • Cars and other vehicles available in Mission Viejo in owner-occupied houses/condos
  • 429no vehicle
  • 4,3571 vehicle
  • 11,2952 vehicles
  • 4,7733 vehicles
  • 1,3754 vehicles
  • 1,0695+ vehicles
Cars and other vehicles available in Mission Viejo in renter-occupied apartments
  • Cars and other vehicles available in Mission Viejo in renter-occupied apartments
  • 436no vehicle
  • 3,5651 vehicle
  • 3,9532 vehicles
  • 4813 vehicles
  • 1224 vehicles
  • 3975+ vehicles
Owner-occupied Renter-occupied
Rooms in owner-occupied houses in Mission Viejo, California
  • Rooms in owner-occupied houses in Mission Viejo, California
  • 01 room
  • 1192 rooms
  • 6713 rooms
  • 2,2794 rooms
  • 3,4105 rooms
  • 4,8806 rooms
  • 4,7547 rooms
  • 2,7628 rooms
  • 4,4239+ rooms
Rooms in renter-occupied apartments in Mission Viejo, California
  • Rooms in renter-occupied apartments in Mission Viejo, California
  • 3241 room
  • 6352 rooms
  • 1,6163 rooms
  • 2,4204 rooms
  • 1,9055 rooms
  • 9426 rooms
  • 4847 rooms
  • 4238 rooms
  • 2059+ rooms
Year house built
Median 2022 house/condo value by year built
Median house/condo value by year householder moved into unit
Breakdown of mean house values by ages of householders
Owners and renters by unit type in Mission Viejo, CA
  • Mission Viejo, CA household income distribution

  • Distribution of median household income in Mission Viejo, CA in 2022
  • 1,095Less than $10,000
  • 801$10,000 to $19,999
  • 1,461$20,000 to $29,999
  • 1,688$30,000 to $39,999
  • 1,090$40,000 to $49,999
  • 1,027$50,000 to $59,999
  • 2,078$60,000 to $74,999
  • 2,827$75,000 to $99,999
  • 3,771$100,000 to $124,999
  • 2,582$125,000 to $149,999
  • 4,546$150,000 to $199,999
  • 9,286$200,000 or more
  • Home value of owner - occupied houses in 2022 in Mission Viejo, CA

  • Distribution of house value in Mission Viejo, CA in 2022
  • 344Less than $10,000
  • 13$10,000 to $14,999
  • 10$15,000 to $19,999
  • 11$20,000 to $24,999
  • 0$60,000 to $69,999
  • 26$70,000 to $79,999
  • 43$80,000 to $89,999
  • 19$90,000 to $99,999
  • 158$100,000 to $124,999
  • 54$125,000 to $149,999
  • 28$150,000 to $174,999
  • 5$175,000 to $199,999
  • 5$200,000 to $249,999
  • 96$250,000 to $299,999
  • 259$300,000 to $399,999
  • 658$400,000 to $499,999
  • 3,401$500,000 to $749,999
  • 10,613$750,000 to $999,999
  • 7,334$1,000,000 to $1,499,999
  • 1,300$1,500,000 to $1,999,999
  • 609$2,000,000 or more
  • Rent paid by renters in 2022 in Mission Viejo, CA

  • Distribution of rent paid by renters in Mission Viejo, CA in 2022
  • 24$250 to $299
  • 11$300 to $349
  • 47$350 to $399
  • 20$400 to $449
  • 6$550 to $599
  • 18$600 to $649
  • 24$650 to $699
  • 15$750 to $799
  • 48$800 to $899
  • 54$900 to $999
  • 253$1,000 to $1,249
  • 234$1,250 to $1,499
  • 1,201$1,500 to $1,999
  • 2,089$2,000 to $2,499
  • 1,280$2,500 to $2,999
  • 1,106$3,000 to $3,499
  • 847$3,500 or more
  • 363No cash rent
Time Leaving Home To Go To Work in 2022

Percentage of workers working in this county: 91.7%
Number of people working at home: 10,444 (22.5% of all workers)

Travel time (in minutes) to work in 2022

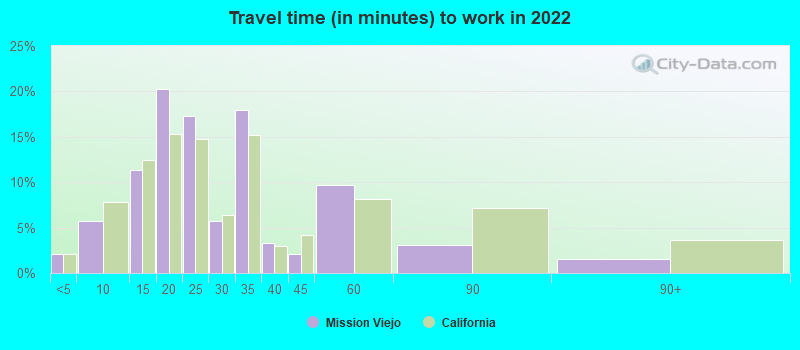
Travel time to work (commute)

  • Less than 5 minutes: 1,163
  • 5 to 9 minutes: 2,508
  • 10 to 14 minutes: 3,704
  • 15 to 19 minutes: 6,446
  • 20 to 24 minutes: 5,275
  • 25 to 29 minutes: 3,322
  • 30 to 34 minutes: 5,452
  • 35 to 39 minutes: 1,429
  • 40 to 44 minutes: 696
  • 45 to 59 minutes: 3,608
  • 60 to 89 minutes: 1,540
  • 90 or more minutes: 638
Means of transportation to work in 2022 - Mission Viejo

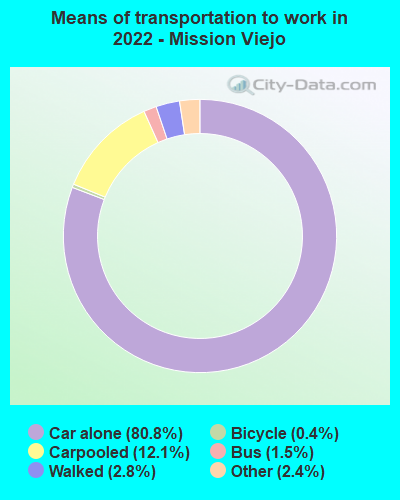
Means of transportation to work:

  • Drove a car alone: 24,758 (60.9%)
  • Carpooled: 4,019 (9.9%)
  • Bus: 411 (1.0%)
  • Subway or elevated rail: 5 (0.0%)
  • Long-distance train or commuter rail: 22 (0.1%)
  • Taxi: 844 (2.1%)
  • Bicycle: 123 (0.3%)
  • Walked: 845 (2.1%)
  • Worked at home: 10,444 (25.7%)
Class of Workers in 2022
  • Unemployment by race in 2022
  • Unemployment rate for White non-Hispanic residents
  • 1.8%Males
  • 5.5%Females
  • Unemployment rate for Black residents
  • 5.9%Males
  • 0.9%Females
  • Unemployment rate for Asian residents
  • 18.2%Males
  • 1.3%Females
  • Unemployment rate for other race residents
  • 2.7%Males
  • 2.9%Females
  • Unemployment rate for two or more race residents
  • 3.5%Males
  • 2.0%Females
  • Unemployment rate for Hispanic or Latino residents
  • 2.1%Males
  • 2.8%Females
Year of entry for the foreign-born population in Mission Viejo, California
  • Year of entry for the foreign-born population in Mission Viejo, California
  • 4,0362010 or later
  • 3,5752000 to 2009
  • 4,1121990 to 1999
  • 4,8091980 to 1989
  • 3,2531970 to 1979
  • 3,550Before 1970
Ancestries in Mission Viejo, CA

First ancestries reported:

  • Iranian: 3,672 (7.5%)
  • American: 3,088 (6.3%)
  • English: 2,884 (5.9%)
  • German: 2,667 (5.5%)
  • European: 2,253 (4.6%)
  • Irish: 1,989 (4.1%)
  • Italian: 1,683 (3.4%)
  • Polish: 664 (1.4%)
  • French: 435 (0.9%)
  • Egyptian: 377 (0.8%)
  • Scottish: 368 (0.8%)
  • Dutch: 357 (0.7%)
  • Swedish: 324 (0.7%)
  • Hungarian: 309 (0.6%)
  • Ukrainian: 280 (0.6%)
  • Greek: 261 (0.5%)
  • Scotch-Irish: 232 (0.5%)
  • Lebanese: 182 (0.4%)
  • Eastern European: 180 (0.4%)
  • Russian: 176 (0.4%)
  • British: 172 (0.4%)
  • Welsh: 172 (0.4%)
  • Norwegian: 172 (0.4%)
  • Serbian: 168 (0.3%)
  • French Canadian: 165 (0.3%)
  • Romanian: 157 (0.3%)
  • Icelander: 143 (0.3%)
  • Turkish: 131 (0.3%)
  • Portuguese: 128 (0.3%)
  • Danish: 113 (0.2%)
  • Assyrian: 104 (0.2%)
  • Canadian: 99 (0.2%)
  • Scandinavian: 96 (0.2%)
  • Armenian: 83 (0.2%)
  • Finnish: 80 (0.2%)
  • Palestinian: 77 (0.2%)
  • Yugoslavian: 60 (0.1%)
  • Maltese: 59 (0.1%)
  • Croatian: 59 (0.1%)
  • Swiss: 54 (0.1%)
  • Northern European: 52 (0.1%)
  • Slovak: 42 (0.09%)
  • New Zealander: 41 (0.08%)
  • Brazilian: 37 (0.08%)
  • Afghan: 36 (0.07%)
  • Moroccan: 32 (0.07%)
  • Syrian: 27 (0.06%)
  • Macedonian: 25 (0.05%)
  • Latvian: 24 (0.05%)
  • Jamaican: 24 (0.05%)
  • Lithuanian: 23 (0.05%)
  • African: 23 (0.05%)
  • Iraqi: 22 (0.05%)
  • Czech: 20 (0.04%)
  • Austrian: 19 (0.04%)
  • Bulgarian: 15 (0.03%)
  • Jordanian: 13 (0.03%)
  • Slavic: 13 (0.03%)
  • Australian: 9 (0.02%)
  • South African: 9 (0.02%)
  • West Indian: 8 (0.02%)
  • Slovene: 6 (0.01%)
  • Basque: 5 (0.01%)
  • Cape Verdean: 5 (0.01%)
  • Pennsylvania German: 4 (0.01%)
  • Nigerian: 3 (0.01%)

Most common places of birth for foreign-born residents (%):

Iran
Mission Viejo:

17.0% (3,573)
California:

2.0% (206,004)

Mexico
Mission Viejo:

16.1% (3,382)
California:

37.2% (3,881,193)

Vietnam
Mission Viejo:

9.2% (1,926)
California:

4.9% (512,335)

Philippines
Mission Viejo:

6.4% (1,341)
California:

7.8% (818,297)

India
Mission Viejo:

4.9% (1,025)
California:

5.2% (539,184)

China, excluding Hong Kong and Taiwan
Mission Viejo:

4.7% (984)
California:

6.6% (684,672)

Taiwan
Mission Viejo:

3.7% (780)
California:

1.7% (176,274)

Canada
Mission Viejo:

3.0% (620)
California:

1.2% (127,477)

Korea
Mission Viejo:

2.5% (520)
California:

3.0% (315,248)

Guatemala
Mission Viejo:

2.0% (425)
California:

2.8% (290,436)

Egypt
Mission Viejo:

1.8% (386)
California:

0.4% (42,718)

Peru
Mission Viejo:

1.7% (358)
California:

0.7% (74,025)

Japan
Mission Viejo:

1.7% (353)
California:

1.0% (103,575)

Place of birth for U.S.-born residents:

  • This state: 52,163
  • Other state: 19,884
  • Northeast: 5,587
  • Midwest: 7,949
  • South: 3,317
  • West: 3,031

91.2% of Mission Viejo residents lived in the same house 1 years ago.
   Out of people who lived in different houses, 42.5% lived in this county.
   Out of people who lived in different counties, 52.8% lived in California.


Mission Viejo:

91.2%
State average:

88.9%

Education attainment for males 25 years and older:

  • No schooling: 903
  • Nursery to 4th grade: 204
  • 5th and 6th grade: 184
  • 7th and 8th grade: 0
  • 9th grade: 0
  • 10th grade: 567
  • 11th grade: 0
  • 12th grade, no diploma: 570
  • High school graduate (or equivalency): 5,514
  • Less than 1 year of college: 1,527
  • Some college more than 1 year, no degree: 4,047
  • Associate degree: 1,404
  • Bachelor's degree: 10,334
  • Master's degree: 4,275
  • Professional school degree: 1,195
  • Doctorate degree: 939
Educational Attainment for Males

Education attainment for females 25 years and older:

  • No schooling: 1,328
  • Nursery to 4th grade: 0
  • 5th and 6th grade: 305
  • 7th and 8th grade: 291
  • 9th grade: 105
  • 10th grade: 351
  • 11th grade: 45
  • 12th grade, no diploma: 514
  • High school graduate (or equivalency): 5,880
  • Less than 1 year of college: 1,606
  • Some college more than 1 year, no degree: 3,242
  • Associate degree: 3,297
  • Bachelor's degree: 10,796
  • Master's degree: 4,242
  • Professional school degree: 934
  • Doctorate degree: 393
Educational Attainment for Females
Mission Viejo marital status for males
Mission Viejo marital status for females

Housing units in structures:

  • One, detached: 23,512
  • One, attached: 4,072
  • Two: 407
  • 3 or 4: 1,241
  • 5 to 9: 962
  • 10 to 19: 905
  • 20 to 49: 66
  • 50 or more: 2,011
Housing units lacking complete plumbing facilities in 2022: 0.5%

Housing units lacking complete kitchen facilities in 2022: 1.7%

House/condo owner moved in on average 14 years ago

Renter moved in on average 3 years ago

Year householders moved into residence in Mission Viejo
Houses and condos Apartments
Most commonly used house heating fuel in houses and condos in Mission Viejo, CA
  • 82.8%Utility gas
  • 13.9%Electricity
  • 1.3%Solar energy
  • 1.1%Bottled, tank, or LP gas
  • 0.6%No fuel used
  • 0.2%Wood
  • 0.1%Other fuel
Most commonly used house heating fuel in apartments in Mission Viejo, CA
  • 64.1%Utility gas
  • 31.7%Electricity
  • 2.2%No fuel used
  • 1.6%Bottled, tank, or LP gas
  • 0.3%Solar energy

Private vs. public school enrollment:

Students in private schools in grades 1 to 8 (elementary and middle school): 2,280
Here:

27.1%
California:

10.5%

Students in private schools in grades 9 to 12 (high school): 327
Here:

8.2%
California:

8.5%

Students in private undergraduate colleges: 763
Here:

15.5%
California:

15.9%
School Enrollment by Level of School for Male Students
School Enrollment by Level of School for Female Students
Age and Sex of Sensory-Disabled Noninstitutionalized Residents
Age and Sex of Physically-Disabled Noninstitutionalized Residents
Age and Sex of Mentally-Disabled Noninstitutionalized Residents
Age and Sex of Self-Care Disabled Noninstitutionalized Residents
Age and Sex of Go-Outside-Home Disabled Noninstitutionalized Residents
Age and Sex of Noninstitutionalized Residents with Employment Disability