Monfort Heights South, OH (Ohio) Houses and Residents
| Monfort Heights South: | $257,644 |
| Ohio: | $204,100 |
Total population: 4,527 (All urban)
Houses: 1,719 (1,670 occupied: 1,589 owner occupied, 81 renter occupied)
| % of renters here: | 5% |
| State: | 33% |
Housing density: 553 houses/condos per square mile
Median price asked for vacant for-sale houses and condos in 2022 in this county: $136,154.
Median contract rent in 2022: $995 (lower quartile is $625, upper quartile is $1,445)
Median gross rent in Monfort Heights South, OH in 2022: $1,237
Housing units in Monfort Heights South with a mortgage: 1,089 (102 second mortgage, 188 home equity loan, 18 both second mortgage and home equity loan)
Houses without a mortgage: 385
Compare current foreclosures near Monfort Heights South, OH:
| Photo | Address | Area | Beds / Baths | Price | Details |
|---|---|---|---|---|---|

|
#1
Beechwood Dr
Fairfield, OH 45014
|
2,468 sq. feet
|
4 baths 5 beds |
$264,900
|
show details |

|
#2
Werner Ave
Cincinnati, OH 45231
|
1,032 sq. feet
|
1 baths 2 beds |
$124,900
|
show details |

|
#3
Ann St
Newport, KY 41071
|
939 sq. feet
|
1 baths 2 beds |
show details | |

|
#4
Blossom Dr
Newport, KY 41076
|
1,823 sq. feet
|
2 baths 3 beds |
show details | |

|
#5
Perry St
Cincinnati, OH 45231
|
1,176 sq. feet
|
1 baths 2 beds |
show details | |

|
#6
Creekhill Dr
Cincinnati, OH 45231
|
1,352 sq. feet
|
3 baths 3 beds |
show details | |

|
#7
Williams St
Cincinnati, OH 45215
|
1,152 sq. feet
|
1 baths 2 beds |
show details | |

|
#8
Philloret Dr
Cincinnati, OH 45239
|
1,233 sq. feet
|
1 baths 3 beds |
show details | |

|
#9
Kirkup Ave
Cincinnati, OH 45213
|
2,142 sq. feet
|
2 baths 4 beds |
show details | |

|
#10
Linda Dr
Cincinnati, OH 45238
|
1,131 sq. feet
|
2 baths 3 beds |
show details |
| Photo | Address | Area | Beds / Baths | Price | Details |
|---|---|---|---|---|---|

|
#11
Race Rd
Cincinnati, OH 45211
|
1,523 sq. feet
|
2 baths 3 beds |
show details | |

|
#12
Woodlyn Hills Dr
Erlanger, KY 41018
|
1,908 sq. feet
|
3 baths 3 beds |
show details | |

|
#13
Musket Cir
Independence, KY 41051
|
1,147 sq. feet
|
2 baths 3 beds |
show details | |

|
#14
Stormy Way
Cincinnati, OH 45230
|
2,448 sq. feet
|
2 baths 4 beds |
show details | |

|
#15
Garvey Ave
Erlanger, KY 41018
|
848 sq. feet
|
1 baths 3 beds |
show details | |

|
#16
Leway Dr
Fairfield, OH 45014
|
960 sq. feet
|
1 baths 4 beds |
show details | |

|
#17
Alex Ct
Hebron, KY 41048
|
1,432 sq. feet
|
2 baths 3 beds |
show details | |

|
#18
Glade Ave
Cincinnati, OH 45230
|
1,138 sq. feet
|
1 baths 3 beds |
show details | |

|
#19
Andrew St
Cincinnati, OH 45217
|
1,172 sq. feet
|
1 baths 3 beds |
show details | |

|
#20
Lexington Dr
Erlanger, KY 41018
|
1,063 sq. feet
|
1 baths 3 beds |
show details |
| Photo | Address | Area | Beds / Baths | Price | Details |
|---|---|---|---|---|---|

|
#21
Bertus St
Cincinnati, OH 45217
|
1,488 sq. feet
|
2 baths 2 beds |
show details | |

|
#22
Knollridge Ln
Cincinnati, OH 45231
|
1,307 sq. feet
|
2 baths 3 beds |
show details | |

|
#23
Ramble Vw Unit 102
Cincinnati, OH 45231
|
1,129 sq. feet
|
2 baths 2 beds |
show details | |

|
#24
Delhi Ave
Cincinnati, OH 45204
|
950 sq. feet
|
1 baths 3 beds |
show details | |

|
#25
Cascade Rd
Cincinnati, OH 45240
|
1,423 sq. feet
|
1 baths 4 beds |
show details | |

|
#26
Timberlake Ave
Erlanger, KY 41018
|
1,014 sq. feet
|
1 baths 3 beds |
show details | |

|
#27
Oakhurst Ct
Cincinnati, OH 45241
|
2,987 sq. feet
|
2 baths 4 beds |
show details | |

|
#28
N Bend Rd
Cincinnati, OH 45211
|
1,240 sq. feet
|
2 baths 3 beds |
show details | |

|
#29
Virginia Ave
Cincinnati, OH 45236
|
985 sq. feet
|
1 baths 3 beds |
show details | |

|
#30
Plainfield Rd
Cincinnati, OH 45236
|
1,296 sq. feet
|
1 baths 3 beds |
show details |
| Photo | Address | Area | Beds / Baths | Price | Details |
|---|---|---|---|---|---|

|
#31
Neuss Ave
Cincinnati, OH 45246
|
1,960 sq. feet
|
2 baths 4 beds |
show details | |

|
#32
Circle Dr
Harrison, OH 45030
|
1,180 sq. feet
|
1 baths 3 beds |
show details | |

|
#33
Stewart Ave # 1
Cincinnati, OH 45227
|
1,520 sq. feet
|
2 baths 2 beds |
show details | |

|
#34
N Kathwood Cir
Cincinnati, OH 45236
|
1,916 sq. feet
|
2 baths 3 beds |
show details | |

|
#35
Plainfield Rd # 2
Cincinnati, OH 45236
|
2,146 sq. feet
|
2 baths 4 beds |
show details | |

|
#36
Citadel Dr
Fairfield, OH 45014
|
1,284 sq. feet
|
1 baths 2 beds |
show details | |

|
#37
Providence Dr Apt 65
Fairfield, OH 45014
|
996 sq. feet
|
1 baths 2 beds |
show details | |

|
#38
Venus Ln
Fairfield, OH 45014
|
1,760 sq. feet
|
2 baths 3 beds |
show details | |

|
#39
Miami Ave
Cincinnati, OH 45226
|
2,523 sq. feet
|
1 baths 4 beds |
show details | |

|
#40
Old Duxbury Ct
Fairfield, OH 45014
|
2,120 sq. feet
|
3 baths 4 beds |
show details |
| Photo | Address | Area | Beds / Baths | Price | Details |
|---|---|---|---|---|---|

|
#41
Shenandoah Dr
Fairfield, OH 45014
|
1,673 sq. feet
|
2 baths 3 beds |
show details | |

|
#42
Maple Ave
Erlanger, KY 41018
|
1,078 sq. feet
|
1 baths 2 beds |
show details | |

|
#43
Applewood Dr
Fairfield, OH 45014
|
1,221 sq. feet
|
1 baths 3 beds |
show details | |

|
#44
Sampson Ln
Cincinnati, OH 45236
|
1,426 sq. feet
|
1 baths 2 beds |
show details | |

|
#45
Chandler St
Cincinnati, OH 45227
|
816 sq. feet
|
1 baths 1 beds |
show details | |

|
#46
Plainfield Rd
Cincinnati, OH 45236
|
936 sq. feet
|
1 baths 2 beds |
show details | |

|
#47
Ross Rd
Fairfield, OH 45014
|
1,650 sq. feet
|
2 baths 3 beds |
show details | |

|
#48
Huntington Ave
Latonia, KY 41015
|
1,339 sq. feet
|
1 baths - beds |
show details | |

|
#49
Samantha Dr
Burlington, KY 41005
|
1,740 sq. feet
|
2 baths 4 beds |
show details | |

|
Check over 1 million property listings on Foreclosure.com!
|
browse all offers | |||


Household type by relationship:
Households: 782,863- In family households: 616,598 (120,690 male householders, 76,881 female householders)
131,527 spouses, 229,101 children (215,936 natural, 5,006 adopted, 8,159 stepchildren), 17,828 grandchildren, 7,493 brothers or sisters, 5,119 parents, foster children, 8,379 other relatives, 16,869 non-relatives
- In nonfamily households: 166,265 (62,164 male householders (49,206 living alone)), 74,210 female householders (63,914 living alone)), 29,891 nonrelatives
- In group quarters: 19,511 (8,644 institutionalized population)
131,667 married couples with children.
66,083 single-parent households (10,055 men, 56,028 women).
96.1% of residents of Monfort Heights South speak English at home.
0.6% of residents speak Spanish at home (100% speak English very well).
2.7% of residents speak other Indo-European language at home (75% speak English very well, 20% speak English well, 5% speak English not well).
0.6% of residents speak Asian or Pacific Island language at home (63% speak English very well, 37% speak English well).
Foreign born population: 147 (3.3%)
(86.4% of them are naturalized citizens)
| Here: | 6.9 |
| State: | 6.7 |
| Here: | 5.3 |
| State: | 4.4 |

- Bedrooms in owner-occupied houses and condos in Monfort Heights South, Ohio
- 0no bedroom
- 61 bedroom
- 2672 bedrooms
- 8593 bedrooms
- 4044 bedrooms
- 535+ bedrooms

- Bedrooms in renter-occupied apartments in Monfort Heights South, Ohio
- 0no bedroom
- 161 bedroom
- 412 bedrooms
- 243 bedrooms
- 04 bedrooms
- 05+ bedrooms

- Cars and other vehicles available in Monfort Heights South in owner-occupied houses/condos
- 19no vehicle
- 3571 vehicle
- 7642 vehicles
- 2993 vehicles
- 1154 vehicles
- 355+ vehicles

- Cars and other vehicles available in Monfort Heights South in renter-occupied apartments
- 14no vehicle
- 241 vehicle
- 252 vehicles
- 113 vehicles
- 74 vehicles
- 05+ vehicles

- Rooms in owner-occupied houses in Monfort Heights South, Ohio
- 01 room
- 02 rooms
- 03 rooms
- 384 rooms
- 3545 rooms
- 3386 rooms
- 3647 rooms
- 2708 rooms
- 2259+ rooms

- Rooms in renter-occupied apartments in Monfort Heights South, Ohio
- 01 room
- 02 rooms
- 93 rooms
- 214 rooms
- 365 rooms
- 156 rooms
- 07 rooms
- 08 rooms
- 09+ rooms


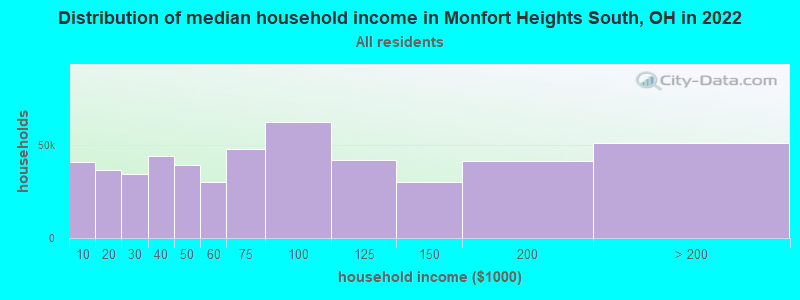
Monfort Heights South, OH household income distribution

- 40,620Less than $10,000
- 36,649$10,000 to $19,999
- 34,656$20,000 to $29,999
- 43,912$30,000 to $39,999
- 39,206$40,000 to $49,999
- 29,978$50,000 to $59,999
- 47,730$60,000 to $74,999
- 62,364$75,000 to $99,999
- 42,116$100,000 to $124,999
- 29,877$125,000 to $149,999
- 41,243$150,000 to $199,999
- 50,887$200,000 or more
Percentage of workers working in this county: 85.5%
Number of people working at home: 387 (15.4% of all workers)
Travel time to work (commute)
- Less than 5 minutes: 35
- 5 to 9 minutes: 164
- 10 to 14 minutes: 319
- 15 to 19 minutes: 479
- 20 to 24 minutes: 438
- 25 to 29 minutes: 242
- 30 to 34 minutes: 377
- 35 to 39 minutes: 82
- 40 to 44 minutes: 100
- 45 to 59 minutes: 58
- 60 to 89 minutes: 10
- 90 or more minutes: 43
Means of transportation to work:
- Drove a car alone: 2,126 (88.5%)
- Carpooled: 157 (6.5%)
- Bus or trolley bus: 60 (2.5%)
- Motorcycle: 4 (0.2%)
- Worked at home: 54 (2.2%)


- Year of entry for the foreign-born population in Monfort Heights South, Ohio
- 51995 to March 2000
- 01990 to 1994
- 51985 to 1989
- 101980 to 1984
- 151975 to 1979
- 01970 to 1974
- 01965 to 1969
- 51Before 1965

First ancestries reported:
- German: 2,400 (45.0%)
- Irish: 790 (14.8%)
- English: 526 (9.9%)
- United States: 523 (9.8%)
- Italian: 304 (5.7%)
- Other: 257 (4.8%)
- French: 135 (2.5%)
- Scottish: 99 (1.9%)
- Polish: 85 (1.6%)
- Dutch: 47 (0.9%)
- Greek: 36 (0.7%)
- Scotch-Irish: 35 (0.7%)
- Welsh: 23 (0.4%)
- Swiss: 18 (0.3%)
- French Canadian: 16 (0.3%)
- Hungarian: 15 (0.3%)
- Arab: 6 (0.1%)
- Russian: 6 (0.1%)
- Ukrainian: 6 (0.1%)
- Subsaharan African: 4 (0.08%)
Most common places of birth for foreign-born residents (%):
| Monfort Heights South: | 24.4% (21) |
| Ohio: | 7.8% (26,371) |
| Monfort Heights South: | 22.1% (19) |
| Ohio: | 6.3% (21,262) |
| Monfort Heights South: | 11.6% (10) |
| Ohio: | 3.4% (11,411) |
| Monfort Heights South: | 10.5% (9) |
| Ohio: | 1.5% (5,208) |
| Monfort Heights South: | 7.0% (6) |
| Ohio: | 3.1% (10,476) |
| Monfort Heights South: | 7.0% (6) |
| Ohio: | 2.4% (8,031) |
| Monfort Heights South: | 5.8% (5) |
| Ohio: | 4.7% (15,878) |
| Monfort Heights South: | 5.8% (5) |
| Ohio: | 3.8% (12,814) |
| Monfort Heights South: | 5.8% (5) |
| Ohio: | 0.7% (2,370) |
Place of birth for U.S.-born residents:
- This state: 3,790
- Other state: 696
- Northeast: 122
- Midwest: 176
- South: 382
- West: 16
71% of Monfort Heights South residents lived in the same house 5 years ago.
Out of people who lived in different houses, 87% lived in this county.
Out of people who lived in different counties, 52% lived in Ohio.
Education attainment for males 25 years and older:
- No schooling: 0
- Nursery to 4th grade: 0
- 5th and 6th grade: 0
- 7th and 8th grade: 21
- 9th grade: 22
- 10th grade: 65
- 11th grade: 14
- 12th grade, no diploma: 47
- High school graduate (or equivalency): 459
- Less than 1 year of college: 168
- Some college more than 1 year, no degree: 202
- Associate degree: 84
- Bachelor's degree: 301
- Master's degree: 62
- Professional school degree: 50
- Doctorate degree: 5

Education attainment for females 25 years and older:
- No schooling: 5
- Nursery to 4th grade: 0
- 5th and 6th grade: 0
- 7th and 8th grade: 41
- 9th grade: 8
- 10th grade: 26
- 11th grade: 35
- 12th grade, no diploma: 46
- High school graduate (or equivalency): 657
- Less than 1 year of college: 120
- Some college more than 1 year, no degree: 229
- Associate degree: 81
- Bachelor's degree: 283
- Master's degree: 74
- Professional school degree: 34
- Doctorate degree: 0


Housing units in structures:
- One, detached: 1,651
- Two: 14
- 3 or 4: 24
- 5 to 9: 30

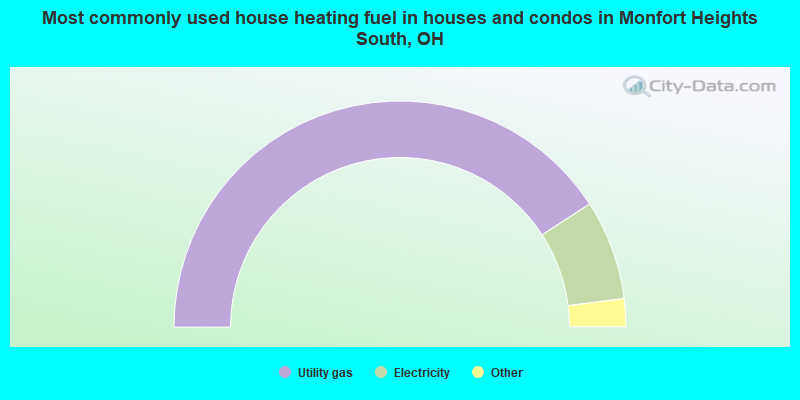
- 81.6%Utility gas
- 14.3%Electricity
- 2.8%Fuel oil, kerosene, etc.
- 1.2%Bottled, tank, or LP gas
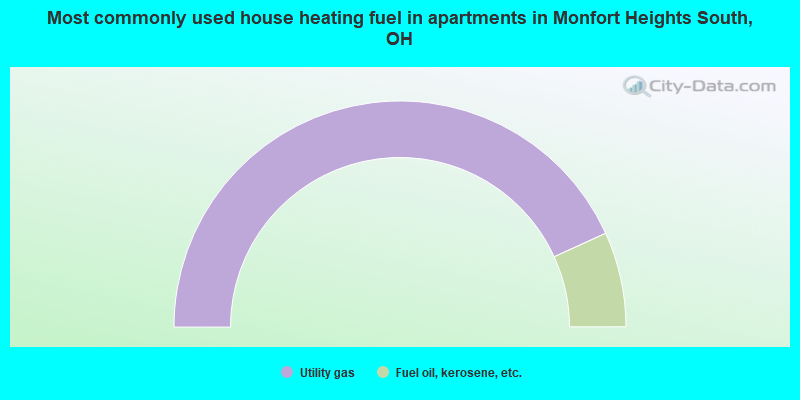
- 86.4%Utility gas
- 13.6%Fuel oil, kerosene, etc.
Private vs. public school enrollment:
| Here: | 43.7% |
| Ohio: | 14.2% |
| Here: | 62.7% |
| Ohio: | 10.9% |
| Here: | 8.5% |
| Ohio: | 23.4% |


