Monroeville, IN (Indiana) Houses and Residents
| Monroeville: | $114,804 |
| Indiana: | $208,700 |
Mean price in 2022:
Detached houses: $247,853
Here: $247,853 State: $257,916 Mobile homes: $18,080
Here: $18,080 State: $67,116
Total population: 1,292 (Urban population: 0, Rural population: 1,260 (15 farm, 1,245 nonfarm))
Houses: 559 (513 occupied: 340 owner occupied, 175 renter occupied)
| % of renters here: | 34% |
| State: | 29% |
Housing density: 744 houses/condos per square mile
Median price asked for vacant for-sale houses and condos in 2022: $146,831.
Median contract rent in 2022: $629 (lower quartile is $507, upper quartile is $752)
Median rent asked for vacant for-rent units in 2022: $754
Median gross rent in Monroeville, IN in 2022: $849
Housing units in Monroeville with a mortgage: 174 (18 second mortgage, 0 home equity loan, 14 both second mortgage and home equity loan)
Houses without a mortgage: 5
Median household income for houses/condos with a mortgage: $65,381
Median household income for apartments without a mortgage: $50,200
Median monthly housing costs: $786
Compare current foreclosures near Monroeville, IN:
| Photo | Address | Area | Beds / Baths | Price | Details |
|---|---|---|---|---|---|

|
#1
Elizabeth St
Fort Wayne, IN 46805
|
1,898 sq. feet
|
2 baths 4 beds |
show details | |

|
#2
S Calhoun St
Fort Wayne, IN 46807
|
1,334 sq. feet
|
1 baths 3 beds |
show details | |

|
#3
Edgeknoll Ln
Fort Wayne, IN 46816
|
925 sq. feet
|
1 baths 3 beds |
show details | |

|
#4
Mcclellan St
Fort Wayne, IN 46807
|
925 sq. feet
|
1 baths 3 beds |
show details | |

|
#5
Eckart St
Fort Wayne, IN 46806
|
1,560 sq. feet
|
1 baths 3 beds |
show details | |

|
#6
Penn Ave
Fort Wayne, IN 46805
|
1,245 sq. feet
|
1 baths 3 beds |
show details | |

|
#7
Twilight Ln
Fort Wayne, IN 46835
|
2,100 sq. feet
|
2 baths 4 beds |
show details | |

|
#8
Hawk Rdg
Harlan, IN 46743
|
- sq. feet
|
2 baths 3 beds |
show details | |

|
#9
Southcrest Rd
Fort Wayne, IN 46816
|
888 sq. feet
|
1 baths 3 beds |
show details | |

|
#10
Cardiff Ct
Fort Wayne, IN 46835
|
2,152 sq. feet
|
2 baths 4 beds |
show details |
| Photo | Address | Area | Beds / Baths | Price | Details |
|---|---|---|---|---|---|

|
#11
Dumont Dr
Fort Wayne, IN 46815
|
2,416 sq. feet
|
2 baths 4 beds |
show details | |

|
#12
Oakland St
Fort Wayne, IN 46808
|
1,668 sq. feet
|
2 baths 2 beds |
show details | |

|
#13
Taylor St
Yoder, IN 46798
|
2,050 sq. feet
|
2 baths 3 beds |
show details | |

|
#14
Marigold Dr
Fort Wayne, IN 46815
|
1,296 sq. feet
|
1 baths 3 beds |
show details | |

|
#15
Barr St
Fort Wayne, IN 46806
|
1,162 sq. feet
|
1 baths 3 beds |
show details | |

|
#16
Arlington Ave
Fort Wayne, IN 46807
|
1,304 sq. feet
|
2 baths 4 beds |
show details | |

|
#17
Black Oak Blvd
Fort Wayne, IN 46835
|
2,166 sq. feet
|
2 baths 4 beds |
show details | |

|
#18
N Anthony Blvd
Fort Wayne, IN 46805
|
936 sq. feet
|
1 baths 2 beds |
show details | |

|
#19
S Calhoun St
Fort Wayne, IN 46807
|
1,308 sq. feet
|
1 baths 3 beds |
show details | |

|
#20
Buell Dr
Fort Wayne, IN 46807
|
1,176 sq. feet
|
1 baths 3 beds |
show details |
| Photo | Address | Area | Beds / Baths | Price | Details |
|---|---|---|---|---|---|

|
#21
E Suttenfield St
Fort Wayne, IN 46803
|
2,148 sq. feet
|
1 baths 4 beds |
show details | |

|
#22
Kensington Blvd
Fort Wayne, IN 46805
|
1,940 sq. feet
|
2 baths 3 beds |
show details | |

|
#23
W Fleming Ave
Fort Wayne, IN 46807
|
2,308 sq. feet
|
2 baths 4 beds |
show details | |

|
#24
Buesching Dr
Fort Wayne, IN 46815
|
1,434 sq. feet
|
1 baths 3 beds |
show details | |

|
#25
Dodge Ave
Fort Wayne, IN 46805
|
995 sq. feet
|
1 baths 3 beds |
show details | |

|
#26
Road 87
Paulding, OH 45879
|
1,180 sq. feet
|
1 baths 3 beds |
show details | |

|
#27
S Harrison St
Fort Wayne, IN 46807
|
714 sq. feet
|
1 baths 2 beds |
show details | |

|
#28
Kenwood Ave
Fort Wayne, IN 46805
|
825 sq. feet
|
1 baths 2 beds |
show details | |

|
#29
Ivy League Dr
Fort Wayne, IN 46805
|
1,160 sq. feet
|
2 baths 3 beds |
show details | |

|
#30
Saint Joe Center Rd
Fort Wayne, IN 46835
|
1,092 sq. feet
|
1 baths 3 beds |
show details |
| Photo | Address | Area | Beds / Baths | Price | Details |
|---|---|---|---|---|---|

|
#31
S Wayne Ave
Fort Wayne, IN 46807
|
1,672 sq. feet
|
2 baths 5 beds |
show details | |

|
#32
Hoagland Ave
Fort Wayne, IN 46807
|
2,408 sq. feet
|
2 baths 3 beds |
show details | |

|
#33
Violet Ct
Fort Wayne, IN 46807
|
1,752 sq. feet
|
1 baths 2 beds |
show details | |

|
#34
Reed Rd
Fort Wayne, IN 46835
|
1,708 sq. feet
|
1 baths 3 beds |
show details | |

|
#35
Hubertus Ave
Fort Wayne, IN 46805
|
1,068 sq. feet
|
1 baths 1 beds |
show details | |

|
#36
Liberty St
Fort Wayne, IN 46803
|
1,187 sq. feet
|
2 baths 3 beds |
show details | |

|
#37
Webster St
Fort Wayne, IN 46807
|
1,288 sq. feet
|
1 baths 3 beds |
show details | |

|
#38
Webster St
Fort Wayne, IN 46807
|
1,450 sq. feet
|
1 baths 3 beds |
show details | |

|
#39
E Leith St
Fort Wayne, IN 46806
|
1,632 sq. feet
|
1 baths 4 beds |
show details | |

|
#40
Stellhorn Rd
Fort Wayne, IN 46815
|
2,208 sq. feet
|
2 baths 3 beds |
show details |
| Photo | Address | Area | Beds / Baths | Price | Details |
|---|---|---|---|---|---|

|
#41
Clara Ave
Fort Wayne, IN 46805
|
797 sq. feet
|
1 baths 2 beds |
show details | |

|
#42
Charlotte Ave
Fort Wayne, IN 46805
|
1,160 sq. feet
|
1 baths 3 beds |
show details | |

|
#43
Reed Rd
Fort Wayne, IN 46835
|
1,684 sq. feet
|
1 baths 3 beds |
show details | |

|
#44
Pasadena Dr
Fort Wayne, IN 46807
|
860 sq. feet
|
1 baths 2 beds |
show details | |

|
#45
Kenilworth St
Fort Wayne, IN 46806
|
1,398 sq. feet
|
1 baths 3 beds |
show details | |

|
#46
S Wayne Ave
Fort Wayne, IN 46807
|
1,144 sq. feet
|
1 baths 3 beds |
show details | |

|
#47
Woodway Dr
Fort Wayne, IN 46835
|
2,686 sq. feet
|
2 baths 4 beds |
show details | |

|
#48
Trier Rd
Fort Wayne, IN 46815
|
2,078 sq. feet
|
2 baths 4 beds |
show details | |

|
#49
Knightway Dr
Fort Wayne, IN 46815
|
1,904 sq. feet
|
2 baths 4 beds |
show details | |

|
Check over 1 million property listings on Foreclosure.com!
|
browse all offers | |||

Latest news about housing in Monroeville, IN collected exclusively by city-data.com from local newspapers, TV, and radio stations


Median year apartment built: 1981
Household type by relationship:
Households: 1,161- Male householders: 274 (141 living alone), Female householders: 236 (49 living alone)
221 spouses (221 opposite-sex spouses), 35 unmarried partners, (33 opposite-sex unmarried partners), 291 children (266 natural, 2 adopted, 23 stepchildren), 9 grandchildren, 17 brothers or sisters, 0 parents, 0 foster children, 8 other relatives, 8 non-relatives
- In group quarters: 59
Size of family households: 177 2-persons, 42 3-persons, 35 4-persons, 43 5-persons, 2 6-persons.
Size of nonfamily households: 188 1-person, 18 2-persons, 4 3-persons.
155 married couples with children.
56 single-parent households (14 men, 42 women).
98.6% of residents of Monroeville speak English at home.
0.3% of residents speak Spanish at home (100% speak English very well).
0.6% of residents speak other Indo-European language at home (100% speak English very well).
| Here: | 6.5 |
| State: | 6.6 |
| Here: | 4.9 |
| State: | 4.3 |

- Bedrooms in owner-occupied houses and condos in Monroeville, Indiana
- 0no bedroom
- 31 bedroom
- 732 bedrooms
- 1913 bedrooms
- 544 bedrooms
- 195+ bedrooms

- Bedrooms in renter-occupied apartments in Monroeville, Indiana
- 0no bedroom
- 251 bedroom
- 802 bedrooms
- 503 bedrooms
- 84 bedrooms
- 125+ bedrooms

- Cars and other vehicles available in Monroeville in owner-occupied houses/condos
- 15no vehicle
- 701 vehicle
- 1582 vehicles
- 573 vehicles
- 304 vehicles
- 105+ vehicles

- Cars and other vehicles available in Monroeville in renter-occupied apartments
- 7no vehicle
- 1151 vehicle
- 462 vehicles
- 33 vehicles
- 44 vehicles
- 05+ vehicles

- Rooms in owner-occupied houses in Monroeville, Indiana
- 01 room
- 02 rooms
- 33 rooms
- 124 rooms
- 505 rooms
- 1186 rooms
- 607 rooms
- 468 rooms
- 509+ rooms

- Rooms in renter-occupied apartments in Monroeville, Indiana
- 01 room
- 02 rooms
- 233 rooms
- 574 rooms
- 425 rooms
- 286 rooms
- 107 rooms
- 38 rooms
- 129+ rooms


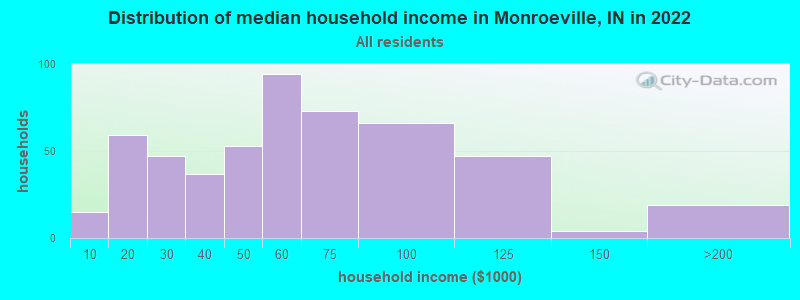
Monroeville, IN household income distribution

- 15Less than $10,000
- 59$10,000 to $19,999
- 47$20,000 to $29,999
- 37$30,000 to $39,999
- 53$40,000 to $49,999
- 94$50,000 to $59,999
- 73$60,000 to $74,999
- 66$75,000 to $99,999
- 47$100,000 to $124,999
- 4$125,000 to $149,999
- 19$150,000 to $199,999
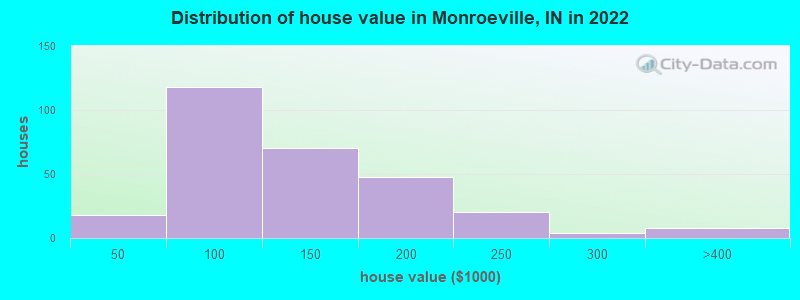
Home value of owner - occupied houses in 2022 in Monroeville, IN
-
- 2Less than $10,000
- 2$10,000 to $14,999
- 4$20,000 to $24,999
- 2$25,000 to $29,999
- 5$40,000 to $49,999
- 5$50,000 to $59,999
- 24$60,000 to $69,999
- 23$70,000 to $79,999
- 17$80,000 to $89,999
- 41$90,000 to $99,999
- 32$100,000 to $124,999
- 37$125,000 to $149,999
- 22$150,000 to $174,999
- 26$175,000 to $199,999
- 19$200,000 to $249,999
- 3$250,000 to $299,999
- 8$300,000 to $399,999
Rent paid by renters in 2022 in Monroeville, IN
-
- 1$250 to $299
- 1$350 to $399
- 13$400 to $449
- 9$450 to $499
- 42$550 to $599
- 5$600 to $649
- 21$650 to $699
- 14$700 to $749
- 6$750 to $799
- 6$800 to $899
- 8$1,000 to $1,249


Percentage of workers working in this county: 80.8%
Number of people working at home: 16 (3.0% of all workers)
Travel time to work (commute)
- Less than 5 minutes: 12
- 5 to 9 minutes: 68
- 10 to 14 minutes: 7
- 15 to 19 minutes: 45
- 20 to 24 minutes: 25
- 25 to 29 minutes: 27
- 30 to 34 minutes: 175
- 35 to 39 minutes: 22
- 40 to 44 minutes: 22
- 45 to 59 minutes: 54
- 60 to 89 minutes: 0
- 90 or more minutes: 6

Means of transportation to work:
- Drove a car alone: 266 (66.8%)
- Carpooled: 62 (15.6%)
- Taxi: 50 (12.6%)
- Bicycle: 5 (1.3%)
- Walked: 5 (1.3%)
- Worked at home: 23 (5.8%)

- Unemployment by race in 2022
- Unemployment rate for White non-Hispanic residents
- 1.2%Males
- 7.0%Females

- Year of entry for the foreign-born population in Monroeville, Indiana
- 21995 to March 2000
- 01990 to 1994
- 01985 to 1989
- 01980 to 1984
- 51975 to 1979
- 01970 to 1974
- 31965 to 1969
- 0Before 1965

First ancestries reported:
- German: 148 (35.7%)
- American: 58 (14.0%)
- English: 31 (7.5%)
- Dutch: 28 (6.8%)
- European: 28 (6.8%)
- Irish: 21 (5.1%)
- French: 17 (4.1%)
- Scottish: 11 (2.7%)
- Italian: 8 (1.9%)
- Norwegian: 4 (1.0%)
- Scandinavian: 4 (1.0%)
- Moroccan: 2 (0.5%)
- Polish: 2 (0.5%)
Most common places of birth for foreign-born residents (%):
| Monroeville: | 50.0% (5) |
| Indiana: | 33.3% (62,113) |
| Monroeville: | 30.0% (3) |
| Indiana: | 5.3% (9,823) |
| Monroeville: | 20.0% (2) |
| Indiana: | 4.9% (9,089) |
Place of birth for U.S.-born residents:
- This state: 951
- Other state: 180
- Northeast: 6
- Midwest: 104
- South: 24
- West: 44
88.9% of Monroeville residents lived in the same house 1 years ago.
Out of people who lived in different houses, 41.3% lived in this county.
Out of people who lived in different counties, 59.4% lived in Indiana.
| Monroeville: | 88.9% |
| State average: | 87.1% |
Education attainment for males 25 years and older:
- No schooling: 15
- Nursery to 4th grade: 0
- 5th and 6th grade: 0
- 7th and 8th grade: 4
- 9th grade: 1
- 10th grade: 15
- 11th grade: 0
- 12th grade, no diploma: 4
- High school graduate (or equivalency): 250
- Less than 1 year of college: 53
- Some college more than 1 year, no degree: 39
- Associate degree: 25
- Bachelor's degree: 29
- Master's degree: 6
- Professional school degree: 0
- Doctorate degree: 0

Education attainment for females 25 years and older:
- No schooling: 0
- Nursery to 4th grade: 3
- 5th and 6th grade: 0
- 7th and 8th grade: 6
- 9th grade: 0
- 10th grade: 3
- 11th grade: 4
- 12th grade, no diploma: 30
- High school graduate (or equivalency): 229
- Less than 1 year of college: 38
- Some college more than 1 year, no degree: 25
- Associate degree: 39
- Bachelor's degree: 36
- Master's degree: 16
- Professional school degree: 0
- Doctorate degree: 0


Housing units in structures:
- One, detached: 432
- Two: 12
- 3 or 4: 6
- 5 to 9: 13
- 20 to 49: 10
- 50 or more: 3
- Mobile homes: 82
Housing units lacking complete kitchen facilities in 2022: 2.6%
House/condo owner moved in on average 22 years ago
Renter moved in on average 6 years ago

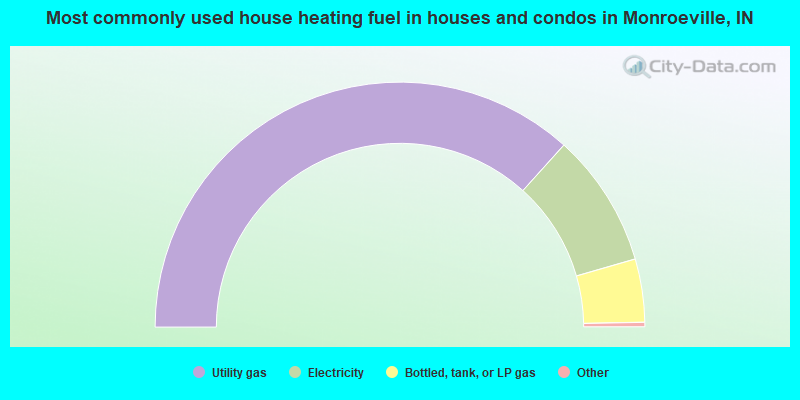
- 73.8%Utility gas
- 17.8%Electricity
- 8.4%Bottled, tank, or LP gas
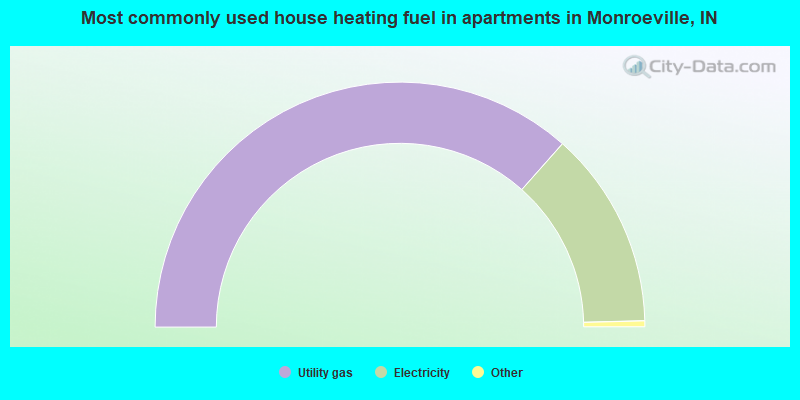
- 73.7%Utility gas
- 26.3%Electricity
Private vs. public school enrollment:
| Here: | 48.3% |
| Indiana: | 14.9% |
| Here: | 7.2% |
| Indiana: | 11.4% |
| Here: | 15.4% |
| Indiana: | 22.3% |


