Monroeville, OH (Ohio) Houses and Residents
| Monroeville: | $135,844 |
| Ohio: | $204,100 |
Mean price in 2022:
Detached houses: $135,139
Here: $135,139 State: $254,366
Total population: 1,377 (Urban population: 1,267 (all inside urban clusters), Rural population: 134 (all nonfarm))
Houses: 636 (569 occupied: 350 owner occupied, 225 renter occupied)
| % of renters here: | 39% |
| State: | 33% |
Housing density: 444 houses/condos per square mile
Median price asked for vacant for-sale houses and condos in 2022: $268,495.
Median contract rent in 2022: $655 (lower quartile is $503, upper quartile is $812)
Median rent asked for vacant for-rent units in 2022: $331
Median gross rent in Monroeville, OH in 2022: $964
Housing units in Monroeville with a mortgage: 228 (14 second mortgage, 3 home equity loan, 11 both second mortgage and home equity loan)
Houses without a mortgage: 54
Median household income for houses/condos with a mortgage: $74,117
Median household income for apartments without a mortgage: $42,407
Median monthly housing costs: $885
Compare current foreclosures near Monroeville, OH:
| Photo | Address | Area | Beds / Baths | Price | Details |
|---|---|---|---|---|---|

|
#1
State Route 162
Monroeville, OH 44847
|
1,342 sq. feet
|
1 baths 2 beds |
show details | |

|
#2
West St
Monroeville, OH 44847
|
- sq. feet
|
- baths - beds |
show details | |

|
#3
North St
Monroeville, OH 44847
|
- sq. feet
|
- baths - beds |
show details | |

|
#4
Riley Rd
Milan, OH 44846
|
1,303 sq. feet
|
2 baths 3 beds |
$239,900
|
show details |

|
#5
Moore Ave
Bellevue, OH 44811
|
888 sq. feet
|
1 baths 2 beds |
$144,500
|
show details |

|
#6
Maple Ave
Sandusky, OH 44870
|
1,140 sq. feet
|
1 baths 2 beds |
show details | |

|
#7
Magnolia Rd
Huron, OH 44839
|
1,352 sq. feet
|
1 baths 3 beds |
show details | |

|
#8
Jacquie Ln
Norwalk, OH 44857
|
1,200 sq. feet
|
1 baths 3 beds |
show details | |

|
#9
Knupke St
Sandusky, OH 44870
|
1,280 sq. feet
|
1 baths 3 beds |
show details | |

|
#10
Mccartney Rd
Sandusky, OH 44870
|
1,804 sq. feet
|
1 baths 3 beds |
show details |
| Photo | Address | Area | Beds / Baths | Price | Details |
|---|---|---|---|---|---|

|
#11
Alpine Dr
Sandusky, OH 44870
|
1,752 sq. feet
|
2 baths 3 beds |
show details | |

|
#12
County Road 175
Clyde, OH 43410
|
1,038 sq. feet
|
1 baths 3 beds |
show details | |

|
#13
Wamajo Dr
Sandusky, OH 44870
|
960 sq. feet
|
1 baths 3 beds |
show details | |

|
#14
Vine St
Sandusky, OH 44870
|
1,120 sq. feet
|
1 baths 2 beds |
show details | |

|
#15
Clinton St
Sandusky, OH 44870
|
1,504 sq. feet
|
1 baths 4 beds |
show details | |

|
#16
Pearl St
Sandusky, OH 44870
|
2,156 sq. feet
|
2 baths 3 beds |
show details | |

|
#17
Avondale St
Sandusky, OH 44870
|
1,320 sq. feet
|
1 baths 3 beds |
show details | |

|
#18
Columbus Ave
Sandusky, OH 44870
|
1,576 sq. feet
|
2 baths 3 beds |
show details | |

|
#19
Crystal Rock Ave
Sandusky, OH 44870
|
902 sq. feet
|
1 baths 2 beds |
show details | |

|
#20
Wamajo Dr
Sandusky, OH 44870
|
1,196 sq. feet
|
1 baths 3 beds |
show details |
| Photo | Address | Area | Beds / Baths | Price | Details |
|---|---|---|---|---|---|

|
#21
Buckingham St
Sandusky, OH 44870
|
1,232 sq. feet
|
1 baths 2 beds |
show details | |

|
#22
N State Route 510
Vickery, OH 43464
|
1,243 sq. feet
|
1 baths 3 beds |
show details | |

|
#23
Main Rd
Berlin Heights, OH 44814
|
3,374 sq. feet
|
3 baths 5 beds |
show details | |

|
#24
Sherman St
Sandusky, OH 44870
|
1,288 sq. feet
|
1 baths 2 beds |
show details | |

|
#25
Woodland Ave
Willard, OH 44890
|
2,048 sq. feet
|
3 baths 5 beds |
show details | |

|
#26
Laurel Rd
Huron, OH 44839
|
1,192 sq. feet
|
1 baths 3 beds |
show details | |

|
#27
Fink St
Willard, OH 44890
|
1,568 sq. feet
|
1 baths 3 beds |
show details | |

|
#28
E Perkins Ave
Sandusky, OH 44870
|
1,996 sq. feet
|
1 baths 2 beds |
show details | |

|
#29
C St
Sandusky, OH 44870
|
2,128 sq. feet
|
2 baths 4 beds |
show details | |

|
#30
Wayne St
Sandusky, OH 44870
|
5,516 sq. feet
|
4 baths 6 beds |
show details |
| Photo | Address | Area | Beds / Baths | Price | Details |
|---|---|---|---|---|---|

|
#31
W Madison St
Sandusky, OH 44870
|
1,176 sq. feet
|
1 baths 3 beds |
show details | |

|
#32
Perry St
Sandusky, OH 44870
|
1,248 sq. feet
|
1 baths 3 beds |
show details | |

|
#33
N Woodland Ave
Clyde, OH 43410
|
1,264 sq. feet
|
1 baths 3 beds |
show details | |

|
#34
State Route 113 E
Berlin Heights, OH 44814
|
1,582 sq. feet
|
1 baths 3 beds |
show details | |

|
#35
Race St
Clyde, OH 43410
|
1,876 sq. feet
|
2 baths 3 beds |
show details | |

|
#36
Pierce St
Wakeman, OH 44889
|
660 sq. feet
|
1 baths 2 beds |
show details | |

|
#37
George St
Clyde, OH 43410
|
1,110 sq. feet
|
1 baths 3 beds |
show details | |

|
#38
Bay Shore Dr
Sandusky, OH 44870
|
2,625 sq. feet
|
2 baths 3 beds |
show details | |

|
#39
Mechanic St
Clyde, OH 43410
|
984 sq. feet
|
1 baths 3 beds |
show details | |

|
#40
E Adams St
Sandusky, OH 44870
|
2,260 sq. feet
|
2 baths 4 beds |
show details |
| Photo | Address | Area | Beds / Baths | Price | Details |
|---|---|---|---|---|---|

|
#41
Franklin St
Sandusky, OH 44870
|
2,137 sq. feet
|
2 baths 3 beds |
show details | |

|
#42
W Madison St
Sandusky, OH 44870
|
999 sq. feet
|
1 baths 3 beds |
show details | |

|
#43
E Madison St
Sandusky, OH 44870
|
864 sq. feet
|
1 baths 2 beds |
show details | |

|
#44
Fitchville River Rd
Wakeman, OH 44889
|
2,496 sq. feet
|
2 baths 4 beds |
show details | |

|
#45
State Route 113
Wakeman, OH 44889
|
1,369 sq. feet
|
3 baths 3 beds |
show details | |

|
#46
Perry St
Sandusky, OH 44870
|
2,291 sq. feet
|
2 baths 5 beds |
show details | |

|
#47
Jackson St
Sandusky, OH 44870
|
2,036 sq. feet
|
2 baths 5 beds |
show details | |

|
#48
Putnam St
Sandusky, OH 44870
|
1,800 sq. feet
|
1 baths 3 beds |
show details | |

|
#49
Hull Rd
Sandusky, OH 44870
|
2,216 sq. feet
|
2 baths 3 beds |
show details | |

|
Check over 1 million property listings on Foreclosure.com!
|
browse all offers | |||

Latest news about housing in Monroeville, OH collected exclusively by city-data.com from local newspapers, TV, and radio stations

 | Hoping to move to Columbus by Spring 2018 (7 replies) |
| Please Tell Me About Youngstown (98 replies) |
| Cleveland getting some love from the national press (23 replies) |
| :Buckeye Photo Thread: (411 replies) |
| What Ohio city are you from? (123 replies) |
| Help! Need info on towns southeast of Toledo! (10 replies) |

Median year apartment built: 1963
Household type by relationship:
Households: 1,385- Male householders: 281 (64 living alone), Female householders: 282 (100 living alone)
227 spouses (227 opposite-sex spouses), 34 unmarried partners, (27 opposite-sex unmarried partners), 463 children (445 natural, 0 adopted, 17 stepchildren), 37 grandchildren, 17 brothers or sisters, 1 parents, 8 foster children, 20 other relatives, 7 non-relatives
Size of family households: 196 2-persons, 60 3-persons, 67 4-persons, 40 5-persons, 11 6-persons.
Size of nonfamily households: 171 1-person, 28 2-persons.
123 married couples with children.
243 single-parent households (153 men, 90 women).
96.7% of residents of Monroeville speak English at home.
2.6% of residents speak Spanish at home (100% speak English very well).
0.3% of residents speak other Indo-European language at home (100% speak English very well).
Foreign born population: 16 (1.2%)
(18.8% of them are naturalized citizens)
| Here: | 6.7 |
| State: | 6.7 |
| Here: | 5.5 |
| State: | 4.4 |

- Bedrooms in owner-occupied houses and condos in Monroeville, Ohio
- 0no bedroom
- 61 bedroom
- 562 bedrooms
- 2243 bedrooms
- 584 bedrooms
- 65+ bedrooms

- Bedrooms in renter-occupied apartments in Monroeville, Ohio
- 0no bedroom
- 361 bedroom
- 942 bedrooms
- 523 bedrooms
- 354 bedrooms
- 95+ bedrooms

- Cars and other vehicles available in Monroeville in owner-occupied houses/condos
- 4no vehicle
- 1151 vehicle
- 1492 vehicles
- 753 vehicles
- 24 vehicles
- 55+ vehicles

- Cars and other vehicles available in Monroeville in renter-occupied apartments
- 6no vehicle
- 1281 vehicle
- 702 vehicles
- 203 vehicles
- 04 vehicles
- 05+ vehicles

- Rooms in owner-occupied houses in Monroeville, Ohio
- 01 room
- 02 rooms
- 03 rooms
- 04 rooms
- 585 rooms
- 1046 rooms
- 847 rooms
- 608 rooms
- 459+ rooms

- Rooms in renter-occupied apartments in Monroeville, Ohio
- 01 room
- 02 rooms
- 143 rooms
- 634 rooms
- 355 rooms
- 926 rooms
- 107 rooms
- 118 rooms
- 09+ rooms


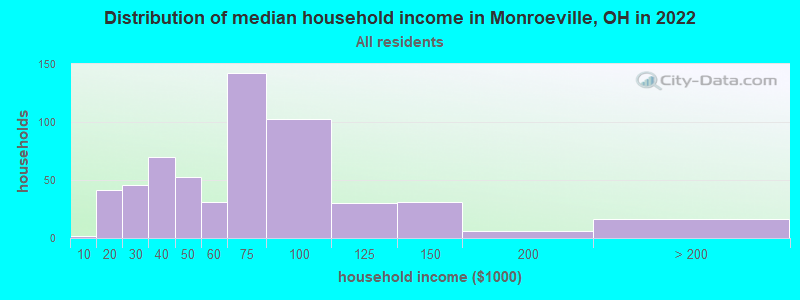
Monroeville, OH household income distribution

- 2Less than $10,000
- 41$10,000 to $19,999
- 46$20,000 to $29,999
- 70$30,000 to $39,999
- 53$40,000 to $49,999
- 31$50,000 to $59,999
- 142$60,000 to $74,999
- 103$75,000 to $99,999
- 30$100,000 to $124,999
- 31$125,000 to $149,999
- 6$150,000 to $199,999
- 16$200,000 or more
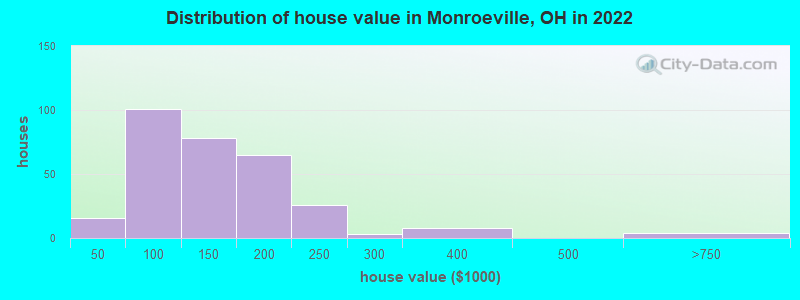
Home value of owner - occupied houses in 2022 in Monroeville, OH
-
- 3Less than $10,000
- 9$15,000 to $19,999
- 2$20,000 to $24,999
- 21$50,000 to $59,999
- 2$60,000 to $69,999
- 34$80,000 to $89,999
- 43$90,000 to $99,999
- 23$100,000 to $124,999
- 54$125,000 to $149,999
- 54$150,000 to $174,999
- 10$175,000 to $199,999
- 25$200,000 to $249,999
- 3$250,000 to $299,999
- 7$300,000 to $399,999
- 4$500,000 to $749,999
Rent paid by renters in 2022 in Monroeville, OH
-
- 12$350 to $399
- 17$400 to $449
- 20$450 to $499
- 29$500 to $549
- 14$550 to $599
- 8$600 to $649
- 43$650 to $699
- 8$700 to $749
- 15$750 to $799
- 20$800 to $899
- 18$900 to $999
- 6$1,000 to $1,249
- 5No cash rent

Percentage of workers working in this county: 55.7%
Number of people working at home: 18 (2.8% of all workers)
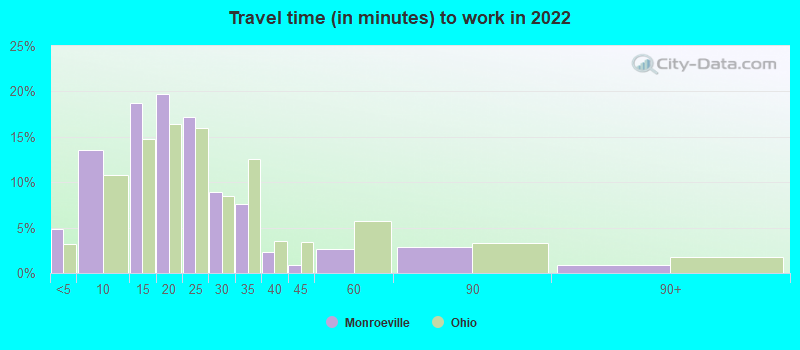
Travel time to work (commute)
- Less than 5 minutes: 42
- 5 to 9 minutes: 93
- 10 to 14 minutes: 64
- 15 to 19 minutes: 122
- 20 to 24 minutes: 67
- 25 to 29 minutes: 34
- 30 to 34 minutes: 78
- 35 to 39 minutes: 4
- 40 to 44 minutes: 41
- 45 to 59 minutes: 17
- 60 to 89 minutes: 27
- 90 or more minutes: 3
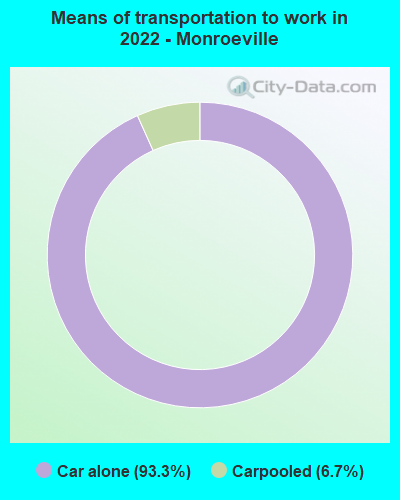
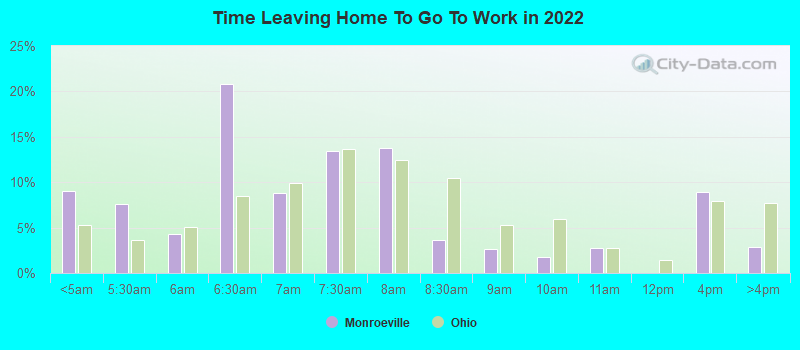
Means of transportation to work:
- Drove a car alone: 1,019 (88.1%)
- Carpooled: 79 (6.8%)
- Worked at home: 18 (1.6%)
- Unemployment by race in 2022
- Unemployment rate for White non-Hispanic residents
- 2.4%Males
- 2.4%Females
- Unemployment rate for two or more race residents
- 100.0%Males

- Year of entry for the foreign-born population in Monroeville, Ohio
- 02010 or later
- 02000 to 2009
- 01990 to 1999
- 01980 to 1989
- 01970 to 1979
- 3Before 1970

First ancestries reported:
- German: 301 (51.0%)
- English: 95 (16.1%)
- Polish: 31 (5.2%)
- American: 28 (4.7%)
- Italian: 23 (3.9%)
- Irish: 18 (3.0%)
- Egyptian: 12 (2.0%)
- Slovak: 12 (2.0%)
- Eastern European: 10 (1.7%)
- Swedish: 8 (1.4%)
- European: 7 (1.2%)
- Hungarian: 6 (1.0%)
- Norwegian: 6 (1.0%)
- Scottish: 6 (1.0%)
- Dutch: 5 (0.8%)
- French: 3 (0.5%)
Most common places of birth for foreign-born residents (%):
| Monroeville: | 75.0% (12) |
| Ohio: | 1.6% (9,312) |
| Monroeville: | 18.8% (3) |
| Ohio: | 0.0% (110) |
Place of birth for U.S.-born residents:
- This state: 1,205
- Other state: 155
- Northeast: 33
- Midwest: 45
- South: 58
- West: 18
92.8% of Monroeville residents lived in the same house 1 years ago.
Out of people who lived in different houses, 37.4% lived in this county.
Out of people who lived in different counties, 56.4% lived in Ohio.
| Monroeville: | 92.8% |
| State average: | 87.8% |
Education attainment for males 25 years and older:
- No schooling: 3
- Nursery to 4th grade: 0
- 5th and 6th grade: 0
- 7th and 8th grade: 0
- 9th grade: 0
- 10th grade: 11
- 11th grade: 6
- 12th grade, no diploma: 20
- High school graduate (or equivalency): 261
- Less than 1 year of college: 26
- Some college more than 1 year, no degree: 33
- Associate degree: 26
- Bachelor's degree: 53
- Master's degree: 4
- Professional school degree: 0
- Doctorate degree: 0

Education attainment for females 25 years and older:
- No schooling: 3
- Nursery to 4th grade: 0
- 5th and 6th grade: 0
- 7th and 8th grade: 0
- 9th grade: 0
- 10th grade: 0
- 11th grade: 8
- 12th grade, no diploma: 4
- High school graduate (or equivalency): 195
- Less than 1 year of college: 46
- Some college more than 1 year, no degree: 89
- Associate degree: 46
- Bachelor's degree: 31
- Master's degree: 25
- Professional school degree: 0
- Doctorate degree: 0


Housing units in structures:
- One, detached: 487
- One, attached: 12
- Two: 39
- 3 or 4: 57
- 5 to 9: 7
- 10 to 19: 30
- 20 to 49: 2
Housing units lacking complete kitchen facilities in 2022: 4.0%
House/condo owner moved in on average 21 years ago
Renter moved in on average 5 years ago

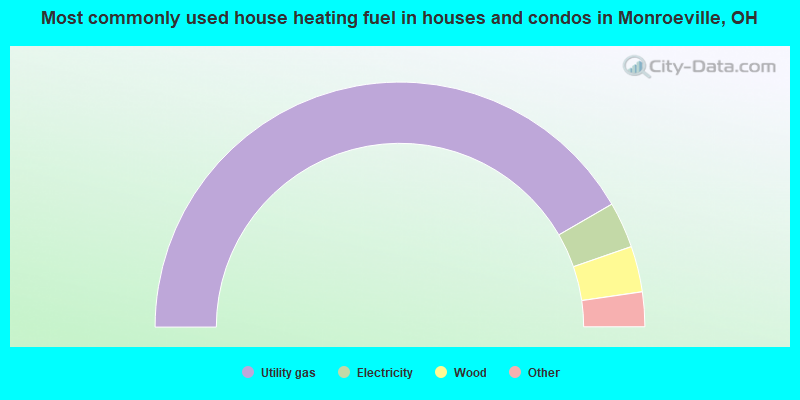
- 83.7%Utility gas
- 6.1%Electricity
- 6.1%Wood
- 3.8%Bottled, tank, or LP gas
- 0.3%No fuel used
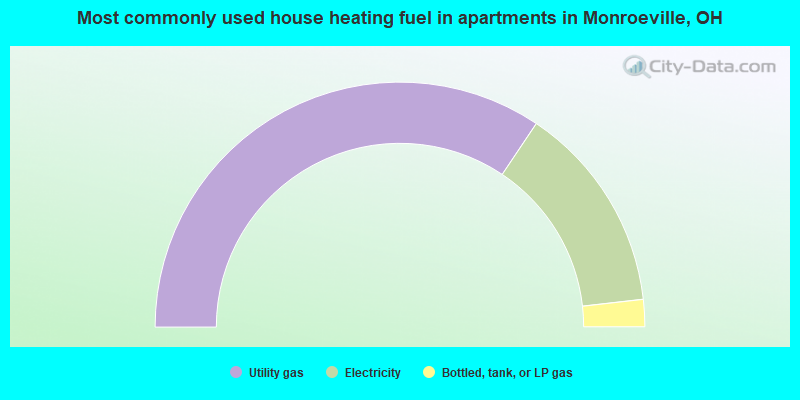
- 68.8%Utility gas
- 27.6%Electricity
- 3.6%Bottled, tank, or LP gas
Private vs. public school enrollment:
| Here: | 1.3% |
| Ohio: | 16.0% |
| Here: | 3.0% |
| Ohio: | 13.1% |
| Here: | 17.1% |
| Ohio: | 22.3% |


