Housing density: 1,066 houses/condos per square mile
Median price asked for vacant for-sale houses and condos in 2022: $792,286.
Median contract rent in 2022: $1,845 (lower quartile is $1,465, upper quartile is over $2,000)
Median rent asked for vacant for-rent units in 2022: $1,778
Median gross rent in Monrovia, CA in 2022: $1,956
Housing units in Monrovia with a mortgage: 4,048 (443 second mortgage, 17 home equity loan, 395 both second mortgage and home equity loan) Houses without a mortgage: 26
Median household income for houses/condos with a mortgage: $135,753
Median household income for apartments without a mortgage: $74,844
4,758 married couples with children.
1,883 single-parent households (568 men, 1,315 women).
56.5% of residents of Monrovia speak English at home.
29.0% of residents speak Spanish at home (75% speak English very well, 14% speak English well, 9% speak English not well, 2% don't speak English at all).
2.4% of residents speak other Indo-European language at home (68% speak English very well, 30% speak English well, 1% speak English not well, 1% don't speak English at all).
11.6% of residents speak Asian or Pacific Island language at home (62% speak English very well, 24% speak English well, 11% speak English not well, 3% don't speak English at all).
0.3% of residents speak other language at home (76% speak English very well, 19% speak English well, 5% speak English not well).
Foreign born population: 9,235 (25.1%)
(61.4% of them are naturalized citizens)
Percentage of workers working in this county: 95.9% Number of people working at home: 3,405 (17.7% of all workers)
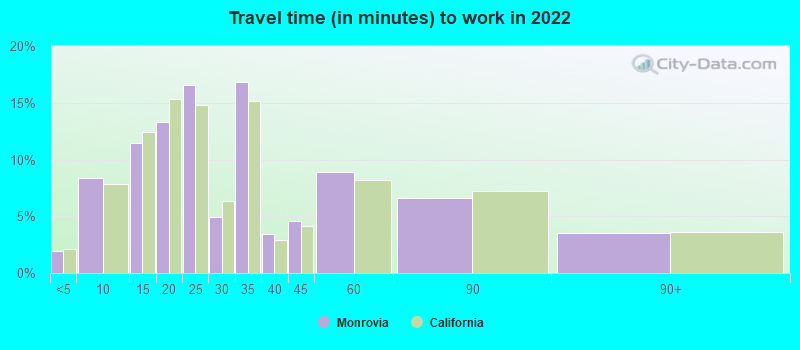
Travel time to work (commute)
Less than 5 minutes: 343
5 to 9 minutes: 1,204
10 to 14 minutes: 1,440
15 to 19 minutes: 1,559
20 to 24 minutes: 2,264
25 to 29 minutes: 897
30 to 34 minutes: 3,294
35 to 39 minutes: 467
40 to 44 minutes: 831
45 to 59 minutes: 1,786
60 to 89 minutes: 1,251
90 or more minutes: 495
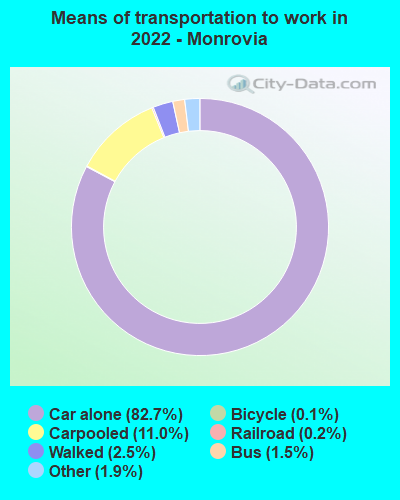
Means of transportation to work:
Drove a car alone: 13,609 (68.1%)
Carpooled: 2,007 (10.0%)
Bus: 223 (1.1%)
Subway or elevated rail: 7 (0.0%)
Light rail, streetcar or trolley: 15 (0.1%)
Taxi: 346 (1.7%)
Bicycle: 23 (0.1%)
Walked: 436 (2.2%)
Worked at home: 3,405 (17.0%)
Unemployment by race in 2022
Unemployment rate for White non-Hispanic residents
4.6%Males
1.6%Females
Unemployment rate for Black residents
3.7%Females
Unemployment rate for American Indian and Alaska Native residents
6.5%Males
Unemployment rate for Asian residents
4.9%Males
6.0%Females
Unemployment rate for other race residents
15.6%Males
0.4%Females
Unemployment rate for two or more race residents
1.3%Males
4.4%Females
Unemployment rate for Hispanic or Latino residents
6.8%Males
4.4%Females
Year of entry for the foreign-born population in Monrovia, California
1,6102010 or later
2,0222000 to 2009
1,7401990 to 1999
2,4771980 to 1989
1,5281970 to 1979
1,323Before 1970
First ancestries reported:
English: 691 (3.2%)
Irish: 492 (2.3%)
Italian: 482 (2.2%)
German: 436 (2.0%)
American: 264 (1.2%)
European: 250 (1.2%)
Hungarian: 148 (0.7%)
Norwegian: 137 (0.6%)
Iranian: 125 (0.6%)
Armenian: 114 (0.5%)
Dutch: 104 (0.5%)
Russian: 101 (0.5%)
Swedish: 95 (0.4%)
British: 85 (0.4%)
Ukrainian: 84 (0.4%)
Greek: 80 (0.4%)
African: 69 (0.3%)
Scandinavian: 61 (0.3%)
Scottish: 55 (0.3%)
Polish: 54 (0.2%)
Czech: 45 (0.2%)
Serbian: 43 (0.2%)
Danish: 35 (0.2%)
Scotch-Irish: 31 (0.1%)
Portuguese: 27 (0.1%)
Austrian: 27 (0.1%)
Egyptian: 26 (0.1%)
Australian: 24 (0.1%)
Lithuanian: 20 (0.09%)
Eastern European: 20 (0.09%)
French Canadian: 16 (0.07%)
Israeli: 16 (0.07%)
Czechoslovakian: 15 (0.07%)
Lebanese: 15 (0.07%)
Brazilian: 11 (0.05%)
Romanian: 10 (0.05%)
West Indian: 10 (0.05%)
Canadian: 9 (0.04%)
French: 9 (0.04%)
Finnish: 7 (0.03%)
Swiss: 7 (0.03%)
Maltese: 6 (0.03%)
Bahamian: 5 (0.02%)
Most common places of birth for foreign-born residents (%):
Mexico
Monrovia:
34.8% (3,217)
California:
37.2% (3,881,193)
China, excluding Hong Kong and Taiwan
Monrovia:
10.2% (939)
California:
6.6% (684,672)
Philippines
Monrovia:
8.2% (755)
California:
7.8% (818,297)
Taiwan
Monrovia:
7.5% (692)
California:
1.7% (176,274)
Guatemala
Monrovia:
4.7% (432)
California:
2.8% (290,436)
Vietnam
Monrovia:
3.9% (358)
California:
4.9% (512,335)
El Salvador
Monrovia:
3.5% (320)
California:
4.2% (440,287)
Korea
Monrovia:
3.0% (281)
California:
3.0% (315,248)
Iran
Monrovia:
1.8% (166)
California:
2.0% (206,004)
Place of birth for U.S.-born residents:
This state: 22,457
Other state: 4,816
Northeast: 875
Midwest: 1,541
South: 1,393
West: 960
90.8% of Monrovia residents lived in the same house 1 years ago. Out of people who lived in different houses, 43.8% lived in this county. Out of people who lived in different counties, 69.0% lived in California.
Monrovia:
90.8%
State average:
88.9%
Education attainment for males 25 years and older:
No schooling: 390
Nursery to 4th grade: 29
5th and 6th grade: 228
7th and 8th grade: 147
9th grade: 81
10th grade: 83
11th grade: 70
12th grade, no diploma: 332
High school graduate (or equivalency): 2,277
Less than 1 year of college: 753
Some college more than 1 year, no degree: 1,672
Associate degree: 896
Bachelor's degree: 3,308
Master's degree: 1,086
Professional school degree: 408
Doctorate degree: 398
Education attainment for females 25 years and older:
No schooling: 306
Nursery to 4th grade: 92
5th and 6th grade: 161
7th and 8th grade: 89
9th grade: 67
10th grade: 148
11th grade: 128
12th grade, no diploma: 311
High school graduate (or equivalency): 2,758
Less than 1 year of college: 658
Some college more than 1 year, no degree: 1,964
Associate degree: 1,025
Bachelor's degree: 3,887
Master's degree: 2,122
Professional school degree: 275
Doctorate degree: 191
Housing units in structures:
One, detached: 8,331
One, attached: 1,432
Two: 478
3 or 4: 1,021
5 to 9: 978
10 to 19: 650
20 to 49: 596
50 or more: 971
Mobile homes: 191
Median worth of mobile homes: $103,045
Housing units lacking complete plumbing facilities in 2022: 1.2%
Housing units lacking complete kitchen facilities in 2022: 2.4%
House/condo owner moved in on average 17 years ago