Montana City, MT (Montana) Houses and Residents
| Montana City: | $550,499 |
| Montana: | $366,400 |
Mean price in 2022:
Detached houses: $565,637
Here: $565,637 State: $518,333 Townhouses or other attached units: $709,873
Here: $709,873 State: $468,033
Total population: 2,715 (Urban population: 0, Rural population: 2,111 (15 farm, 2,096 nonfarm))
Houses: 1,090 (987 occupied: 939 owner occupied, 70 renter occupied)
| % of renters here: | 7% |
| State: | 31% |
Housing density: 39 houses/condos per square mile
Median price asked for vacant for-sale houses and condos in 2022 in this county: $237,247.
Median contract rent in 2022: $1,222 (lower quartile is $1,075, upper quartile is $1,743)
Median rent asked for vacant for-rent units in 2022: $962
Median gross rent in Montana City, MT in 2022: $1,285
Housing units in Montana City with a mortgage: 626 (49 second mortgage, 0 home equity loan, 47 both second mortgage and home equity loan)
Houses without a mortgage: 0
Median household income for houses/condos with a mortgage: $143,321
Median household income for apartments without a mortgage: $100,333
Median monthly housing costs: $1,668
Compare current foreclosures near Montana City, MT:
| Photo | Address | Area | Beds / Baths | Price | Details |
|---|---|---|---|---|---|

|
#1
Stacia Ave
Helena, MT 59601
|
1,057 sq. feet
|
1 baths 2 beds |
show details | |

|
#2
Buckskin Dr
Helena, MT 59602
|
2,128 sq. feet
|
2 baths 4 beds |
show details | |

|
#3
Elk Run Rd
Helena, MT 59602
|
1,596 sq. feet
|
2 baths 4 beds |
show details | |

|
#4
Griffin Rd
Helena, MT 59602
|
1,716 sq. feet
|
3 baths 5 beds |
show details | |

|
#5
Kt Ln
Helena, MT 59602
|
2,816 sq. feet
|
2 baths 2 beds |
show details | |

|
#6
Dutchman Ct
Helena, MT 59602
|
1,170 sq. feet
|
2 baths 3 beds |
show details | |

|
#7
Saint John Road
East Helena, MT 59635
|
2,096 sq. feet
|
2 baths 3 beds |
show details | |

|
#8
Wilder Ave
Helena, MT 59602
|
2,814 sq. feet
|
4 baths 6 beds |
show details | |

|
#9
Joslyn St, Trlr 110
Helena, MT 59601
|
576 sq. feet
|
1 baths 2 beds |
show details | |

|
#10
N Hill Rd
Helena, MT 59602
|
1,288 sq. feet
|
2 baths 3 beds |
show details |
| Photo | Address | Area | Beds / Baths | Price | Details |
|---|---|---|---|---|---|

|
#11
Lariat Rd
Helena, MT 59602
|
3,436 sq. feet
|
3 baths 5 beds |
show details | |

|
#12
Ferry Dr
Helena, MT 59602
|
1,232 sq. feet
|
1 baths 3 beds |
show details | |

|
#13
Last Straw Dr
Helena, MT 59602
|
2,281 sq. feet
|
2 baths 3 beds |
show details | |

|
#14
Kelly Rd
Helena, MT 59602
|
1,008 sq. feet
|
1 baths 3 beds |
show details | |

|
#15
Concord Rd
Helena, MT 59602
|
1,839 sq. feet
|
2 baths 3 beds |
show details | |

|
#16
Lone Pine Rd
Helena, MT 59602
|
1,836 sq. feet
|
2 baths 3 beds |
show details | |

|
#17
Elkview Rd
East Helena, MT 59635
|
924 sq. feet
|
1 baths 3 beds |
show details | |

|
#18
Western Dr
Helena, MT 59602
|
1,216 sq. feet
|
2 baths 3 beds |
show details | |

|
#19
Riviera Dr
Helena, MT 59602
|
924 sq. feet
|
1 baths 2 beds |
show details | |

|
#20
E 13th St
Helena, MT 59601
|
908 sq. feet
|
1 baths 1 beds |
show details |
| Photo | Address | Area | Beds / Baths | Price | Details |
|---|---|---|---|---|---|

|
#21
Claim Jumper Dr
Helena, MT 59602
|
- sq. feet
|
- baths - beds |
show details | |

|
#22
Poplar St
Helena, MT 59601
|
- sq. feet
|
- baths - beds |
show details | |

|
#23
Scott Dr
Helena, MT 59601
|
- sq. feet
|
- baths - beds |
show details | |

|
#24
E Broadway St Apt 11d
Helena, MT 59601
|
- sq. feet
|
- baths - beds |
show details | |

|
#25
Green Meadow Dr
Helena, MT 59602
|
- sq. feet
|
- baths - beds |
show details | |

|
#26
Quail Dr Apt D
Helena, MT 59602
|
- sq. feet
|
- baths - beds |
show details | |

|
#27
1/2 South Rodney Street
Helena, MT 59601
|
- sq. feet
|
- baths - beds |
show details | |

|
#28
Wickes Rd
Jefferson City, MT 59638
|
- sq. feet
|
- baths - beds |
show details | |

|
#29
Highway 282
Jefferson City, MT 59638
|
- sq. feet
|
- baths - beds |
show details | |

|
#30
Tizer Lake Rd
Jefferson City, MT 59638
|
- sq. feet
|
- baths - beds |
show details |
| Photo | Address | Area | Beds / Baths | Price | Details |
|---|---|---|---|---|---|

|
#31
Legend Loop, Apt 301
Helena, MT 59602
|
- sq. feet
|
- baths - beds |
show details | |

|
#32
Aspen St # 520
Helena, MT 59601
|
- sq. feet
|
- baths - beds |
show details | |

|
#33
Cole Ave Apt 3
Helena, MT 59601
|
- sq. feet
|
- baths - beds |
show details | |

|
#34
N Benton Ave
Helena, MT 59601
|
- sq. feet
|
- baths - beds |
show details | |

|
#35
E Clark St
East Helena, MT 59635
|
- sq. feet
|
- baths - beds |
show details | |

|
#36
Encore Way
Helena, MT 59602
|
- sq. feet
|
- baths - beds |
show details | |

|
#37
Colter Loop Dr
Helena, MT 59602
|
- sq. feet
|
- baths - beds |
show details | |

|
#38
Waukesha Ave
Helena, MT 59601
|
- sq. feet
|
- baths - beds |
show details | |

|
#39
Saint John Rd E
Helena, MT 59601
|
- sq. feet
|
- baths - beds |
show details | |

|
#40
N Washington St Apt 103
Helena, MT 59601
|
- sq. feet
|
- baths - beds |
show details |
| Photo | Address | Area | Beds / Baths | Price | Details |
|---|---|---|---|---|---|

|
Check over 1 million property listings on Foreclosure.com!
|
browse all offers | |||
| Photo | Address | Area | Beds / Baths | Price | Details |
|---|


 | Advice on a good apt., condo, townhouse for rent in Helena? (8 replies) |
| From Chicago to Montana (26 replies) |
| Describe the Major Montana Cities (11 replies) |
| Interesting article about Californians and moving (24 replies) |
| Kalispell, Helena, and Marion (48 replies) |
| Bigfork/White Fish, MT (30 replies) |

Median year apartment built: 1984
Household type by relationship:
Households: 2,793- Male householders: 513 (23 living alone), Female householders: 480 (39 living alone)
779 spouses (779 opposite-sex spouses), 43 unmarried partners, (43 opposite-sex unmarried partners), 757 children (714 natural, 9 adopted, 33 stepchildren), 15 grandchildren, 0 brothers or sisters, 89 parents, 0 foster children, 16 other relatives, 93 non-relatives
- In group quarters: 4
Size of family households: 396 2-persons, 218 3-persons, 164 4-persons, 54 5-persons, 41 6-persons.
Size of nonfamily households: 62 1-person, 27 2-persons, 38 3-persons, 4 4-persons.
486 married couples with children.
123 single-parent households (31 men, 92 women).
98.4% of residents of Montana City speak English at home.
1.4% of residents speak Spanish at home (32% speak English very well, 68% speak English not well).
0.3% of residents speak Asian or Pacific Island language at home (78% speak English very well, 22% speak English well).
Foreign born population: 127 (4.5%)
(44.1% of them are naturalized citizens)
| Here: | 7.8 |
| State: | 6.4 |
| Here: | 5.1 |
| State: | 4.2 |

- Bedrooms in owner-occupied houses and condos in Montana City, Montana
- 0no bedroom
- 211 bedroom
- 1192 bedrooms
- 2873 bedrooms
- 3754 bedrooms
- 1375+ bedrooms

- Bedrooms in renter-occupied apartments in Montana City, Montana
- 0no bedroom
- 61 bedroom
- 322 bedrooms
- 183 bedrooms
- 144 bedrooms
- 05+ bedrooms

- Cars and other vehicles available in Montana City in owner-occupied houses/condos
- 21no vehicle
- 921 vehicle
- 2802 vehicles
- 3043 vehicles
- 1224 vehicles
- 1205+ vehicles

- Cars and other vehicles available in Montana City in renter-occupied apartments
- 0no vehicle
- 411 vehicle
- 292 vehicles
- 03 vehicles
- 04 vehicles
- 05+ vehicles

- Rooms in owner-occupied houses in Montana City, Montana
- 01 room
- 42 rooms
- 63 rooms
- 414 rooms
- 735 rooms
- 1066 rooms
- 1637 rooms
- 1768 rooms
- 3719+ rooms

- Rooms in renter-occupied apartments in Montana City, Montana
- 01 room
- 02 rooms
- 63 rooms
- 114 rooms
- 255 rooms
- 186 rooms
- 07 rooms
- 08 rooms
- 99+ rooms


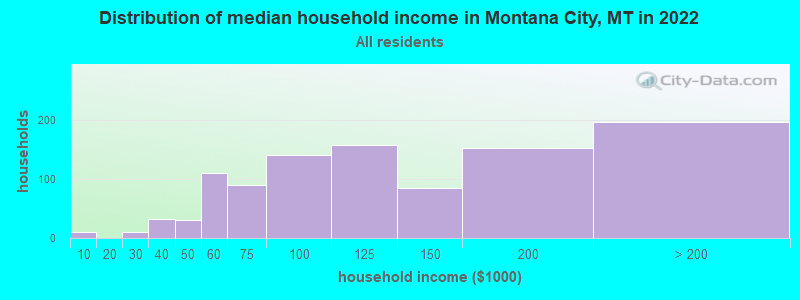
Montana City, MT household income distribution

- 10Less than $10,000
- 10$20,000 to $29,999
- 32$30,000 to $39,999
- 31$40,000 to $49,999
- 109$50,000 to $59,999
- 89$60,000 to $74,999
- 140$75,000 to $99,999
- 157$100,000 to $124,999
- 85$125,000 to $149,999
- 152$150,000 to $199,999
- 196$200,000 or more
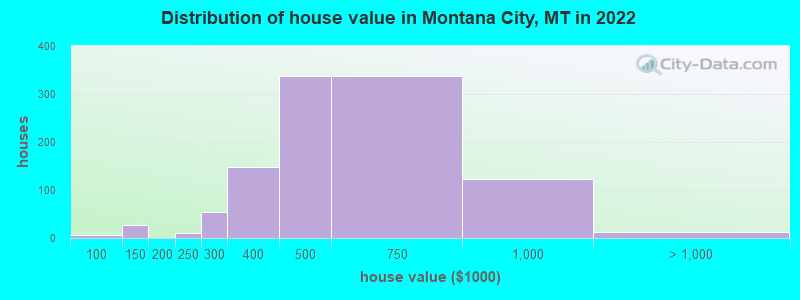
Home value of owner - occupied houses in 2022 in Montana City, MT
-
- 2$40,000 to $49,999
- 3$50,000 to $59,999
- 14$100,000 to $124,999
- 13$125,000 to $149,999
- 10$200,000 to $249,999
- 55$250,000 to $299,999
- 147$300,000 to $399,999
- 336$400,000 to $499,999
- 338$500,000 to $749,999
- 122$750,000 to $999,999
- 12$1,000,000 to $1,499,999
Rent paid by renters in 2022 in Montana City, MT
-
- 5$700 to $749
- 3$900 to $999
- 33$1,000 to $1,249
- 6$1,250 to $1,499
- 13$1,500 to $1,999
- 13$2,000 to $2,499


Percentage of workers working in this county: 15.4%
Number of people working at home: 83 (5.7% of all workers)
Travel time to work (commute)
- Less than 5 minutes: 44
- 5 to 9 minutes: 88
- 10 to 14 minutes: 360
- 15 to 19 minutes: 586
- 20 to 24 minutes: 166
- 25 to 29 minutes: 19
- 30 to 34 minutes: 64
- 35 to 39 minutes: 5
- 40 to 44 minutes: 0
- 45 to 59 minutes: 6
- 60 to 89 minutes: 0
- 90 or more minutes: 17
Means of transportation to work:
- Drove a car alone: 946 (83.5%)
- Carpooled: 129 (11.4%)
- Motorcycle: 3 (0.3%)
- Walked: 12 (1.1%)
- Other means: 4 (0.4%)
- Worked at home: 39 (3.4%)

- Unemployment by race in 2022
- Unemployment rate for White non-Hispanic residents
- 0.6%Males
- 2.9%Females

- Year of entry for the foreign-born population in Montana City, Montana
- 222010 or later
- 402000 to 2009
- 141990 to 1999
- 111980 to 1989
- 21970 to 1979
- 10Before 1970

First ancestries reported:
- German: 262 (25.6%)
- Norwegian: 163 (16.0%)
- English: 93 (9.1%)
- Irish: 83 (8.1%)
- American: 72 (7.0%)
- Czech: 37 (3.6%)
- European: 36 (3.5%)
- Dutch: 34 (3.3%)
- Hungarian: 13 (1.3%)
- Finnish: 11 (1.1%)
- Scotch-Irish: 11 (1.1%)
- Polish: 10 (1.0%)
- Scandinavian: 9 (0.9%)
- Ethiopian: 9 (0.9%)
- Scottish: 6 (0.6%)
- Italian: 5 (0.5%)
- Eastern European: 4 (0.4%)
- French: 4 (0.4%)
- Swiss: 4 (0.4%)
- Northern European: 3 (0.3%)
Most common places of birth for foreign-born residents (%):
| Montana City: | 56.6% (69) |
| Montana: | 14.2% (3,503) |
| Montana City: | 11.5% (14) |
| Montana: | 1.6% (406) |
| Montana City: | 9.8% (12) |
| Montana: | 0.6% (137) |
| Montana City: | 7.4% (9) |
| Montana: | 0.7% (162) |
| Montana City: | 4.1% (5) |
| Montana: | 0.2% (44) |
| Montana City: | 3.3% (4) |
| Montana: | 0.5% (121) |
| Montana City: | 2.5% (3) |
| Montana: | 9.3% (2,310) |
Place of birth for U.S.-born residents:
- This state: 1,343
- Other state: 1,308
- Northeast: 88
- Midwest: 468
- South: 165
- West: 583
87.2% of Montana City residents lived in the same house 1 years ago.
Out of people who lived in different houses, 11.6% lived in this county.
Out of people who lived in different counties, 88.7% lived in Montana.
| Montana City: | 87.2% |
| State average: | 86.7% |
Education attainment for males 25 years and older:
- No schooling: 0
- Nursery to 4th grade: 0
- 5th and 6th grade: 0
- 7th and 8th grade: 0
- 9th grade: 0
- 10th grade: 0
- 11th grade: 16
- 12th grade, no diploma: 19
- High school graduate (or equivalency): 238
- Less than 1 year of college: 66
- Some college more than 1 year, no degree: 138
- Associate degree: 76
- Bachelor's degree: 251
- Master's degree: 77
- Professional school degree: 39
- Doctorate degree: 17

Education attainment for females 25 years and older:
- No schooling: 7
- Nursery to 4th grade: 0
- 5th and 6th grade: 0
- 7th and 8th grade: 0
- 9th grade: 7
- 10th grade: 0
- 11th grade: 1
- 12th grade, no diploma: 5
- High school graduate (or equivalency): 158
- Less than 1 year of college: 56
- Some college more than 1 year, no degree: 165
- Associate degree: 156
- Bachelor's degree: 306
- Master's degree: 170
- Professional school degree: 30
- Doctorate degree: 26


Housing units in structures:
- One, detached: 925
- One, attached: 125
- Two: 30
- 3 or 4: 8
House/condo owner moved in on average 8 years ago
Renter moved in on average 3 years ago

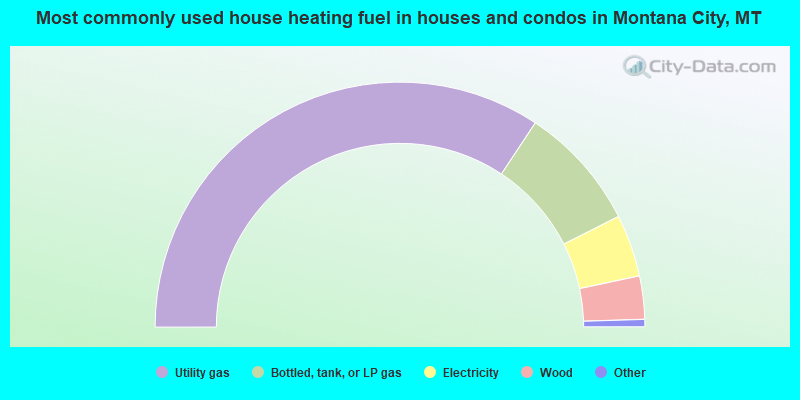
- 68.7%Utility gas
- 16.5%Bottled, tank, or LP gas
- 8.2%Electricity
- 5.7%Wood
- 0.4%Solar energy
- 0.4%Other fuel
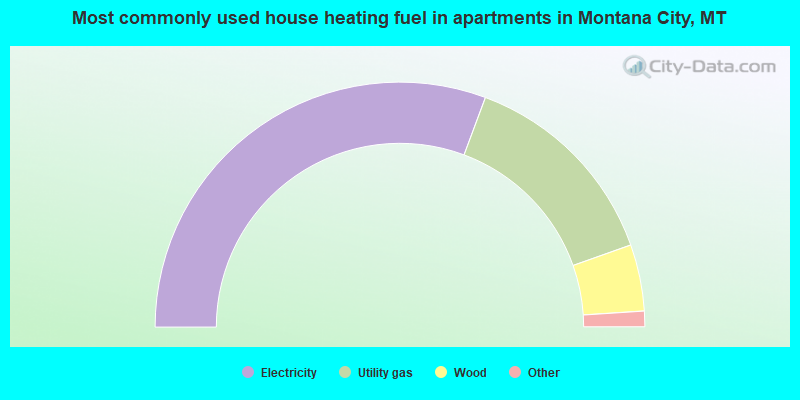
- 62.7%Electricity
- 28.4%Utility gas
- 9.0%Wood
Private vs. public school enrollment:
| Here: | 7.6% |
| Montana: | 15.3% |
| Here: | 2.5% |
| Montana: | 12.2% |
| Here: | 36.9% |
| Montana: | 15.0% |


