Monteagle, TN (Tennessee) Houses and Residents
| Monteagle: | $330,815 |
| Tennessee: | $284,800 |
Mean price in 2022:
Detached houses: $337,684
Here: $337,684 State: $374,382 Mobile homes: $75,063
Here: $75,063 State: $101,421
Total population: 1,175 (Urban population: 0, Rural population: 1,204 (all nonfarm))
Houses: 984 (711 occupied: 450 owner occupied, 273 renter occupied)
| % of renters here: | 38% |
| State: | 33% |
Housing density: 121 houses/condos per square mile
Median price asked for vacant for-sale houses and condos in 2022: $606,114.
Median contract rent in 2022: $654 (lower quartile is $533, upper quartile is $748)
Median rent asked for vacant for-rent units in 2022: $1,739
Median gross rent in Monteagle, TN in 2022: $752
Housing units in Monteagle with a mortgage: 214 (0 second mortgage, 0 home equity loan, 0 both second mortgage and home equity loan)
Houses without a mortgage: 4
Median household income for houses/condos with a mortgage: $75,268
Median household income for apartments without a mortgage: $55,114
Median monthly housing costs: $726
Compare current foreclosures near Monteagle, TN:
| Photo | Address | Area | Beds / Baths | Price | Details |
|---|---|---|---|---|---|

|
#1
Oliver Ln
Monteagle, TN 37356
|
- sq. feet
|
- baths - beds |
show details | |

|
#2
Monteagle Falls Rd
Monteagle, TN 37356
|
1,280 sq. feet
|
- baths - beds |
show details | |

|
#3
8th St
Monteagle, TN 37356
|
- sq. feet
|
- baths - beds |
show details | |

|
#4
Jackson St
Cowan, TN 37318
|
1,314 sq. feet
|
2 baths 4 beds |
show details | |

|
#5
Sweetens Cove Rd
South Pittsburg, TN 37380
|
1,650 sq. feet
|
2 baths 2 beds |
show details | |

|
#6
N West St
Decherd, TN 37324
|
2,528 sq. feet
|
2 baths 3 beds |
show details | |

|
#7
W Market St
Decherd, TN 37324
|
1,100 sq. feet
|
1 baths - beds |
show details | |

|
#8
Sequatchie Mountain Rd
Sequatchie, TN 37374
|
1,068 sq. feet
|
2 baths - beds |
show details | |

|
#9
Powell St
Decherd, TN 37324
|
1,064 sq. feet
|
2 baths - beds |
show details | |

|
#10
Woodland Dr
Decherd, TN 37324
|
1,596 sq. feet
|
2 baths - beds |
show details |
| Photo | Address | Area | Beds / Baths | Price | Details |
|---|---|---|---|---|---|

|
#11
W Broad St
Decherd, TN 37324
|
1,568 sq. feet
|
1 baths - beds |
show details | |

|
#12
Colony Rd
Gruetli Laager, TN 37339
|
1,932 sq. feet
|
1 baths - beds |
show details | |

|
#13
Esther Dr
Coalmont, TN 37313
|
1,833 sq. feet
|
2 baths - beds |
show details | |

|
#14
Vineyard Point Rd
Sequatchie, TN 37374
|
1,144 sq. feet
|
1 baths - beds |
show details | |

|
#15
Gail Ln
Jasper, TN 37347
|
900 sq. feet
|
2 baths - beds |
show details | |

|
#16
S Pittsburg Mountain Rd
South Pittsburg, TN 37380
|
1,008 sq. feet
|
1 baths - beds |
show details | |

|
#17
N 2nd St
Decherd, TN 37324
|
1,340 sq. feet
|
1 baths - beds |
show details | |

|
#18
Vernon Winton Rd
Hillsboro, TN 37342
|
1,176 sq. feet
|
2 baths - beds |
show details | |

|
#19
Pryor Cove Rd
Jasper, TN 37347
|
1,392 sq. feet
|
2 baths - beds |
show details | |

|
#20
Limbo Dr
Hillsboro, TN 37342
|
1,728 sq. feet
|
2 baths - beds |
show details |
| Photo | Address | Area | Beds / Baths | Price | Details |
|---|---|---|---|---|---|

|
#21
Highland Ave
Jasper, TN 37347
|
864 sq. feet
|
1 baths - beds |
show details | |

|
#22
Patton School Rd
South Pittsburg, TN 37380
|
1,056 sq. feet
|
2 baths - beds |
show details | |

|
#23
Brandi Way
Winchester, TN 37398
|
3,802 sq. feet
|
3 baths - beds |
show details | |

|
#24
1st Ave
Jasper, TN 37347
|
1,566 sq. feet
|
1 baths - beds |
show details | |

|
#25
Main St
Jasper, TN 37347
|
1,073 sq. feet
|
1 baths - beds |
show details | |

|
#26
S Shephard St
Winchester, TN 37398
|
1,566 sq. feet
|
1 baths - beds |
show details | |

|
#27
View St
Jasper, TN 37347
|
3,281 sq. feet
|
1 baths - beds |
show details | |

|
#28
Simmons Rd
Hillsboro, TN 37342
|
1,536 sq. feet
|
1 baths - beds |
show details | |

|
#29
Highway 108
Whitwell, TN 37397
|
2,340 sq. feet
|
1 baths - beds |
show details | |

|
#30
Rotary Dr
Winchester, TN 37398
|
1,120 sq. feet
|
2 baths - beds |
show details |
| Photo | Address | Area | Beds / Baths | Price | Details |
|---|---|---|---|---|---|

|
#31
Shasteen St
Estill Springs, TN 37330
|
1,200 sq. feet
|
1 baths - beds |
show details | |

|
#32
Highway 108
Whitwell, TN 37397
|
910 sq. feet
|
1 baths - beds |
show details | |

|
#33
Industrial Blvd
Jasper, TN 37347
|
1,304 sq. feet
|
1 baths - beds |
show details | |

|
#34
Spring St
Decherd, TN 37324
|
1,480 sq. feet
|
1 baths - beds |
show details | |

|
#35
Roys Ln
Winchester, TN 37398
|
1,300 sq. feet
|
2 baths - beds |
show details | |

|
#36
Soldier Rd
Altamont, TN 37301
|
2,052 sq. feet
|
2 baths - beds |
show details | |

|
#37
Highway 150
Sequatchie, TN 37374
|
1,344 sq. feet
|
1 baths - beds |
show details | |

|
#38
Goodman Rd
Pelham, TN 37366
|
960 sq. feet
|
1 baths - beds |
show details | |

|
#39
Deepwoods Rd
Sewanee, TN 37375
|
2,580 sq. feet
|
4 baths - beds |
show details | |

|
#40
Littell Cir E
Tracy City, TN 37387
|
2,012 sq. feet
|
2 baths - beds |
show details |
| Photo | Address | Area | Beds / Baths | Price | Details |
|---|---|---|---|---|---|

|
#41
S Pittsburg Mountain Rd
Sewanee, TN 37375
|
2,576 sq. feet
|
2 baths - beds |
show details | |

|
#42
Flat Branch Rd
Tracy City, TN 37387
|
1,375 sq. feet
|
1 baths - beds |
show details | |

|
#43
Oakley St
Hillsboro, TN 37342
|
1,200 sq. feet
|
1 baths - beds |
show details | |

|
#44
Foster Falls Rd
Sequatchie, TN 37374
|
1,176 sq. feet
|
2 baths - beds |
show details | |

|
#45
Old Alto Hwy
Decherd, TN 37324
|
960 sq. feet
|
1 baths - beds |
show details | |

|
#46
Partin Circle
Coalmont, TN 37313
|
936 sq. feet
|
1 baths - beds |
show details | |

|
#47
Mckinney St
Estill Springs, TN 37330
|
1,275 sq. feet
|
2 baths - beds |
show details | |

|
#48
Sweetens Cove Rd
South Pittsburg, TN 37380
|
1,960 sq. feet
|
1 baths - beds |
show details | |

|
#49
Swann Ln
Decherd, TN 37324
|
1,300 sq. feet
|
1 baths - beds |
show details | |

|
Check over 1 million property listings on Foreclosure.com!
|
browse all offers | |||

Latest news about housing in Monteagle, TN collected exclusively by city-data.com from local newspapers, TV, and radio stations


Median year apartment built: 1992
Household type by relationship:
Households: 1,950- Male householders: 318 (91 living alone), Female householders: 383 (89 living alone)
294 spouses (291 opposite-sex spouses), 69 unmarried partners, (66 opposite-sex unmarried partners), 556 children (507 natural, 31 adopted, 17 stepchildren), 62 grandchildren, 0 brothers or sisters, 11 parents, 0 foster children, 42 other relatives, 33 non-relatives
- In group quarters: 178
Size of family households: 265 2-persons, 106 3-persons, 125 4-persons, 1 6-persons.
Size of nonfamily households: 184 1-person, 39 2-persons.
184 married couples with children.
213 single-parent households (88 men, 125 women).
95.4% of residents of Monteagle speak English at home.
2.1% of residents speak Spanish at home (95% speak English well, 5% speak English not well).
2.2% of residents speak other Indo-European language at home (76% speak English very well, 24% speak English not well).
0.2% of residents speak other language at home (100% speak English very well).
Foreign born population: 64 (3.3%)
(26.6% of them are naturalized citizens)
| Here: | 6.6 |
| State: | 6.5 |
| Here: | 4.5 |
| State: | 4.4 |

- Bedrooms in owner-occupied houses and condos in Monteagle, Tennessee
- 0no bedroom
- 141 bedroom
- 702 bedrooms
- 2833 bedrooms
- 644 bedrooms
- 195+ bedrooms

- Bedrooms in renter-occupied apartments in Monteagle, Tennessee
- 0no bedroom
- 281 bedroom
- 1332 bedrooms
- 783 bedrooms
- 154 bedrooms
- 205+ bedrooms

- Cars and other vehicles available in Monteagle in owner-occupied houses/condos
- 31no vehicle
- 621 vehicle
- 1902 vehicles
- 673 vehicles
- 604 vehicles
- 405+ vehicles

- Cars and other vehicles available in Monteagle in renter-occupied apartments
- 28no vehicle
- 1341 vehicle
- 852 vehicles
- 23 vehicles
- 44 vehicles
- 205+ vehicles

- Rooms in owner-occupied houses in Monteagle, Tennessee
- 01 room
- 02 rooms
- 03 rooms
- 694 rooms
- 845 rooms
- 676 rooms
- 747 rooms
- 908 rooms
- 659+ rooms

- Rooms in renter-occupied apartments in Monteagle, Tennessee
- 01 room
- 142 rooms
- 303 rooms
- 844 rooms
- 765 rooms
- 306 rooms
- 97 rooms
- 108 rooms
- 209+ rooms


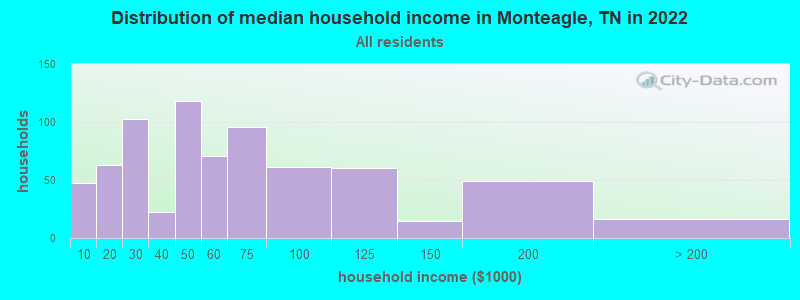
Monteagle, TN household income distribution

- 47Less than $10,000
- 63$10,000 to $19,999
- 103$20,000 to $29,999
- 22$30,000 to $39,999
- 118$40,000 to $49,999
- 71$50,000 to $59,999
- 96$60,000 to $74,999
- 61$75,000 to $99,999
- 60$100,000 to $124,999
- 15$125,000 to $149,999
- 49$150,000 to $199,999
- 16$200,000 or more
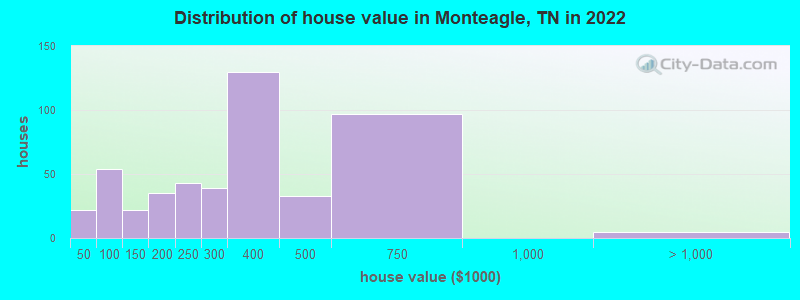
Home value of owner - occupied houses in 2022 in Monteagle, TN
-
- 1$30,000 to $34,999
- 4$35,000 to $39,999
- 16$40,000 to $49,999
- 8$50,000 to $59,999
- 10$60,000 to $69,999
- 14$80,000 to $89,999
- 2$90,000 to $99,999
- 5$100,000 to $124,999
- 17$125,000 to $149,999
- 22$150,000 to $174,999
- 12$175,000 to $199,999
- 43$200,000 to $249,999
- 39$250,000 to $299,999
- 129$300,000 to $399,999
- 33$400,000 to $499,999
- 96$500,000 to $749,999
- 4$1,500,000 to $1,999,999
Rent paid by renters in 2022 in Monteagle, TN
-
- 5Less than $100
- 4$150 to $199
- 3$350 to $399
- 22$400 to $449
- 17$450 to $499
- 28$500 to $549
- 21$550 to $599
- 22$600 to $649
- 45$650 to $699
- 32$700 to $749
- 4$800 to $899
- 16$1,000 to $1,249
- 4$1,250 to $1,499
- 14No cash rent


Percentage of workers working in this county: 46.3%
Number of people working at home: 56 (9.8% of all workers)
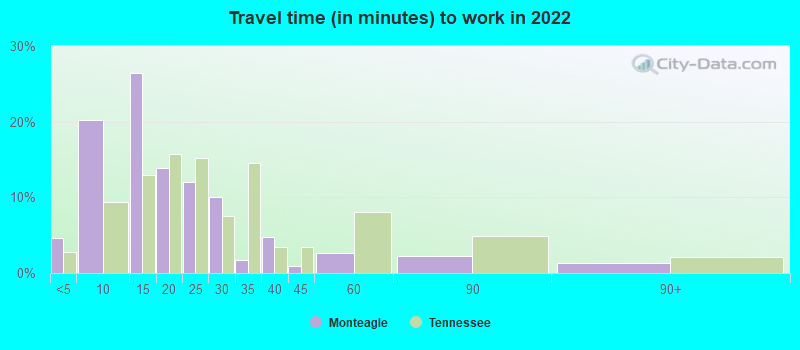
Travel time to work (commute)
- Less than 5 minutes: 42
- 5 to 9 minutes: 166
- 10 to 14 minutes: 68
- 15 to 19 minutes: 28
- 20 to 24 minutes: 36
- 25 to 29 minutes: 59
- 30 to 34 minutes: 55
- 35 to 39 minutes: 20
- 40 to 44 minutes: 0
- 45 to 59 minutes: 27
- 60 to 89 minutes: 3
- 90 or more minutes: 10
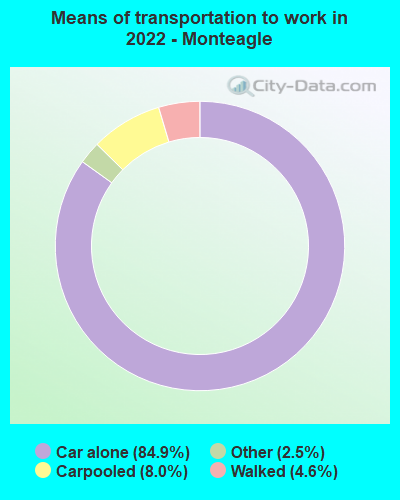
Means of transportation to work:
- Drove a car alone: 1,018 (78.4%)
- Carpooled: 101 (7.8%)
- Taxi: 37 (2.8%)
- Walked: 56 (4.3%)
- Worked at home: 56 (4.3%)

- Unemployment by race in 2022
- Unemployment rate for White non-Hispanic residents
- 10.3%Males
- 10.5%Females

- Year of entry for the foreign-born population in Monteagle, Tennessee
- 02010 or later
- 572000 to 2009
- 01990 to 1999
- 01980 to 1989
- 31970 to 1979
- 4Before 1970

First ancestries reported:
- English: 194 (25.1%)
- American: 172 (22.3%)
- Irish: 107 (13.9%)
- German: 63 (8.2%)
- Italian: 54 (7.0%)
- Scotch-Irish: 24 (3.1%)
- Scottish: 11 (1.4%)
- Northern European: 9 (1.2%)
- European: 7 (0.9%)
- Eastern European: 4 (0.5%)
- French Canadian: 2 (0.3%)
- Polish: 2 (0.3%)
- Ukrainian: 2 (0.3%)
Most common places of birth for foreign-born residents (%):
| Monteagle: | 48.4% (31) |
| Tennessee: | 6.1% (23,079) |
| Monteagle: | 32.8% (21) |
| Tennessee: | 23.0% (86,435) |
| Monteagle: | 7.8% (5) |
| Tennessee: | 5.7% (21,286) |
Place of birth for U.S.-born residents:
- This state: 1,252
- Other state: 626
- Northeast: 120
- Midwest: 169
- South: 306
- West: 27
90.1% of Monteagle residents lived in the same house 1 years ago.
Out of people who lived in different houses, 21.7% lived in this county.
Out of people who lived in different counties, 59.5% lived in Tennessee.
| Monteagle: | 90.1% |
| State average: | 87.0% |
Education attainment for males 25 years and older:
- No schooling: 0
- Nursery to 4th grade: 0
- 5th and 6th grade: 31
- 7th and 8th grade: 25
- 9th grade: 20
- 10th grade: 12
- 11th grade: 3
- 12th grade, no diploma: 8
- High school graduate (or equivalency): 189
- Less than 1 year of college: 43
- Some college more than 1 year, no degree: 66
- Associate degree: 85
- Bachelor's degree: 86
- Master's degree: 65
- Professional school degree: 14
- Doctorate degree: 45

Education attainment for females 25 years and older:
- No schooling: 0
- Nursery to 4th grade: 11
- 5th and 6th grade: 0
- 7th and 8th grade: 40
- 9th grade: 10
- 10th grade: 19
- 11th grade: 9
- 12th grade, no diploma: 30
- High school graduate (or equivalency): 156
- Less than 1 year of college: 60
- Some college more than 1 year, no degree: 85
- Associate degree: 59
- Bachelor's degree: 60
- Master's degree: 133
- Professional school degree: 2
- Doctorate degree: 23


Housing units in structures:
- One, detached: 715
- One, attached: 3
- Two: 5
- 3 or 4: 29
- 5 to 9: 150
- 10 to 19: 6
- 50 or more: 3
- Mobile homes: 71
Housing units lacking complete kitchen facilities in 2022: 0.3%
House/condo owner moved in on average 13 years ago
Renter moved in on average 5 years ago

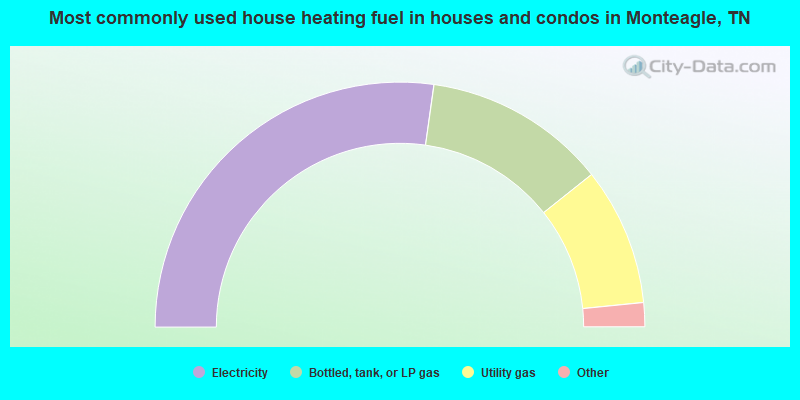
- 54.5%Electricity
- 24.2%Bottled, tank, or LP gas
- 18.2%Utility gas
- 1.9%Other fuel
- 1.2%Wood
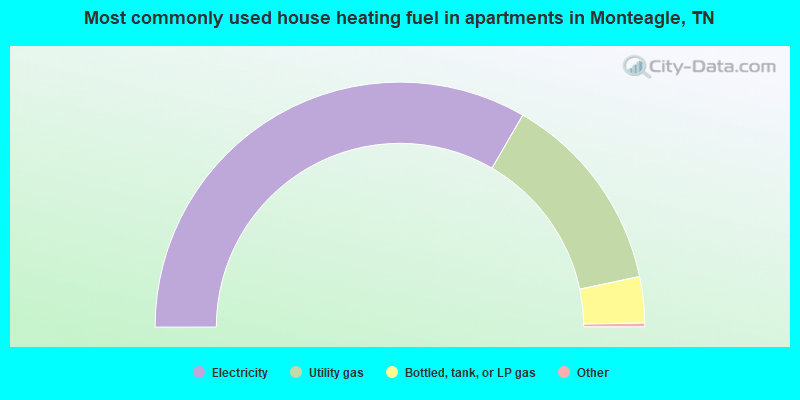
- 67.0%Electricity
- 26.8%Utility gas
- 6.1%Bottled, tank, or LP gas
Private vs. public school enrollment:
| Here: | 2.4% |
| Tennessee: | 15.0% |
| Here: | 41.8% |
| Tennessee: | 16.2% |
| Here: | 25.0% |
| Tennessee: | 23.5% |


