Monterey, CA (California) Houses and Residents
| Monterey: | $995,737 |
| California: | $715,900 |
Mean price in 2022:
Detached houses: $1,352,655
Here: $1,352,655 State: $988,808 Townhouses or other attached units: $664,388
Here: $664,388 State: $838,546 In 2-unit structures: $702,483
Here: $702,483 State: $1,138,100 In 3-to-4-unit structures: $1,097,217
Here: $1,097,217 State: $824,253 In 5-or-more-unit structures: $378,007
Here: $378,007 State: $730,996
Total population: 28,276 (All urban)
Houses: 14,132 (12,716 occupied: 4,530 owner occupied, 8,193 renter occupied)
| % of renters here: | 64% |
| State: | 44% |
Housing density: 1,675 houses/condos per square mile
Median price asked for vacant for-sale houses and condos in 2022 in this county: $440,221.
Median contract rent in 2022: over $2,000 (lower quartile is $1,687, upper quartile is over $2,000)
Median rent asked for vacant for-rent units in 2022: $3,316
Median gross rent in Monterey, CA in 2022: over $2,000
Housing units in Monterey with a mortgage: 2,739 (372 second mortgage, 11 home equity loan, 337 both second mortgage and home equity loan)
Houses without a mortgage: 25
Median household income for houses/condos with a mortgage: $148,465
Median household income for apartments without a mortgage: $79,829
Median monthly housing costs: $2,133
Compare current foreclosures in Monterey, CA:
| Photo | Address | Area | Beds / Baths | Price | Details |
|---|---|---|---|---|---|

|
#1
Belavida Rd
Monterey, CA 93940
|
5,790 sq. feet
|
5 baths 5 beds |
show details | |

|
#2
Seeno St
Monterey, CA 93940
|
2,517 sq. feet
|
4 baths 4 beds |
show details | |

|
#3
Logan Ln
Monterey, CA 93940
|
1,439 sq. feet
|
2 baths 3 beds |
show details | |

|
#4
Laguna Grande Ct
Monterey, CA 93940
|
1,286 sq. feet
|
2 baths 3 beds |
show details | |

|
#5
Castro Rd
Monterey, CA 93940
|
2,604 sq. feet
|
2 baths 1 beds |
show details | |

|
#6
Beach Way
Monterey, CA 93940
|
2,080 sq. feet
|
3 baths 3 beds |
show details | |

|
#7
Via Verde
Monterey, CA 93940
|
1,302 sq. feet
|
1 baths 3 beds |
show details | |

|
#8
Lily St
Monterey, CA 93940
|
1,386 sq. feet
|
1 baths 2 beds |
show details | |

|
#9
1st St
Monterey, CA 93940
|
1,016 sq. feet
|
3 baths 3 beds |
show details | |

|
#10
Casanova Ave
Monterey, CA 93940
|
- sq. feet
|
1 baths 2 beds |
show details |
| Photo | Address | Area | Beds / Baths | Price | Details |
|---|---|---|---|---|---|

|
#11
Pheasant Ridge Rd
Monterey, CA 93940
|
- sq. feet
|
2 baths 2 beds |
show details | |

|
#12
Rosita Rd
Monterey, CA 93940
|
- sq. feet
|
1 baths 3 beds |
show details | |

|
#13
Madison St
Monterey, CA 93940
|
- sq. feet
|
- baths - beds |
show details | |

|
#14
Casanova Ave Apt 13
Monterey, CA 93940
|
- sq. feet
|
- baths - beds |
show details | |

|
#15
Monroe St
Monterey, CA 93940
|
- sq. feet
|
- baths - beds |
show details | |

|
#16
Josselyn Canyon Rd Apt B1
Monterey, CA 93940
|
- sq. feet
|
- baths - beds |
show details | |

|
#17
Montecito Ave Apt P
Monterey, CA 93940
|
- sq. feet
|
- baths - beds |
show details | |

|
#18
Washington St, Ste B Pmb 311
Monterey, CA 93940
|
- sq. feet
|
- baths - beds |
show details | |

|
#19
Dela Vina Ave Apt 103
Monterey, CA 93940
|
- sq. feet
|
- baths - beds |
show details | |

|
#20
Johnson St
Monterey, CA 93940
|
- sq. feet
|
- baths - beds |
show details |
| Photo | Address | Area | Beds / Baths | Price | Details |
|---|---|---|---|---|---|

|
#21
Skyline Dr
Monterey, CA 93940
|
- sq. feet
|
- baths - beds |
show details | |

|
#22
Glenwood Cir
Monterey, CA 93940
|
6,790 sq. feet
|
- baths - beds |
show details | |

|
#23
Portola Dr
Monterey, CA 93940
|
- sq. feet
|
- baths - beds |
show details | |

|
#24
Archer St
Monterey, CA 93940
|
- sq. feet
|
- baths - beds |
show details | |

|
#25
Camino Aguajito Apt 301
Monterey, CA 93940
|
- sq. feet
|
- baths - beds |
show details | |

|
#26
Withers Ave Apt 12
Monterey, CA 93940
|
- sq. feet
|
- baths - beds |
show details | |

|
#27
Hawthorne St Apt 6
Monterey, CA 93940
|
- sq. feet
|
- baths - beds |
show details | |

|
#28
Ricketts Rd Apt A
Monterey, CA 93940
|
- sq. feet
|
- baths - beds |
show details | |

|
#29
Yerba Buena Ct
Monterey, CA 93940
|
- sq. feet
|
- baths - beds |
show details | |

|
#30
Tanglewood
Monterey, CA 93940
|
- sq. feet
|
- baths - beds |
show details |
| Photo | Address | Area | Beds / Baths | Price | Details |
|---|---|---|---|---|---|

|
Check over 1 million property listings on Foreclosure.com!
|
browse all offers | |||
| Photo | Address | Area | Beds / Baths | Price | Details |
|---|

Latest news about housing in Monterey, CA collected exclusively by city-data.com from local newspapers, TV, and radio stations

 | Affordable housing near Monterey, CA (3 replies) |
| Renting apartment in Monterey county (1 reply) |
| Rental Crisis in Monterey - Need input please (28 replies) |
| Seaside towns with housing for $1.5M or less? (10 replies) |
| The Presidio of Monterey (job/housing advice). (5 replies) |
| Seeking advice on moving to Monterey (apartments) (10 replies) |

Median year apartment built: 1974
Household type by relationship:
Households: 29,681- Male householders: 5,879 (2,009 living alone), Female householders: 6,569 (2,690 living alone)
5,035 spouses (4,904 opposite-sex spouses), 906 unmarried partners, (889 opposite-sex unmarried partners), 4,844 children (4,559 natural, 218 adopted, 66 stepchildren), 368 grandchildren, 307 brothers or sisters, 350 parents, 33 foster children, 445 other relatives, 1,793 non-relatives
- In group quarters: 3,146
Size of family households: 3,504 2-persons, 1,123 3-persons, 958 4-persons, 429 5-persons, 159 6-persons, 55 7-or-more-persons.
Size of nonfamily households: 4,716 1-person, 1,643 2-persons, 181 3-persons, 45 4-persons, 21 5-persons.
2,970 married couples with children.
515 single-parent households (273 men, 242 women).
73.6% of residents of Monterey speak English at home.
12.7% of residents speak Spanish at home (66% speak English very well, 14% speak English well, 15% speak English not well, 6% don't speak English at all).
6.4% of residents speak other Indo-European language at home (64% speak English very well, 17% speak English well, 15% speak English not well, 4% don't speak English at all).
3.9% of residents speak Asian or Pacific Island language at home (66% speak English very well, 11% speak English well, 23% speak English not well).
1.6% of residents speak other language at home (66% speak English very well, 34% speak English well, 1% speak English not well).
Foreign born population: 4,945 (16.7%)
(46.6% of them are naturalized citizens)
| Here: | 5.8 |
| State: | 6.0 |
| Here: | 3.7 |
| State: | 3.9 |

- Bedrooms in owner-occupied houses and condos in Monterey, California
- 18no bedroom
- 1871 bedroom
- 1,1952 bedrooms
- 2,1673 bedrooms
- 8294 bedrooms
- 1345+ bedrooms

- Bedrooms in renter-occupied apartments in Monterey, California
- 994no bedroom
- 2,3621 bedroom
- 3,1262 bedrooms
- 1,3533 bedrooms
- 2504 bedrooms
- 1105+ bedrooms

- Cars and other vehicles available in Monterey in owner-occupied houses/condos
- 152no vehicle
- 1,5391 vehicle
- 2,0362 vehicles
- 5093 vehicles
- 2224 vehicles
- 735+ vehicles

- Cars and other vehicles available in Monterey in renter-occupied apartments
- 715no vehicle
- 3,7761 vehicle
- 2,8432 vehicles
- 7163 vehicles
- 1294 vehicles
- 155+ vehicles

- Rooms in owner-occupied houses in Monterey, California
- 181 room
- 442 rooms
- 2493 rooms
- 5824 rooms
- 8735 rooms
- 1,1456 rooms
- 7077 rooms
- 4238 rooms
- 4889+ rooms

- Rooms in renter-occupied apartments in Monterey, California
- 8701 room
- 8552 rooms
- 2,0383 rooms
- 1,8874 rooms
- 9815 rooms
- 8056 rooms
- 4227 rooms
- 1628 rooms
- 1749+ rooms


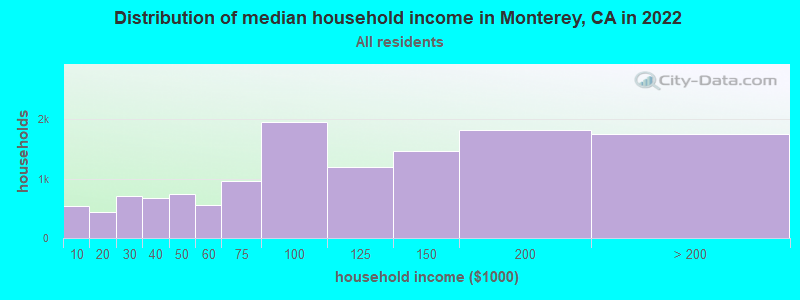
Monterey, CA household income distribution

- 541Less than $10,000
- 442$10,000 to $19,999
- 709$20,000 to $29,999
- 671$30,000 to $39,999
- 741$40,000 to $49,999
- 563$50,000 to $59,999
- 955$60,000 to $74,999
- 1,955$75,000 to $99,999
- 1,193$100,000 to $124,999
- 1,465$125,000 to $149,999
- 1,817$150,000 to $199,999
- 1,754$200,000 or more
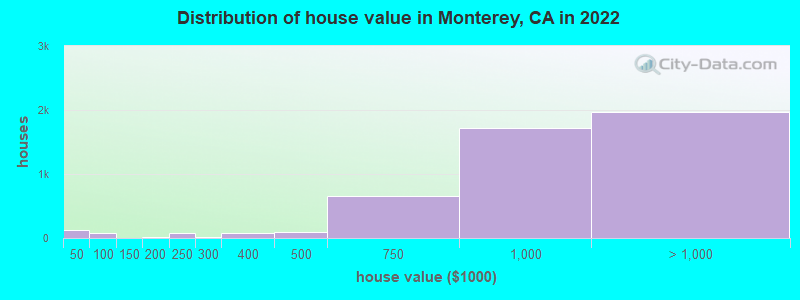
Home value of owner - occupied houses in 2022 in Monterey, CA
-
- 57Less than $10,000
- 15$10,000 to $14,999
- 36$15,000 to $19,999
- 16$40,000 to $49,999
- 64$70,000 to $79,999
- 3$150,000 to $174,999
- 5$175,000 to $199,999
- 83$200,000 to $249,999
- 18$250,000 to $299,999
- 82$300,000 to $399,999
- 94$400,000 to $499,999
- 649$500,000 to $749,999
- 1,711$750,000 to $999,999
- 1,198$1,000,000 to $1,499,999
- 456$1,500,000 to $1,999,999
- 315$2,000,000 or more
Rent paid by renters in 2022 in Monterey, CA
-
- 33$250 to $299
- 33$300 to $349
- 13$400 to $449
- 19$500 to $549
- 11$550 to $599
- 62$600 to $649
- 29$800 to $899
- 26$900 to $999
- 381$1,000 to $1,249
- 563$1,250 to $1,499
- 2,866$1,500 to $1,999
- 1,953$2,000 to $2,499
- 642$2,500 to $2,999
- 477$3,000 to $3,499
- 1,165$3,500 or more
- 153No cash rent


Percentage of workers working in this county: 94.7%
Number of people working at home: 5,012 (29.6% of all workers)
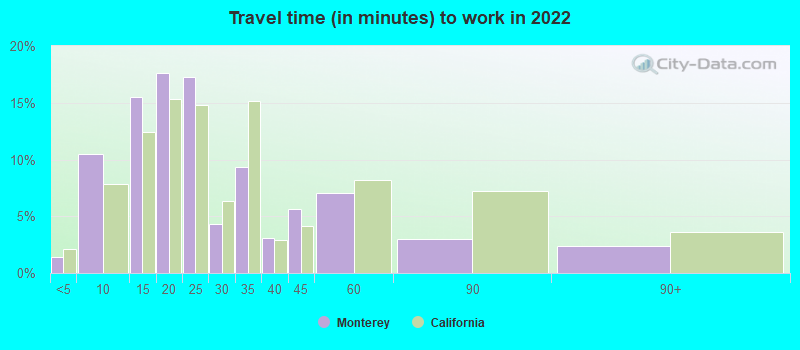
Travel time to work (commute)
- Less than 5 minutes: 277
- 5 to 9 minutes: 2,441
- 10 to 14 minutes: 2,731
- 15 to 19 minutes: 2,269
- 20 to 24 minutes: 1,535
- 25 to 29 minutes: 333
- 30 to 34 minutes: 690
- 35 to 39 minutes: 543
- 40 to 44 minutes: 478
- 45 to 59 minutes: 322
- 60 to 89 minutes: 235
- 90 or more minutes: 319
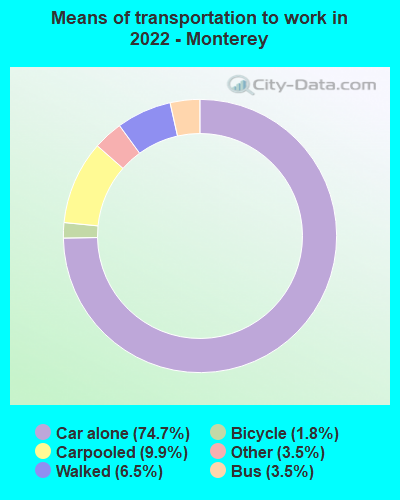
Means of transportation to work:
- Drove a car alone: 20,107 (64.1%)
- Carpooled: 2,411 (7.7%)
- Bus: 1,668 (5.3%)
- Taxi: 727 (2.3%)
- Bicycle: 680 (2.2%)
- Walked: 2,157 (6.9%)
- Worked at home: 5,012 (16.0%)

- Unemployment by race in 2022
- Unemployment rate for White non-Hispanic residents
- 4.8%Males
- 3.3%Females
- Unemployment rate for Asian residents
- 1.0%Males
- 3.6%Females
- Unemployment rate for other race residents
- 7.1%Males
- Unemployment rate for two or more race residents
- 9.8%Males
- 4.7%Females
- Unemployment rate for Hispanic or Latino residents
- 8.2%Males
- 2.0%Females

- Year of entry for the foreign-born population in Monterey, California
- 1,9492010 or later
- 1,0452000 to 2009
- 8321990 to 1999
- 1,3581980 to 1989
- 6231970 to 1979
- 1,292Before 1970

First ancestries reported:
- Italian: 1,442 (9.8%)
- English: 1,272 (8.6%)
- Irish: 1,109 (7.5%)
- German: 999 (6.8%)
- American: 667 (4.5%)
- European: 586 (4.0%)
- Polish: 320 (2.2%)
- Russian: 183 (1.2%)
- Swedish: 164 (1.1%)
- Romanian: 151 (1.0%)
- Scottish: 131 (0.9%)
- French: 130 (0.9%)
- Syrian: 121 (0.8%)
- Portuguese: 121 (0.8%)
- Armenian: 113 (0.8%)
- Ukrainian: 111 (0.8%)
- Afghan: 100 (0.7%)
- Lebanese: 90 (0.6%)
- Norwegian: 87 (0.6%)
- Greek: 74 (0.5%)
- Eastern European: 74 (0.5%)
- Egyptian: 72 (0.5%)
- Scotch-Irish: 72 (0.5%)
- Arab: 71 (0.5%)
- Iranian: 70 (0.5%)
- South African: 51 (0.3%)
- Dutch: 46 (0.3%)
- Serbian: 35 (0.2%)
- French Canadian: 33 (0.2%)
- Scandinavian: 32 (0.2%)
- African: 32 (0.2%)
- Czech: 31 (0.2%)
- British: 25 (0.2%)
- Canadian: 22 (0.1%)
- Yugoslavian: 22 (0.1%)
- Hungarian: 20 (0.1%)
- Trinidadian and Tobagonian: 17 (0.1%)
- Welsh: 16 (0.1%)
- Brazilian: 14 (0.09%)
- Haitian: 13 (0.09%)
- Slovene: 10 (0.07%)
- Latvian: 9 (0.06%)
- Northern European: 9 (0.06%)
- Iraqi: 8 (0.05%)
- Basque: 6 (0.04%)
- Danish: 6 (0.04%)
- Lithuanian: 3 (0.02%)
Most common places of birth for foreign-born residents (%):
| Monterey: | 22.0% (1,069) |
| California: | 37.2% (3,881,193) |
| Monterey: | 9.3% (451) |
| California: | 5.2% (539,184) |
| Monterey: | 6.2% (301) |
| California: | 3.0% (315,248) |
| Monterey: | 5.4% (261) |
| California: | 6.6% (684,672) |
| Monterey: | 4.8% (233) |
| California: | 0.6% (57,953) |
| Monterey: | 3.7% (181) |
| California: | 4.2% (440,287) |
| Monterey: | 3.1% (150) |
| California: | 0.2% (23,058) |
| Monterey: | 3.0% (144) |
| California: | 0.3% (30,949) |
| Monterey: | 2.9% (141) |
| California: | 1.0% (103,575) |
| Monterey: | 2.7% (130) |
| California: | 7.8% (818,297) |
| Monterey: | 2.5% (123) |
| California: | 0.5% (53,260) |
| Monterey: | 2.1% (102) |
| California: | 0.7% (71,932) |
| Monterey: | 2.0% (99) |
| California: | 0.7% (73,304) |
| Monterey: | 1.7% (83) |
| California: | 0.6% (60,761) |
Place of birth for U.S.-born residents:
- This state: 13,212
- Other state: 10,746
- Northeast: 2,114
- Midwest: 2,292
- South: 3,988
- West: 2,399
74.5% of Monterey residents lived in the same house 1 years ago.
Out of people who lived in different houses, 23.8% lived in this county.
Out of people who lived in different counties, 37.8% lived in California.
| Monterey: | 74.5% |
| State average: | 88.9% |
Education attainment for males 25 years and older:
- No schooling: 140
- Nursery to 4th grade: 20
- 5th and 6th grade: 105
- 7th and 8th grade: 59
- 9th grade: 73
- 10th grade: 16
- 11th grade: 22
- 12th grade, no diploma: 297
- High school graduate (or equivalency): 1,427
- Less than 1 year of college: 547
- Some college more than 1 year, no degree: 1,166
- Associate degree: 877
- Bachelor's degree: 3,439
- Master's degree: 1,957
- Professional school degree: 185
- Doctorate degree: 574

Education attainment for females 25 years and older:
- No schooling: 144
- Nursery to 4th grade: 31
- 5th and 6th grade: 116
- 7th and 8th grade: 34
- 9th grade: 221
- 10th grade: 10
- 11th grade: 5
- 12th grade, no diploma: 105
- High school graduate (or equivalency): 1,288
- Less than 1 year of college: 643
- Some college more than 1 year, no degree: 1,339
- Associate degree: 1,095
- Bachelor's degree: 3,286
- Master's degree: 1,892
- Professional school degree: 314
- Doctorate degree: 286


Housing units in structures:
- One, detached: 6,121
- One, attached: 1,039
- Two: 839
- 3 or 4: 1,920
- 5 to 9: 1,103
- 10 to 19: 1,003
- 20 to 49: 1,140
- 50 or more: 963
Housing units lacking complete kitchen facilities in 2022: 1.8%
House/condo owner moved in on average 14 years ago
Renter moved in on average 1 years ago

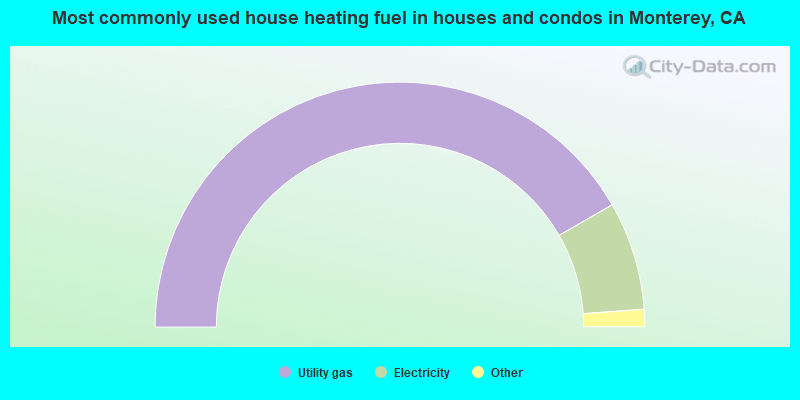
- 83.4%Utility gas
- 14.3%Electricity
- 0.9%No fuel used
- 0.8%Bottled, tank, or LP gas
- 0.3%Wood
- 0.3%Solar energy
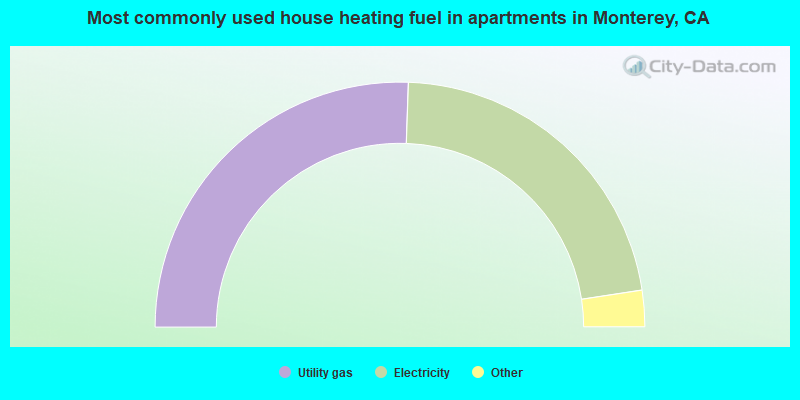
- 51.1%Utility gas
- 44.1%Electricity
- 2.8%No fuel used
- 1.0%Bottled, tank, or LP gas
- 0.4%Other fuel
- 0.4%Wood
- 0.3%Fuel oil, kerosene, etc.
Private vs. public school enrollment:
| Here: | 23.4% |
| California: | 10.5% |
| Here: | 24.4% |
| California: | 8.5% |
| Here: | 24.4% |
| California: | 15.9% |


