Housing density: 2,881 houses/condos per square mile
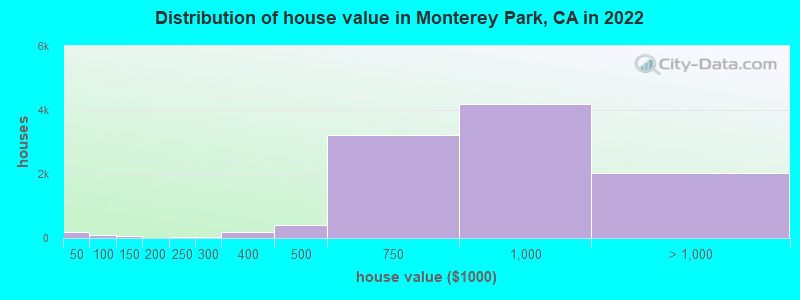
Median price asked for vacant for-sale houses and condos in 2022: $786,527.
Median contract rent in 2022: $1,689 (lower quartile is $1,264, upper quartile is over $2,000)
Median rent asked for vacant for-rent units in 2022: $2,068
Median gross rent in Monterey Park, CA in 2022: $1,791
Housing units in Monterey Park with a mortgage: 5,189 (478 second mortgage, 28 home equity loan, 416 both second mortgage and home equity loan) Houses without a mortgage: 45
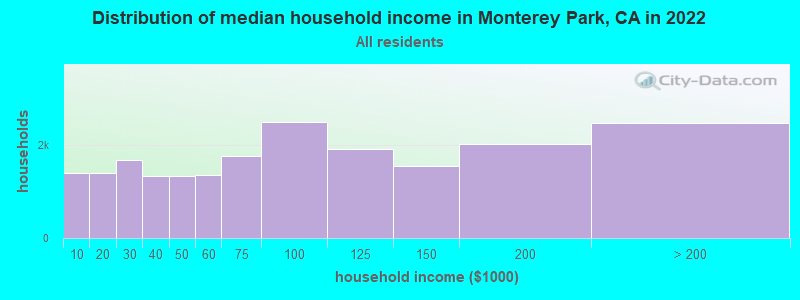
Median household income for houses/condos with a mortgage: $126,572
Median household income for apartments without a mortgage: $83,043
Median monthly housing costs: $1,670
Compare current foreclosures near Monterey Park, CA:
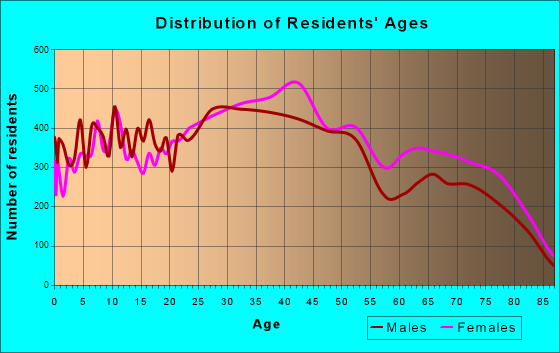
6,280 married couples with children.
2,272 single-parent households (550 men, 1,722 women).
27.7% of residents of Monterey Park speak English at home.
17.2% of residents speak Spanish at home (78% speak English very well, 15% speak English well, 6% speak English not well, 1% don't speak English at all).
1.5% of residents speak other Indo-European language at home (87% speak English very well, 9% speak English well, 4% speak English not well).
52.8% of residents speak Asian or Pacific Island language at home (33% speak English very well, 23% speak English well, 28% speak English not well, 16% don't speak English at all).
0.7% of residents speak other language at home (96% speak English very well, 4% speak English not well).
Foreign born population: 30,268 (51.2%)
(64.3% of them are naturalized citizens)
Percentage of workers working in this county: 95.7% Number of people working at home: 4,795 (17.3% of all workers)
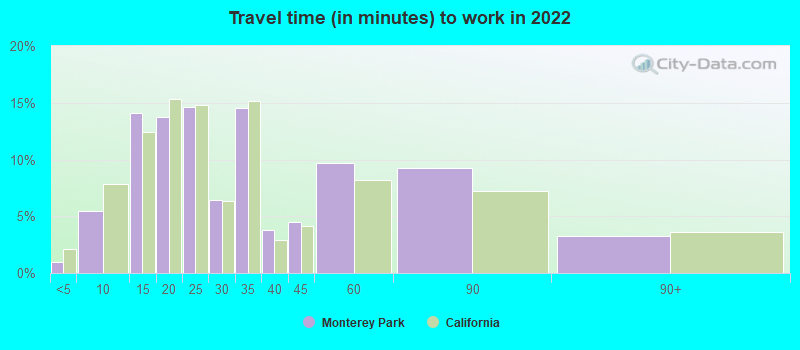
Travel time to work (commute)
Less than 5 minutes: 262
5 to 9 minutes: 1,155
10 to 14 minutes: 2,825
15 to 19 minutes: 3,758
20 to 24 minutes: 3,230
25 to 29 minutes: 1,252
30 to 34 minutes: 4,248
35 to 39 minutes: 692
40 to 44 minutes: 1,189
45 to 59 minutes: 2,398
60 to 89 minutes: 1,652
90 or more minutes: 406
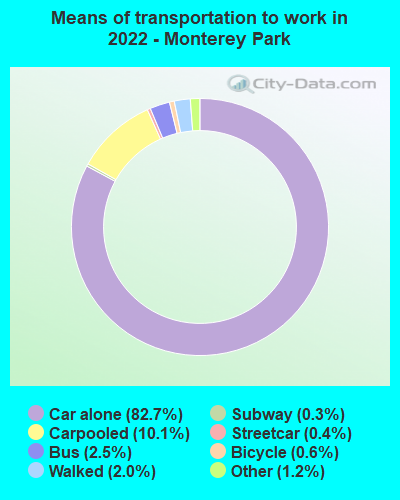
Means of transportation to work:
Drove a car alone: 16,702 (66.8%)
Carpooled: 2,261 (9.0%)
Bus: 456 (1.8%)
Subway or elevated rail: 67 (0.3%)
Long-distance train or commuter rail: 42 (0.2%)
Ferryboat: 9 (0.0%)
Taxi: 276 (1.1%)
Bicycle: 116 (0.5%)
Walked: 444 (1.8%)
Worked at home: 4,795 (19.2%)
Unemployment by race in 2022
Unemployment rate for White non-Hispanic residents
9.5%Males
9.6%Females
Unemployment rate for Black residents
22.7%Females
Unemployment rate for American Indian and Alaska Native residents
6.6%Males
Unemployment rate for Asian residents
4.9%Males
4.3%Females
Unemployment rate for other race residents
2.1%Males
4.3%Females
Unemployment rate for two or more race residents
10.2%Males
1.0%Females
Unemployment rate for Hispanic or Latino residents
3.3%Males
2.4%Females
Year of entry for the foreign-born population in Monterey Park, California
9,6452010 or later
4,6542000 to 2009
4,9321990 to 1999
10,8341980 to 1989
6,0911970 to 1979
4,271Before 1970
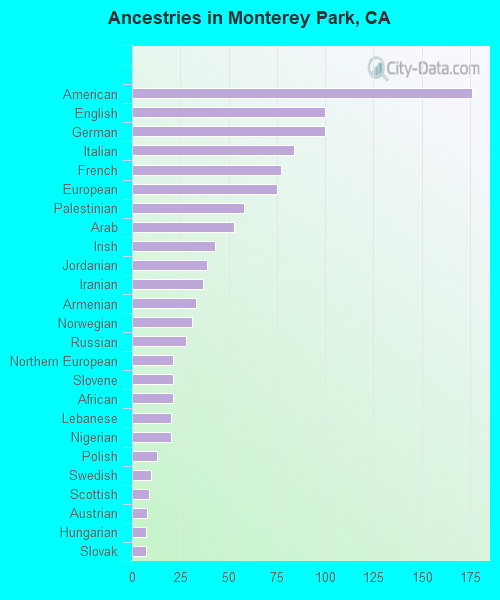
First ancestries reported:
American: 176 (0.4%)
English: 100 (0.2%)
German: 100 (0.2%)
Italian: 84 (0.2%)
French: 77 (0.2%)
European: 75 (0.2%)
Palestinian: 58 (0.1%)
Arab: 53 (0.1%)
Irish: 43 (0.1%)
Jordanian: 39 (0.09%)
Iranian: 37 (0.09%)
Armenian: 33 (0.08%)
Norwegian: 31 (0.07%)
Russian: 28 (0.07%)
Northern European: 21 (0.05%)
Slovene: 21 (0.05%)
African: 21 (0.05%)
Lebanese: 20 (0.05%)
Nigerian: 20 (0.05%)
Polish: 13 (0.03%)
Swedish: 10 (0.02%)
Scottish: 9 (0.02%)
Austrian: 8 (0.02%)
Hungarian: 7 (0.02%)
Slovak: 7 (0.02%)
Egyptian: 6 (0.01%)
Belgian: 5 (0.01%)
Eastern European: 5 (0.01%)
Most common places of birth for foreign-born residents (%):
China, excluding Hong Kong and Taiwan
Monterey Park:
45.5% (13,777)
California:
6.6% (684,672)
Vietnam
Monterey Park:
13.7% (4,150)
California:
4.9% (512,335)
Hong Kong
Monterey Park:
8.1% (2,451)
California:
1.0% (105,215)
Mexico
Monterey Park:
7.3% (2,223)
California:
37.2% (3,881,193)
Taiwan
Monterey Park:
5.4% (1,642)
California:
1.7% (176,274)
Philippines
Monterey Park:
3.1% (925)
California:
7.8% (818,297)
Cambodia
Monterey Park:
2.0% (604)
California:
0.5% (51,974)
Korea
Monterey Park:
1.9% (571)
California:
3.0% (315,248)
Burma (Myanmar)
Monterey Park:
1.8% (559)
California:
0.3% (28,176)
Japan
Monterey Park:
1.7% (523)
California:
1.0% (103,575)
Place of birth for U.S.-born residents:
This state: 24,993
Other state: 3,037
Northeast: 508
Midwest: 615
South: 941
West: 926
91.1% of Monterey Park residents lived in the same house 1 years ago. Out of people who lived in different houses, 44.1% lived in this county. Out of people who lived in different counties, 72.8% lived in California.
Monterey Park:
91.1%
State average:
88.9%
Education attainment for males 25 years and older:
No schooling: 1,876
Nursery to 4th grade: 171
5th and 6th grade: 515
7th and 8th grade: 229
9th grade: 466
10th grade: 117
11th grade: 132
12th grade, no diploma: 851
High school graduate (or equivalency): 5,346
Less than 1 year of college: 852
Some college more than 1 year, no degree: 2,096
Associate degree: 1,454
Bachelor's degree: 5,259
Master's degree: 1,674
Professional school degree: 414
Doctorate degree: 277
Education attainment for females 25 years and older:
No schooling: 2,423
Nursery to 4th grade: 266
5th and 6th grade: 857
7th and 8th grade: 305
9th grade: 386
10th grade: 171
11th grade: 107
12th grade, no diploma: 667
High school graduate (or equivalency): 5,839
Less than 1 year of college: 745
Some college more than 1 year, no degree: 2,345
Associate degree: 1,712
Bachelor's degree: 5,608
Master's degree: 1,743
Professional school degree: 407
Doctorate degree: 138
Housing units in structures:
One, detached: 12,552
One, attached: 2,251
Two: 627
3 or 4: 1,358
5 to 9: 1,437
10 to 19: 1,181
20 to 49: 1,208
50 or more: 1,333
Mobile homes: 36
Housing units lacking complete plumbing facilities in 2022: 0.2%
Housing units lacking complete kitchen facilities in 2022: 3.5%
House/condo owner moved in on average 20 years ago