Montesano, WA (Washington) Houses and Residents
| Montesano: | $371,570 |
| Washington: | $569,500 |
Mean price in 2022:
Detached houses: $336,398
Here: $336,398 State: $734,307 Mobile homes: $80,917
Here: $80,917 State: $218,362
Total population: 3,861 (Urban population: 3,360 (all inside urban clusters), Rural population: 24 (all nonfarm))
Houses: 1,797 (1,609 occupied: 1,049 owner occupied, 606 renter occupied)
| % of renters here: | 37% |
| State: | 36% |
Housing density: 174 houses/condos per square mile
Median price asked for vacant for-sale houses and condos in 2022 in this county: $220,515.
Median contract rent in 2022: $1,060
Median rent asked for vacant for-rent units in 2022: $303
Median gross rent in Montesano, WA in 2022: $1,222
Housing units in Montesano with a mortgage: 607 (16 second mortgage, 0 home equity loan, 20 both second mortgage and home equity loan)
Houses without a mortgage: 0
Median household income for houses/condos with a mortgage: $86,729
Median household income for apartments without a mortgage: $61,460
Median monthly housing costs: $1,215
Compare current foreclosures near Montesano, WA:
| Photo | Address | Area | Beds / Baths | Price | Details |
|---|---|---|---|---|---|

|
#1
E Pioneer Ave
Montesano, WA 98563
|
- sq. feet
|
- baths - beds |
show details | |

|
#2
Camp Creek Rd
Montesano, WA 98563
|
- sq. feet
|
- baths - beds |
show details | |

|
#3
W Broadway Ave
Montesano, WA 98563
|
- sq. feet
|
- baths - beds |
show details | |

|
#4
Wynooche Valley Rd
Montesano, WA 98563
|
- sq. feet
|
- baths - beds |
show details | |

|
#5
S 10th St
Montesano, WA 98563
|
- sq. feet
|
- baths - beds |
show details | |

|
#6
E Elma Ave
Montesano, WA 98563
|
- sq. feet
|
- baths - beds |
show details | |

|
#7
S 10th St
Montesano, WA 98563
|
- sq. feet
|
- baths - beds |
show details | |

|
#8
E Scott St
Aberdeen, WA 98520
|
1,356 sq. feet
|
2 baths 3 beds |
show details | |

|
#9
Bear Gulch Rd
Aberdeen, WA 98520
|
- sq. feet
|
1 baths 3 beds |
show details | |

|
#10
Cherry St
Hoquiam, WA 98550
|
- sq. feet
|
1 baths 2 beds |
show details |
| Photo | Address | Area | Beds / Baths | Price | Details |
|---|---|---|---|---|---|

|
#11
Pioneer Blvd
Aberdeen, WA 98520
|
1,732 sq. feet
|
1 baths 3 beds |
show details | |

|
#12
Chenault Ave
Hoquiam, WA 98550
|
- sq. feet
|
1 baths 3 beds |
show details | |

|
#13
Monte Elma Rd
Elma, WA 98541
|
- sq. feet
|
3 baths 4 beds |
show details | |

|
#14
N B St
Aberdeen, WA 98520
|
2,000 sq. feet
|
2 baths 3 beds |
show details | |

|
#15
W 5th St
Aberdeen, WA 98520
|
2,010 sq. feet
|
2 baths 3 beds |
show details | |

|
#16
N 12th St
Elma, WA 98541
|
- sq. feet
|
2 baths 3 beds |
show details | |

|
#17
Chenault Ave
Hoquiam, WA 98550
|
- sq. feet
|
1 baths 3 beds |
show details | |

|
#18
N Michigan St
Aberdeen, WA 98520
|
1,416 sq. feet
|
- baths - beds |
show details | |

|
#19
30th St
Hoquiam, WA 98550
|
- sq. feet
|
1 baths 2 beds |
show details | |

|
#20
Monroe St
Hoquiam, WA 98550
|
- sq. feet
|
2 baths 3 beds |
show details |
| Photo | Address | Area | Beds / Baths | Price | Details |
|---|---|---|---|---|---|

|
#21
Aberdeen Ave
Hoquiam, WA 98550
|
- sq. feet
|
1 baths 2 beds |
show details | |

|
#22
Pacific Ave
Hoquiam, WA 98550
|
- sq. feet
|
1 baths 2 beds |
show details | |

|
#23
5th St
Hoquiam, WA 98550
|
- sq. feet
|
2 baths 3 beds |
show details | |

|
#24
Emerson Ave
Hoquiam, WA 98550
|
- sq. feet
|
1 baths 2 beds |
show details | |

|
#25
Maple St
Hoquiam, WA 98550
|
1,646 sq. feet
|
- baths - beds |
show details | |

|
#26
W 2nd St
Aberdeen, WA 98520
|
- sq. feet
|
1 baths 2 beds |
show details | |

|
#27
N I St
Aberdeen, WA 98520
|
- sq. feet
|
2 baths 3 beds |
show details | |

|
#28
Oakhurst Dr
Elma, WA 98541
|
- sq. feet
|
2 baths 3 beds |
show details | |

|
#29
W Main St
Elma, WA 98541
|
- sq. feet
|
1 baths 2 beds |
show details | |

|
#30
Basich Blvd
Aberdeen, WA 98520
|
- sq. feet
|
- baths - beds |
show details |
| Photo | Address | Area | Beds / Baths | Price | Details |
|---|---|---|---|---|---|

|
#31
Constantine Way
Aberdeen, WA 98520
|
- sq. feet
|
- baths - beds |
show details | |

|
#32
Perry Ave
Hoquiam, WA 98550
|
- sq. feet
|
- baths - beds |
show details | |

|
#33
W 2nd St
Aberdeen, WA 98520
|
- sq. feet
|
- baths - beds |
show details | |

|
#34
E Wishkah St # 115
Aberdeen, WA 98520
|
- sq. feet
|
- baths - beds |
show details | |

|
#35
E 4th St # 3
Aberdeen, WA 98520
|
- sq. feet
|
- baths - beds |
show details | |

|
#36
N Summit Rd
Mccleary, WA 98557
|
- sq. feet
|
- baths - beds |
show details | |

|
#37
W Wishkah St
Aberdeen, WA 98520
|
- sq. feet
|
- baths - beds |
show details | |

|
#38
N C St
Aberdeen, WA 98520
|
- sq. feet
|
- baths - beds |
show details | |

|
#39
E 1st St Apt 201
Aberdeen, WA 98520
|
- sq. feet
|
- baths - beds |
show details | |

|
#40
Solki Rd
Aberdeen, WA 98520
|
- sq. feet
|
- baths - beds |
show details |
| Photo | Address | Area | Beds / Baths | Price | Details |
|---|---|---|---|---|---|

|
#41
S 6th St
Mccleary, WA 98557
|
- sq. feet
|
- baths - beds |
show details | |

|
#42
W Oak St
Mccleary, WA 98557
|
- sq. feet
|
- baths - beds |
show details | |

|
#43
Blaine Rd
Aberdeen, WA 98520
|
- sq. feet
|
- baths - beds |
show details | |

|
#44
Central Park Dr
Aberdeen, WA 98520
|
- sq. feet
|
- baths - beds |
show details | |

|
#45
River Rd
Aberdeen, WA 98520
|
- sq. feet
|
- baths - beds |
show details | |

|
#46
W Market St
Aberdeen, WA 98520
|
- sq. feet
|
- baths - beds |
show details | |

|
#47
E 10th St
Aberdeen, WA 98520
|
- sq. feet
|
- baths - beds |
show details | |

|
#48
Pacific Ave
Aberdeen, WA 98520
|
- sq. feet
|
- baths - beds |
show details | |

|
#49
W Martin St
Elma, WA 98541
|
- sq. feet
|
- baths - beds |
show details | |

|
Check over 1 million property listings on Foreclosure.com!
|
browse all offers | |||

Latest news about housing in Montesano, WA collected exclusively by city-data.com from local newspapers, TV, and radio stations

 | Ocean Shores, WA Real Estate (66 replies) |
| Affordable housing in Western WA? (54 replies) |
| Real Estate Prices are Unaffordable for Senior Citizen (41 replies) |
| Are you ready for gas tax increase in January? (124 replies) |
| Disabled, Camping on the Olympic Peninsula, and Housing. (47 replies) |
| Where should I move? Looking for community… (59 replies) |

Median year apartment built: 1959
Household type by relationship:
Households: 4,198- Male householders: 909 (193 living alone), Female householders: 697 (235 living alone)
781 spouses (781 opposite-sex spouses), 77 unmarried partners, (77 opposite-sex unmarried partners), 1,106 children (1,106 natural, 0 adopted, 0 stepchildren), 168 grandchildren, 71 brothers or sisters, 54 parents, 39 foster children, 59 other relatives, 76 non-relatives
- In group quarters: 155
Size of family households: 575 2-persons, 116 3-persons, 170 4-persons, 153 5-persons, 62 7-or-more-persons.
Size of nonfamily households: 480 1-person, 43 2-persons.
538 married couples with children.
239 single-parent households (61 men, 178 women).
97.2% of residents of Montesano speak English at home.
0.9% of residents speak Spanish at home (100% speak English very well).
2.0% of residents speak other Indo-European language at home (74% speak English very well, 26% speak English well).
Foreign born population: 168 (4.0%)
(79.2% of them are naturalized citizens)
| Here: | 6.2 |
| State: | 6.5 |
| Here: | 3.9 |
| State: | 3.9 |

- Bedrooms in owner-occupied houses and condos in Montesano, Washington
- 0no bedroom
- 01 bedroom
- 1652 bedrooms
- 6613 bedrooms
- 1374 bedrooms
- 865+ bedrooms

- Bedrooms in renter-occupied apartments in Montesano, Washington
- 8no bedroom
- 1281 bedroom
- 2332 bedrooms
- 1453 bedrooms
- 384 bedrooms
- 555+ bedrooms

- Cars and other vehicles available in Montesano in owner-occupied houses/condos
- 9no vehicle
- 3321 vehicle
- 3932 vehicles
- 1773 vehicles
- 1254 vehicles
- 135+ vehicles

- Cars and other vehicles available in Montesano in renter-occupied apartments
- 15no vehicle
- 4241 vehicle
- 1022 vehicles
- 573 vehicles
- 94 vehicles
- 05+ vehicles

- Rooms in owner-occupied houses in Montesano, Washington
- 01 room
- 02 rooms
- 233 rooms
- 654 rooms
- 3005 rooms
- 1906 rooms
- 1957 rooms
- 738 rooms
- 2029+ rooms

- Rooms in renter-occupied apartments in Montesano, Washington
- 81 room
- 02 rooms
- 1703 rooms
- 2094 rooms
- 265 rooms
- 196 rooms
- 617 rooms
- 998 rooms
- 159+ rooms


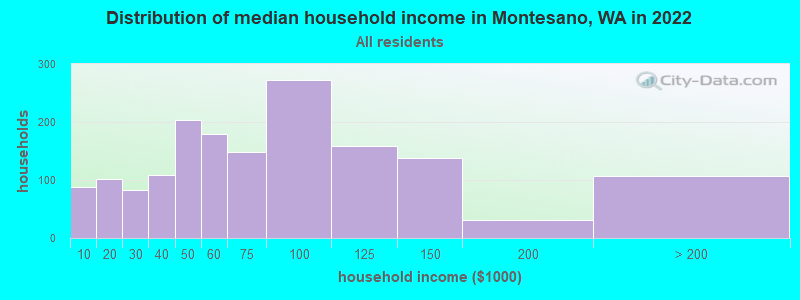
Montesano, WA household income distribution

- 88Less than $10,000
- 102$10,000 to $19,999
- 83$20,000 to $29,999
- 108$30,000 to $39,999
- 203$40,000 to $49,999
- 179$50,000 to $59,999
- 149$60,000 to $74,999
- 272$75,000 to $99,999
- 158$100,000 to $124,999
- 138$125,000 to $149,999
- 31$150,000 to $199,999
- 107$200,000 or more
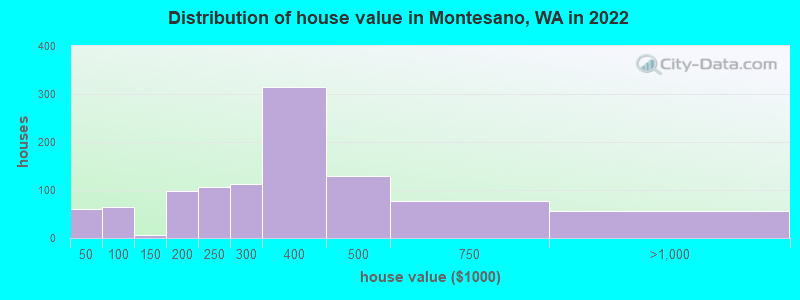
Home value of owner - occupied houses in 2022 in Montesano, WA
-
- 16Less than $10,000
- 44$15,000 to $19,999
- 64$60,000 to $69,999
- 6$100,000 to $124,999
- 14$150,000 to $174,999
- 83$175,000 to $199,999
- 106$200,000 to $249,999
- 112$250,000 to $299,999
- 314$300,000 to $399,999
- 130$400,000 to $499,999
- 78$500,000 to $749,999
- 55$750,000 to $999,999
Rent paid by renters in 2022 in Montesano, WA
-
- 130$150 to $199
- 12$300 to $349
- 9$450 to $499
- 5$550 to $599
- 4$600 to $649
- 28$650 to $699
- 15$750 to $799
- 53$800 to $899
- 21$900 to $999
- 158$1,000 to $1,249
- 84$1,250 to $1,499
- 47$1,500 to $1,999
- 9No cash rent


Percentage of workers working in this county: 85.4%
Number of people working at home: 129 (9.1% of all workers)
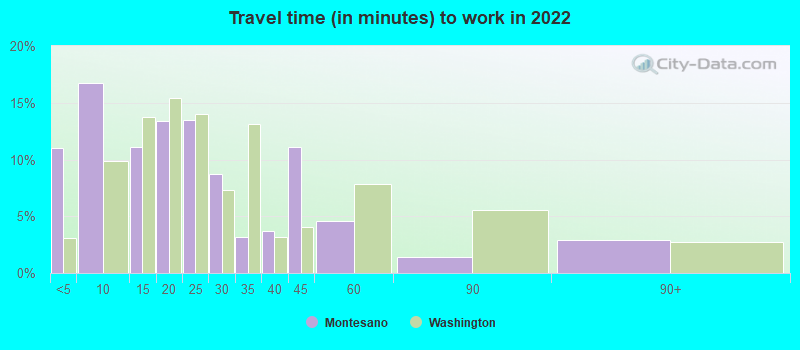
Travel time to work (commute)
- Less than 5 minutes: 213
- 5 to 9 minutes: 186
- 10 to 14 minutes: 153
- 15 to 19 minutes: 130
- 20 to 24 minutes: 352
- 25 to 29 minutes: 52
- 30 to 34 minutes: 50
- 35 to 39 minutes: 0
- 40 to 44 minutes: 0
- 45 to 59 minutes: 83
- 60 to 89 minutes: 97
- 90 or more minutes: 0
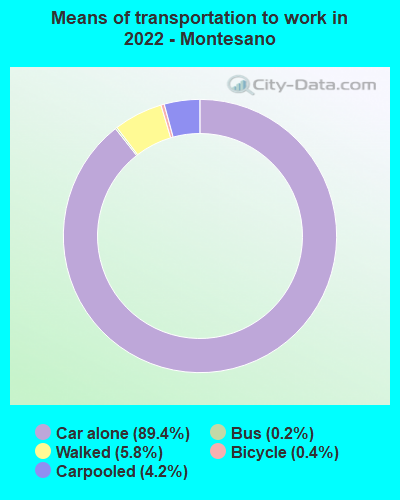
Means of transportation to work:
- Drove a car alone: 1,577 (80.9%)
- Carpooled: 77 (3.9%)
- Bus: 2 (0.1%)
- Bicycle: 6 (0.3%)
- Walked: 103 (5.3%)
- Worked at home: 129 (6.6%)

- Unemployment by race in 2022
- Unemployment rate for White non-Hispanic residents
- 3.7%Males
- 0.6%Females
- Unemployment rate for two or more race residents
- 17.8%Females
- Unemployment rate for Hispanic or Latino residents
- 46.5%Females

- Year of entry for the foreign-born population in Montesano, Washington
- 222010 or later
- 262000 to 2009
- 161990 to 1999
- 01980 to 1989
- 101970 to 1979
- 49Before 1970
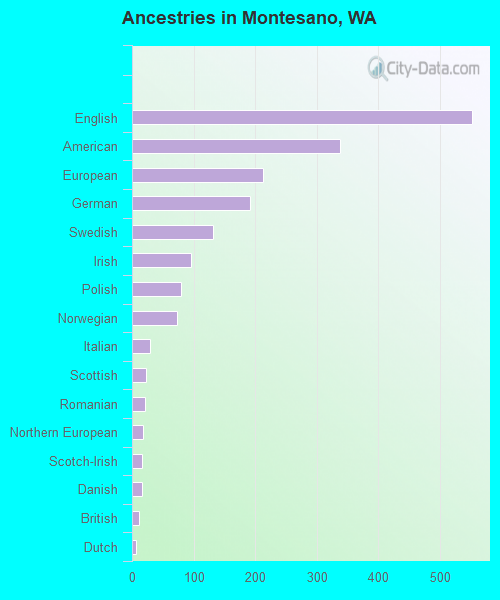
First ancestries reported:
- English: 552 (25.5%)
- American: 338 (15.6%)
- European: 212 (9.8%)
- German: 191 (8.8%)
- Swedish: 131 (6.1%)
- Irish: 95 (4.4%)
- Polish: 79 (3.6%)
- Norwegian: 73 (3.4%)
- Italian: 30 (1.4%)
- Scottish: 22 (1.0%)
- Romanian: 21 (1.0%)
- Northern European: 18 (0.8%)
- Scotch-Irish: 17 (0.8%)
- Danish: 16 (0.7%)
- British: 12 (0.6%)
- Dutch: 7 (0.3%)
- Czechoslovakian: 2 (0.09%)
Most common places of birth for foreign-born residents (%):
| Montesano: | 48.6% (69) |
| Washington: | 4.1% (47,238) |
| Montesano: | 15.5% (22) |
| Washington: | 0.7% (7,568) |
| Montesano: | 6.3% (9) |
| Washington: | 4.3% (48,886) |
| Montesano: | 6.3% (9) |
| Washington: | 6.3% (71,661) |
| Montesano: | 4.9% (7) |
| Washington: | 1.6% (17,761) |
| Montesano: | 4.9% (7) |
| Washington: | 0.4% (4,963) |
| Montesano: | 3.5% (5) |
| Washington: | 0.4% (4,499) |
Place of birth for U.S.-born residents:
- This state: 2,773
- Other state: 1,202
- Northeast: 32
- Midwest: 275
- South: 74
- West: 829
79.3% of Montesano residents lived in the same house 1 years ago.
Out of people who lived in different houses, 16.5% lived in this county.
Out of people who lived in different counties, 96.2% lived in Washington.
| Montesano: | 79.3% |
| State average: | 85.2% |
Education attainment for males 25 years and older:
- No schooling: 0
- Nursery to 4th grade: 0
- 5th and 6th grade: 0
- 7th and 8th grade: 0
- 9th grade: 0
- 10th grade: 0
- 11th grade: 21
- 12th grade, no diploma: 0
- High school graduate (or equivalency): 367
- Less than 1 year of college: 195
- Some college more than 1 year, no degree: 244
- Associate degree: 100
- Bachelor's degree: 409
- Master's degree: 70
- Professional school degree: 0
- Doctorate degree: 9

Education attainment for females 25 years and older:
- No schooling: 0
- Nursery to 4th grade: 2
- 5th and 6th grade: 0
- 7th and 8th grade: 0
- 9th grade: 0
- 10th grade: 0
- 11th grade: 35
- 12th grade, no diploma: 0
- High school graduate (or equivalency): 531
- Less than 1 year of college: 214
- Some college more than 1 year, no degree: 276
- Associate degree: 147
- Bachelor's degree: 311
- Master's degree: 49
- Professional school degree: 8
- Doctorate degree: 4


Housing units in structures:
- One, detached: 1,308
- Two: 47
- 3 or 4: 184
- 5 to 9: 54
- 10 to 19: 11
- 20 to 49: 100
- Mobile homes: 90
Median worth of mobile homes: $111,540
House/condo owner moved in on average 15 years ago
Renter moved in on average 2 years ago

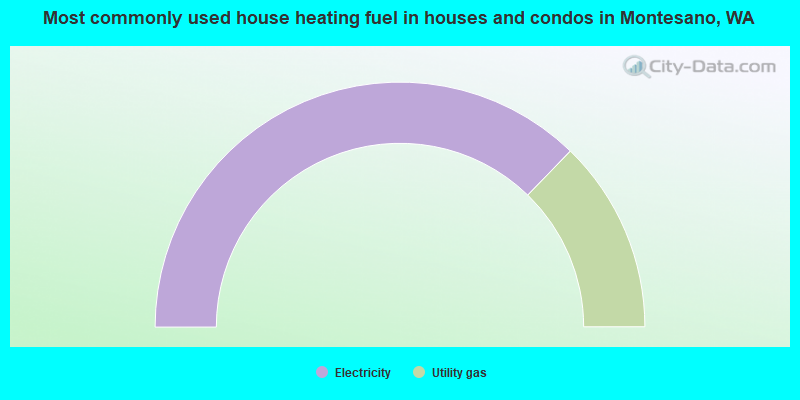
- 74.5%Electricity
- 25.5%Utility gas
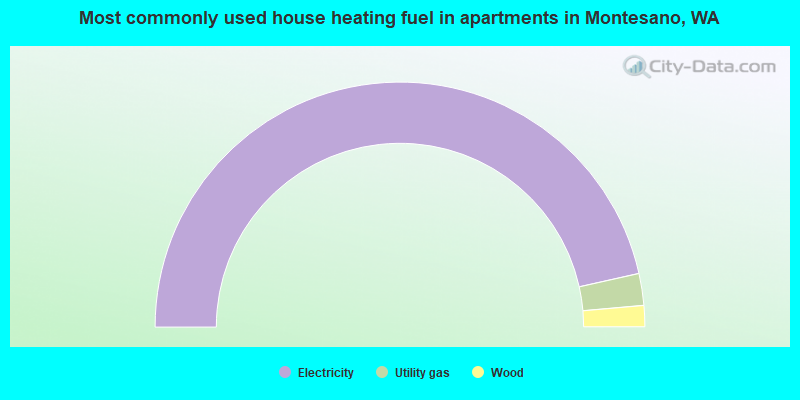
- 93.1%Electricity
- 4.2%Utility gas
- 2.8%Wood
Private vs. public school enrollment:
| Here: | 3.6% |
| Washington: | 12.4% |
| Here: | 0.0% |
| Washington: | 9.2% |
| Here: | 0.0% |
| Washington: | 16.5% |


