Monticello, IL (Illinois) Houses and Residents
| Monticello: | $206,983 |
| Illinois: | $251,600 |
Mean price in 2022:
Detached houses: $209,474
Here: $209,474 State: $310,164 Townhouses or other attached units: $169,216
Here: $169,216 State: $286,230 Mobile homes: $9,016
Here: $9,016 State: $78,855
Total population: 5,516 (Urban population: 5,082 (all inside urban clusters), Rural population: 29 (all nonfarm))
Houses: 2,787 (2,648 occupied: 2,167 owner occupied, 514 renter occupied)
| % of renters here: | 19% |
| State: | 33% |
Housing density: 936 houses/condos per square mile
Median price asked for vacant for-sale houses and condos in 2022: $107,481.
Median contract rent in 2022: $789 (lower quartile is $726, upper quartile is $1,291)
Median rent asked for vacant for-rent units in 2022: $855
Median gross rent in Monticello, IL in 2022: $987
Housing units in Monticello with a mortgage: 1,397 (100 second mortgage, 0 home equity loan, 89 both second mortgage and home equity loan)
Houses without a mortgage: 14
Median household income for houses/condos with a mortgage: $98,883
Median household income for apartments without a mortgage: $67,897
Median monthly housing costs: $1,103
Compare current foreclosures near Monticello, IL:
| Photo | Address | Area | Beds / Baths | Price | Details |
|---|---|---|---|---|---|

|
#1
E 5th St
Hammond, IL 61929
|
- sq. feet
|
1 baths 4 beds |
$14,900
|
show details |

|
#2
N 1225 East Rd
Monticello, IL 61856
|
- sq. feet
|
- baths - beds |
show details | |

|
#3
W William St
Monticello, IL 61856
|
- sq. feet
|
- baths - beds |
show details | |

|
#4
W Clinton Ave
Farmer City, IL 61842
|
1,180 sq. feet
|
1 baths 5 beds |
show details | |

|
#5
Maple St
Weldon, IL 61882
|
879 sq. feet
|
1 baths 2 beds |
show details | |

|
#6
N Kenwood St
Argenta, IL 62501
|
1,014 sq. feet
|
2 baths - beds |
show details | |

|
#7
E Broadway St
Argenta, IL 62501
|
1,632 sq. feet
|
1 baths - beds |
show details | |

|
#8
W Wilson St
Bement, IL 61813
|
- sq. feet
|
2 baths 3 beds |
show details | |

|
#9
1/2 N Main St, Lot 2
Farmer City, IL 61842
|
- sq. feet
|
- baths - beds |
show details | |

|
#10
Boulder Ridge Dr
Champaign, IL 61822
|
- sq. feet
|
- baths - beds |
show details |
| Photo | Address | Area | Beds / Baths | Price | Details |
|---|---|---|---|---|---|

|
#11
Macon St
Mahomet, IL 61853
|
- sq. feet
|
- baths - beds |
show details | |

|
#12
E Franklin St
Mahomet, IL 61853
|
- sq. feet
|
- baths - beds |
show details | |

|
#13
Boulder Ridge Dr
Champaign, IL 61822
|
- sq. feet
|
- baths - beds |
show details | |

|
#14
County Road O E
Mahomet, IL 61853
|
- sq. feet
|
- baths - beds |
show details | |

|
#15
N William St Apt 3
Farmer City, IL 61842
|
- sq. feet
|
- baths - beds |
show details | |

|
#16
Goldenview Dr
Champaign, IL 61821
|
- sq. feet
|
- baths - beds |
show details | |

|
#17
W Austin St
Tolono, IL 61880
|
- sq. feet
|
- baths - beds |
show details | |

|
#18
W William St
Champaign, IL 61821
|
- sq. feet
|
- baths - beds |
show details | |

|
#19
Sedgegrass Dr
Champaign, IL 61822
|
- sq. feet
|
- baths - beds |
show details | |

|
#20
Crowwood Dr Apt 104
Champaign, IL 61822
|
- sq. feet
|
- baths - beds |
show details |
| Photo | Address | Area | Beds / Baths | Price | Details |
|---|---|---|---|---|---|

|
#21
Kimberly Dr
Champaign, IL 61821
|
- sq. feet
|
- baths - beds |
show details | |

|
#22
Jennifer Dr # A
Mahomet, IL 61853
|
- sq. feet
|
- baths - beds |
show details | |

|
#23
4th St
Ivesdale, IL 61851
|
- sq. feet
|
- baths - beds |
show details | |

|
#24
Tilton St
Ivesdale, IL 61851
|
- sq. feet
|
- baths - beds |
show details | |

|
#25
N Piatt St
Bement, IL 61813
|
- sq. feet
|
- baths - beds |
show details | |

|
#26
N Main St
Argenta, IL 62501
|
- sq. feet
|
- baths - beds |
show details | |

|
#27
Santa Ana Rd
Champaign, IL 61822
|
- sq. feet
|
- baths - beds |
show details | |

|
#28
W Kirby Ave
Champaign, IL 61821
|
- sq. feet
|
- baths - beds |
show details | |

|
#29
N Juniper Dr
Atwood, IL 61913
|
- sq. feet
|
- baths - beds |
show details | |

|
#30
Hilltop Ct
Mahomet, IL 61853
|
- sq. feet
|
- baths - beds |
show details |
| Photo | Address | Area | Beds / Baths | Price | Details |
|---|---|---|---|---|---|

|
#31
Clayton Blvd
Champaign, IL 61822
|
- sq. feet
|
- baths - beds |
show details | |

|
#32
Devonshire Dr
Champaign, IL 61821
|
- sq. feet
|
- baths - beds |
show details | |

|
#33
S Mattis Ave
Champaign, IL 61821
|
- sq. feet
|
- baths - beds |
show details | |

|
#34
N Champaign St
Bement, IL 61813
|
- sq. feet
|
- baths - beds |
show details | |

|
#35
Sangamon Dr
Champaign, IL 61821
|
- sq. feet
|
- baths - beds |
show details | |

|
#36
W Forest Ave
Atwood, IL 61913
|
- sq. feet
|
- baths - beds |
show details | |

|
#37
Bryce Ln
Tolono, IL 61880
|
- sq. feet
|
- baths - beds |
show details | |

|
#38
Riverwood Pt
Mahomet, IL 61853
|
- sq. feet
|
- baths - beds |
show details | |

|
#39
E 1500 North Rd
Cisco, IL 61830
|
- sq. feet
|
- baths - beds |
show details | |

|
#40
Nofftz Dr
Champaign, IL 61821
|
- sq. feet
|
- baths - beds |
show details |
| Photo | Address | Area | Beds / Baths | Price | Details |
|---|---|---|---|---|---|

|
#41
N 1450 East Rd
White Heath, IL 61884
|
- sq. feet
|
- baths - beds |
show details | |

|
#42
Oakcrest Dr
Champaign, IL 61821
|
- sq. feet
|
- baths - beds |
show details | |

|
#43
Southwood Dr
Champaign, IL 61821
|
- sq. feet
|
- baths - beds |
show details | |

|
#44
E East St
Argenta, IL 62501
|
- sq. feet
|
- baths - beds |
show details | |

|
#45
Southwood Dr
Champaign, IL 61821
|
- sq. feet
|
- baths - beds |
show details | |

|
#46
Wynstone Dr
Champaign, IL 61822
|
- sq. feet
|
- baths - beds |
show details | |

|
#47
N Main St
Mansfield, IL 61854
|
- sq. feet
|
- baths - beds |
show details | |

|
#48
E Elm St
Argenta, IL 62501
|
- sq. feet
|
- baths - beds |
show details | |

|
#49
Venice Ct
Champaign, IL 61822
|
- sq. feet
|
- baths - beds |
show details | |

|
Check over 1 million property listings on Foreclosure.com!
|
browse all offers | |||

Latest news about housing in Monticello, IL collected exclusively by city-data.com from local newspapers, TV, and radio stations

 | Chambana or Mahomet/Monticello (6 replies) |
| Close areas to buy a lakehouse/rural property in Illinois? (8 replies) |
| How many of you have lived in Chicago all your life? (39 replies) |
| Looking for home for rent (4 replies) |
| Naperville vs Geneva vs St Charles (Moving from TX) (10 replies) |
| Looking for small town in central illinois (7 replies) |

Median year apartment built: 1985
Household type by relationship:
Households: 6,249- Male householders: 1,132 (346 living alone), Female householders: 1,467 (440 living alone)
1,483 spouses (1,483 opposite-sex spouses), 131 unmarried partners, (131 opposite-sex unmarried partners), 1,514 children (1,362 natural, 117 adopted, 34 stepchildren), 200 grandchildren, 39 brothers or sisters, 0 parents, 0 foster children, 39 other relatives, 171 non-relatives
- In group quarters: 69
Size of family households: 885 2-persons, 456 3-persons, 248 4-persons, 160 5-persons.
Size of nonfamily households: 828 1-person, 73 2-persons, 22 3-persons.
1,002 married couples with children.
83 single-parent households (5 men, 78 women).
97.9% of residents of Monticello speak English at home.
1.9% of residents speak Spanish at home (73% speak English very well, 27% speak English well).
Foreign born population: 21 (0.3%)
(100.0% of them are naturalized citizens)
| Here: | 7.0 |
| State: | 6.4 |
| Here: | 4.3 |
| State: | 4.1 |

- Bedrooms in owner-occupied houses and condos in Monticello, Illinois
- 0no bedroom
- 01 bedroom
- 4982 bedrooms
- 9703 bedrooms
- 6074 bedrooms
- 945+ bedrooms

- Bedrooms in renter-occupied apartments in Monticello, Illinois
- 0no bedroom
- 2471 bedroom
- 1882 bedrooms
- 793 bedrooms
- 04 bedrooms
- 05+ bedrooms

- Cars and other vehicles available in Monticello in owner-occupied houses/condos
- 20no vehicle
- 5371 vehicle
- 1,0472 vehicles
- 3683 vehicles
- 884 vehicles
- 1075+ vehicles

- Cars and other vehicles available in Monticello in renter-occupied apartments
- 64no vehicle
- 2751 vehicle
- 1402 vehicles
- 363 vehicles
- 04 vehicles
- 05+ vehicles

- Rooms in owner-occupied houses in Monticello, Illinois
- 01 room
- 02 rooms
- 353 rooms
- 1064 rooms
- 3585 rooms
- 3646 rooms
- 4587 rooms
- 3438 rooms
- 5049+ rooms

- Rooms in renter-occupied apartments in Monticello, Illinois
- 01 room
- 602 rooms
- 1283 rooms
- 774 rooms
- 1295 rooms
- 256 rooms
- 187 rooms
- 588 rooms
- 189+ rooms


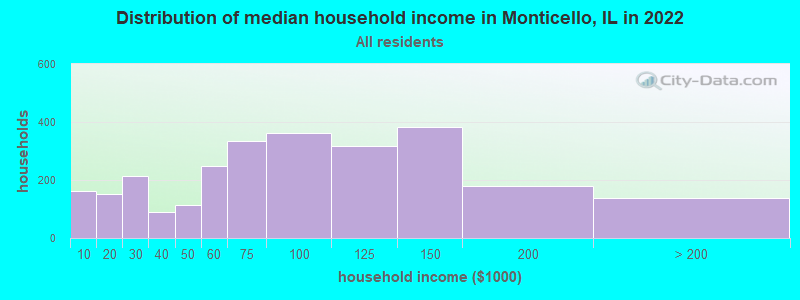
Monticello, IL household income distribution

- 163Less than $10,000
- 152$10,000 to $19,999
- 213$20,000 to $29,999
- 88$30,000 to $39,999
- 115$40,000 to $49,999
- 247$50,000 to $59,999
- 336$60,000 to $74,999
- 361$75,000 to $99,999
- 316$100,000 to $124,999
- 383$125,000 to $149,999
- 179$150,000 to $199,999
- 138$200,000 or more
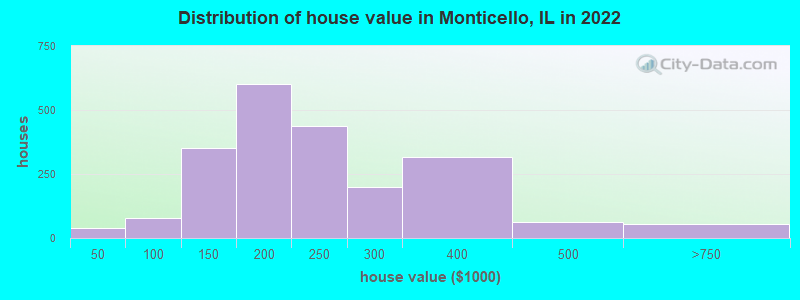
Home value of owner - occupied houses in 2022 in Monticello, IL
-
- 40Less than $10,000
- 21$60,000 to $69,999
- 24$70,000 to $79,999
- 20$80,000 to $89,999
- 12$90,000 to $99,999
- 192$100,000 to $124,999
- 157$125,000 to $149,999
- 360$150,000 to $174,999
- 239$175,000 to $199,999
- 439$200,000 to $249,999
- 199$250,000 to $299,999
- 316$300,000 to $399,999
- 60$400,000 to $499,999
- 56$500,000 to $749,999
Rent paid by renters in 2022 in Monticello, IL
-
- 26$400 to $449
- 23$600 to $649
- 22$650 to $699
- 90$700 to $749
- 97$750 to $799
- 62$800 to $899
- 49$900 to $999
- 33$1,250 to $1,499
- 45$1,500 to $1,999
- 30$2,000 to $2,499
- 20$3,500 or more
- 18No cash rent

Percentage of workers working in this county: 44.8%
Number of people working at home: 349 (11.1% of all workers)
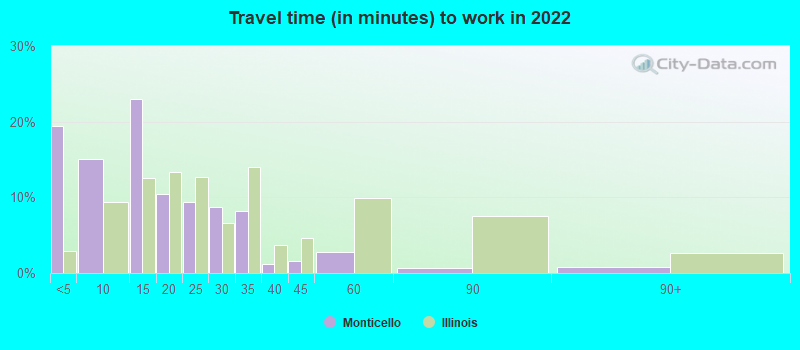
Travel time to work (commute)
- Less than 5 minutes: 369
- 5 to 9 minutes: 260
- 10 to 14 minutes: 188
- 15 to 19 minutes: 82
- 20 to 24 minutes: 415
- 25 to 29 minutes: 321
- 30 to 34 minutes: 699
- 35 to 39 minutes: 194
- 40 to 44 minutes: 94
- 45 to 59 minutes: 56
- 60 to 89 minutes: 70
- 90 or more minutes: 22
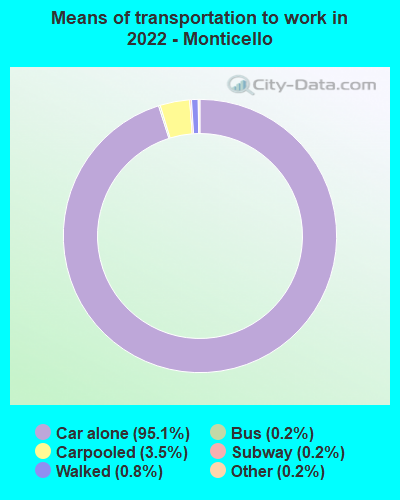
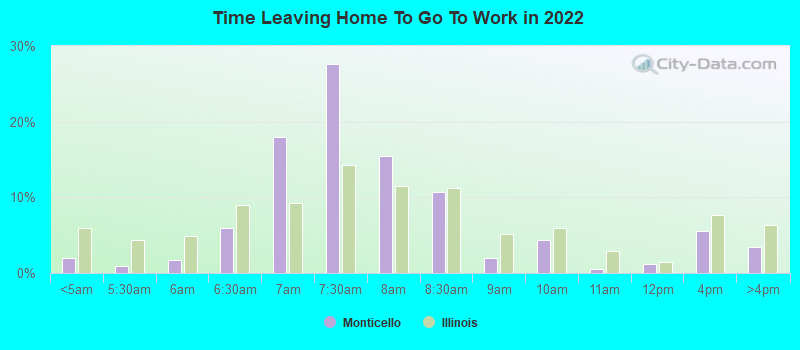
Means of transportation to work:
- Drove a car alone: 1,853 (80.9%)
- Carpooled: 73 (3.2%)
- Bus: 3 (0.1%)
- Long-distance train or commuter rail: 2 (0.1%)
- Taxi: 4 (0.2%)
- Walked: 15 (0.7%)
- Worked at home: 349 (15.2%)
- Unemployment by race in 2022
- Unemployment rate for White non-Hispanic residents
- 0.6%Males
- 2.1%Females

- Year of entry for the foreign-born population in Monticello, Illinois
- 02010 or later
- 02000 to 2009
- 201990 to 1999
- 121980 to 1989
- 01970 to 1979
- 14Before 1970

First ancestries reported:
- German: 669 (25.4%)
- English: 533 (20.2%)
- American: 481 (18.2%)
- Irish: 372 (14.1%)
- European: 90 (3.4%)
- Czech: 83 (3.1%)
- Scottish: 39 (1.5%)
- Hungarian: 37 (1.4%)
- Portuguese: 27 (1.0%)
- Polish: 23 (0.9%)
- Dutch: 16 (0.6%)
- Greek: 15 (0.6%)
- Scotch-Irish: 15 (0.6%)
- Swedish: 15 (0.6%)
- Welsh: 15 (0.6%)
- Austrian: 12 (0.5%)
- Alsatian: 11 (0.4%)
- British: 2 (0.08%)
Most common places of birth for foreign-born residents (%):
| Monticello: | 109.5% (23) |
| Illinois: | 0.2% (2,861) |
Place of birth for U.S.-born residents:
- This state: 5,168
- Other state: 1,002
- Northeast: 114
- Midwest: 509
- South: 185
- West: 198
90.4% of Monticello residents lived in the same house 1 years ago.
Out of people who lived in different houses, 30.6% lived in this county.
Out of people who lived in different counties, 91.1% lived in Illinois.
| Monticello: | 90.4% |
| State average: | 88.3% |
Education attainment for males 25 years and older:
- No schooling: 11
- Nursery to 4th grade: 0
- 5th and 6th grade: 0
- 7th and 8th grade: 40
- 9th grade: 18
- 10th grade: 0
- 11th grade: 24
- 12th grade, no diploma: 53
- High school graduate (or equivalency): 631
- Less than 1 year of college: 49
- Some college more than 1 year, no degree: 185
- Associate degree: 297
- Bachelor's degree: 587
- Master's degree: 181
- Professional school degree: 0
- Doctorate degree: 78

Education attainment for females 25 years and older:
- No schooling: 0
- Nursery to 4th grade: 0
- 5th and 6th grade: 0
- 7th and 8th grade: 0
- 9th grade: 0
- 10th grade: 0
- 11th grade: 44
- 12th grade, no diploma: 58
- High school graduate (or equivalency): 563
- Less than 1 year of college: 225
- Some college more than 1 year, no degree: 246
- Associate degree: 296
- Bachelor's degree: 611
- Master's degree: 343
- Professional school degree: 33
- Doctorate degree: 20


Housing units in structures:
- One, detached: 2,185
- One, attached: 227
- Two: 39
- 3 or 4: 21
- 5 to 9: 46
- 10 to 19: 76
- 20 to 49: 141
- 50 or more: 17
- Mobile homes: 34
Housing units lacking complete kitchen facilities in 2022: 2.1%
House/condo owner moved in on average 9 years ago
Renter moved in on average 6 years ago

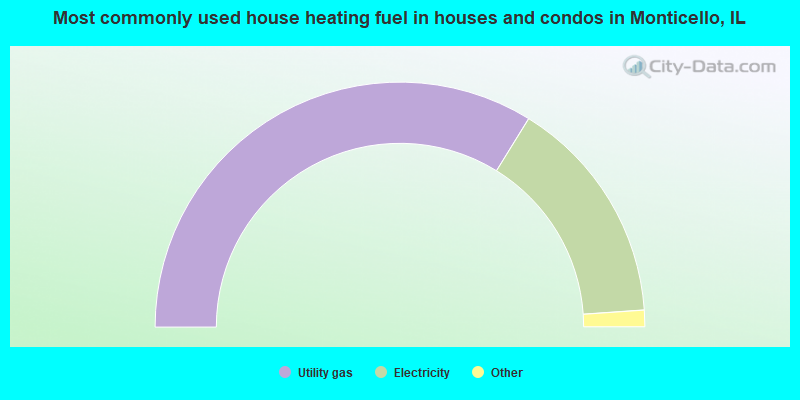
- 67.7%Utility gas
- 30.2%Electricity
- 0.8%Fuel oil, kerosene, etc.
- 0.8%Bottled, tank, or LP gas
- 0.6%Other fuel
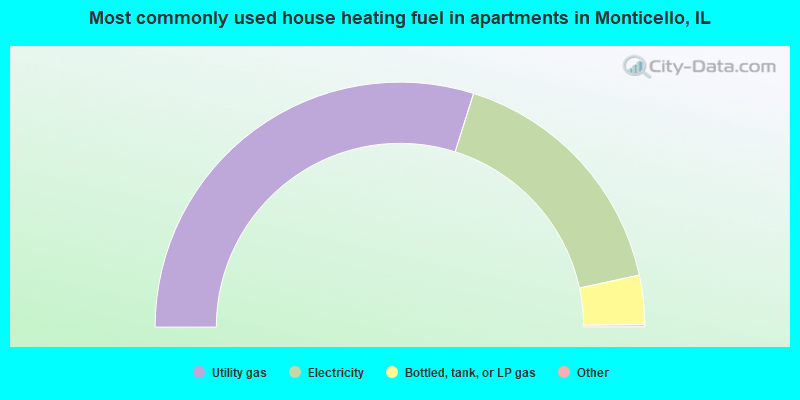
- 59.9%Utility gas
- 33.6%Electricity
- 6.5%Bottled, tank, or LP gas
Private vs. public school enrollment:
| Here: | 6.1% |
| Illinois: | 13.3% |
| Here: | 6.9% |
| Illinois: | 9.9% |
| Here: | 14.4% |
| Illinois: | 27.4% |


