Monticello, NY (New York) Houses and Residents
| Monticello: | $172,592 |
| New York: | $400,400 |
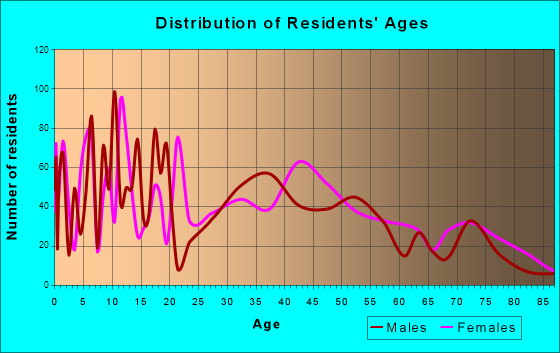
Total population: 6,651 (Urban population: 6,343 (all inside urban clusters), Rural population: 150 (all nonfarm))
Houses: 3,190 (2,599 occupied: 749 owner occupied, 2,066 renter occupied)
| % of renters here: | 73% |
| State: | 46% |
Housing density: 784 houses/condos per square mile
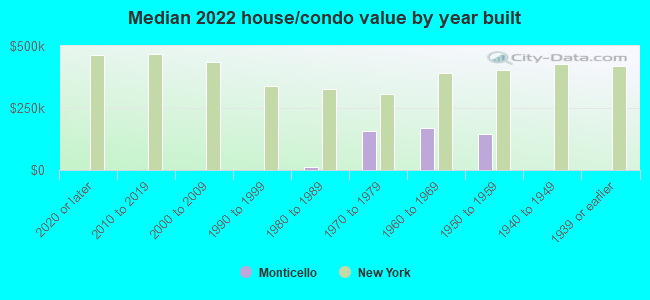
Median price asked for vacant for-sale houses and condos in 2022 in this county: $640,942.
Median contract rent in 2022: $795 (lower quartile is $582, upper quartile is $1,074)
Median rent asked for vacant for-rent units in 2022: $2,020
Median gross rent in Monticello, NY in 2022: $895
Housing units in Monticello with a mortgage: 305 (17 second mortgage, 22 home equity loan, 2 both second mortgage and home equity loan)
Houses without a mortgage: 13
Median household income for houses/condos with a mortgage: $161,455
Median household income for apartments without a mortgage: $66,398
Median monthly housing costs: $897
Compare current foreclosures near Monticello, NY:
| Photo | Address | Area | Beds / Baths | Price | Details |
|---|---|---|---|---|---|

|
#1
Hidden Ridge Dr
Monticello, NY 12701
|
1,114 sq. feet
|
2 baths 2 beds |
show details | |

|
#2
York Ave
Monticello, NY 12701
|
1,602 sq. feet
|
1 baths 3 beds |
show details | |

|
#3
Lincoln Pl
Monticello, NY 12701
|
1,836 sq. feet
|
2 baths 4 beds |
show details | |

|
#4
W Broadway Apt 30
Monticello, NY 12701
|
- sq. feet
|
- baths - beds |
show details | |

|
#5
Forestburgh Rd
Monticello, NY 12701
|
- sq. feet
|
- baths - beds |
show details | |

|
#6
Dom Dr
Monticello, NY 12701
|
- sq. feet
|
- baths - beds |
show details | |

|
#7
Alpine Dr
Woodridge, NY 12789
|
1,378 sq. feet
|
2 baths 2 beds |
$259,900
|
show details |

|
#8
Wawanda Ave
Liberty, NY 12754
|
1,000 sq. feet
|
1 baths 2 beds |
$54,900
|
show details |

|
#9
Lake Shore Dr E
Rock Hill, NY 12775
|
2,820 sq. feet
|
3 baths 4 beds |
$439,900
|
show details |

|
#10
Marion Ave
Liberty, NY 12754
|
1,044 sq. feet
|
2 baths 3 beds |
show details |
| Photo | Address | Area | Beds / Baths | Price | Details |
|---|---|---|---|---|---|

|
#11
Maple Trl
Wurtsboro, NY 12790
|
1,136 sq. feet
|
1 baths 1 beds |
show details | |

|
#12
Birch St
Bloomingburg, NY 12721
|
2,604 sq. feet
|
2 baths 5 beds |
show details | |

|
#13
Haring Rd
Barryville, NY 12719
|
2,896 sq. feet
|
2 baths 5 beds |
show details | |

|
#14
Sagamore Dr
Otisville, NY 10963
|
1,710 sq. feet
|
1 baths 3 beds |
show details | |

|
#15
Ferguson Ln
Wurtsboro, NY 12790
|
- sq. feet
|
- baths - beds |
$36,900
|
show details |

|
#16
Rd B
Cragsmoor, NY 12420
|
960 sq. feet
|
1 baths 3 beds |
show details | |

|
#17
Irish Cape Rd
Napanoch, NY 12458
|
1,128 sq. feet
|
1 baths 2 beds |
show details | |

|
#18
Sarine Rd
Wurtsboro, NY 12790
|
1,657 sq. feet
|
2 baths 4 beds |
show details | |

|
#19
Fire Tower Rd
Bloomingburg, NY 12721
|
2,256 sq. feet
|
2 baths 4 beds |
show details | |

|
#20
Hickory Ln
Barryville, NY 12719
|
800 sq. feet
|
1 baths 2 beds |
show details |
| Photo | Address | Area | Beds / Baths | Price | Details |
|---|---|---|---|---|---|

|
#21
New Vernon Rd
Middletown, NY 10940
|
1,104 sq. feet
|
1 baths 3 beds |
show details | |

|
#22
Roe Rd
Bloomingburg, NY 12721
|
1,862 sq. feet
|
2 baths 3 beds |
show details | |

|
#23
Route 209
Cuddebackville, NY 12729
|
1,250 sq. feet
|
1 baths 3 beds |
show details | |

|
#24
Frey Rd
Pine Bush, NY 12566
|
1,662 sq. feet
|
2 baths 4 beds |
show details | |

|
#25
Shoddy Hollow Rd
Middletown, NY 10940
|
2,160 sq. feet
|
2 baths 4 beds |
show details | |

|
#26
Prosperous Valley Rd
Middletown, NY 10940
|
1,823 sq. feet
|
2 baths 4 beds |
show details | |

|
#27
Guymard Tpke
Middletown, NY 10940
|
3,816 sq. feet
|
2 baths 4 beds |
show details | |

|
#28
Stein Rd
Pine Bush, NY 12566
|
2,880 sq. feet
|
2 baths 6 beds |
show details | |

|
#29
Baran Dr
Glen Spey, NY 12737
|
1,728 sq. feet
|
2 baths 4 beds |
show details | |

|
#30
Yulan Barryville Rd
Barryville, NY 12719
|
1,007 sq. feet
|
1 baths 3 beds |
show details |
| Photo | Address | Area | Beds / Baths | Price | Details |
|---|---|---|---|---|---|

|
#31
Schubert Dr
Pine Bush, NY 12566
|
1,362 sq. feet
|
1 baths 3 beds |
show details | |

|
#32
Cherry Ln
Ellenville, NY 12428
|
2,128 sq. feet
|
1 baths 4 beds |
show details | |

|
#33
White Bridge Rd
Middletown, NY 10940
|
3,960 sq. feet
|
2 baths 3 beds |
show details | |

|
#34
Charlotte Ln
Middletown, NY 10940
|
2,240 sq. feet
|
2 baths 4 beds |
show details | |

|
#35
Red Barn Rd
Pine Bush, NY 12566
|
1,120 sq. feet
|
1 baths 2 beds |
show details | |

|
#36
Stone Schoolhouse Rd
Bloomingburg, NY 12721
|
2,278 sq. feet
|
2 baths 4 beds |
show details | |

|
#37
Grange Rd
Otisville, NY 10963
|
2,066 sq. feet
|
1 baths 3 beds |
show details | |

|
#38
State Route 42
Sparrow Bush, NY 12780
|
1,368 sq. feet
|
2 baths 3 beds |
show details | |

|
#39
Dunthorne Dr
Bloomingburg, NY 12721
|
2,110 sq. feet
|
1 baths 4 beds |
show details | |

|
#40
Bob Cat Rd
Wurtsboro, NY 12790
|
1,728 sq. feet
|
2 baths 3 beds |
show details |
| Photo | Address | Area | Beds / Baths | Price | Details |
|---|---|---|---|---|---|

|
#41
Big Hollow Rd
Grahamsville, NY 12740
|
2,410 sq. feet
|
2 baths 4 beds |
show details | |

|
#42
Pickles Rd
Bloomingburg, NY 12721
|
2,251 sq. feet
|
2 baths 3 beds |
show details | |

|
#43
Maple Ave S
Woodridge, NY 12789
|
2,012 sq. feet
|
1 baths 3 beds |
show details | |

|
#44
Trail One
Wurtsboro, NY 12790
|
2,644 sq. feet
|
2 baths 7 beds |
show details | |

|
#45
Myers Rd
Neversink, NY 12765
|
1,728 sq. feet
|
1 baths 5 beds |
show details | |

|
#46
Rio Dam Rd
Glen Spey, NY 12737
|
1,040 sq. feet
|
1 baths 2 beds |
show details | |

|
#47
State Route 55
Liberty, NY 12754
|
1,846 sq. feet
|
2 baths 4 beds |
show details | |

|
#48
Liberty St
Liberty, NY 12754
|
2,076 sq. feet
|
2 baths 4 beds |
show details | |

|
#49
Marc Ln
Wurtsboro, NY 12790
|
1,008 sq. feet
|
2 baths 3 beds |
show details | |

|
Check over 1 million property listings on Foreclosure.com!
|
browse all offers | |||

Latest news about housing in Monticello, NY collected exclusively by city-data.com from local newspapers, TV, and radio stations


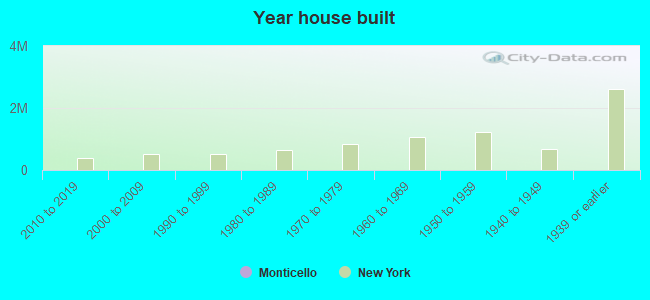
Median year apartment built: 1974
Household type by relationship:
Households: 7,309- Male householders: 806 (348 living alone), Female householders: 1,794 (455 living alone)
676 spouses (676 opposite-sex spouses), 210 unmarried partners, (210 opposite-sex unmarried partners), 2,548 children (2,376 natural, 0 adopted, 172 stepchildren), 60 grandchildren, 153 brothers or sisters, 215 parents, 0 foster children, 285 other relatives, 192 non-relatives
- In group quarters: 365
Size of family households: 617 2-persons, 470 3-persons, 145 4-persons, 160 5-persons, 131 6-persons, 45 7-or-more-persons.
Size of nonfamily households: 878 1-person, 320 2-persons.
611 married couples with children.
1,102 single-parent households (65 men, 1,037 women).
69.3% of residents of Monticello speak English at home.
22.7% of residents speak Spanish at home (70% speak English very well, 16% speak English well, 10% speak English not well, 4% don't speak English at all).
1.4% of residents speak other Indo-European language at home (13% speak English very well, 65% speak English well, 12% speak English not well, 10% don't speak English at all).
3.9% of residents speak Asian or Pacific Island language at home (53% speak English very well, 29% speak English well, 18% speak English not well).
2.2% of residents speak other language at home (100% speak English very well).
Foreign born population: 1,254 (17.2%)
(46.3% of them are naturalized citizens)
| Here: | 5.8 |
| State: | 6.3 |
| Here: | 3.5 |
| State: | 3.8 |
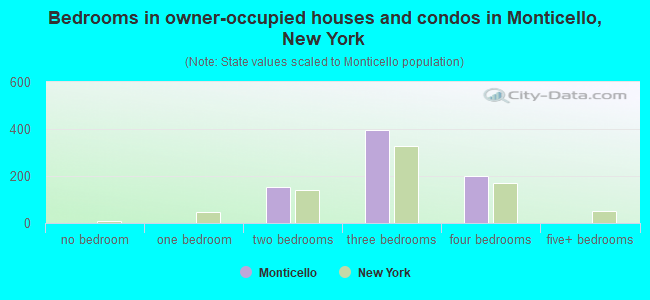
- Bedrooms in owner-occupied houses and condos in Monticello, New York
- 0no bedroom
- 01 bedroom
- 1532 bedrooms
- 3963 bedrooms
- 2014 bedrooms
- 05+ bedrooms
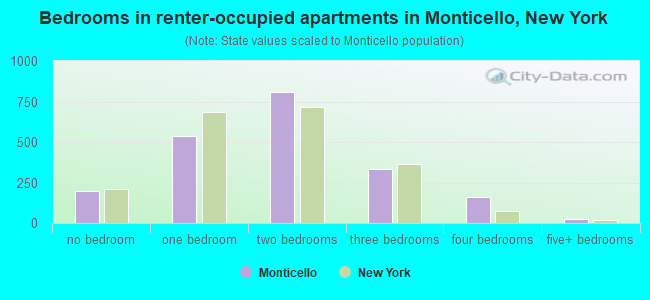
- Bedrooms in renter-occupied apartments in Monticello, New York
- 199no bedroom
- 5391 bedroom
- 8092 bedrooms
- 3323 bedrooms
- 1614 bedrooms
- 265+ bedrooms
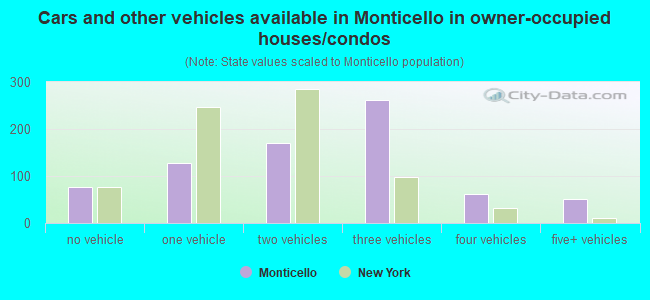
- Cars and other vehicles available in Monticello in owner-occupied houses/condos
- 76no vehicle
- 1281 vehicle
- 1702 vehicles
- 2623 vehicles
- 624 vehicles
- 525+ vehicles
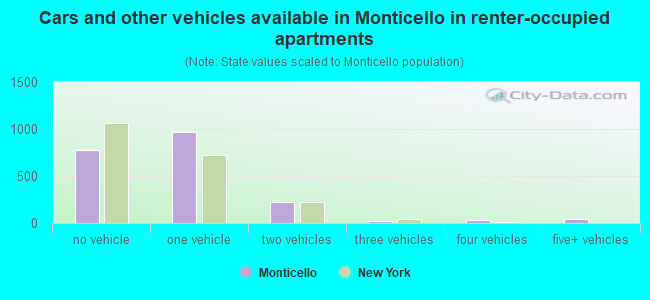
- Cars and other vehicles available in Monticello in renter-occupied apartments
- 781no vehicle
- 9711 vehicle
- 2222 vehicles
- 163 vehicles
- 374 vehicles
- 385+ vehicles
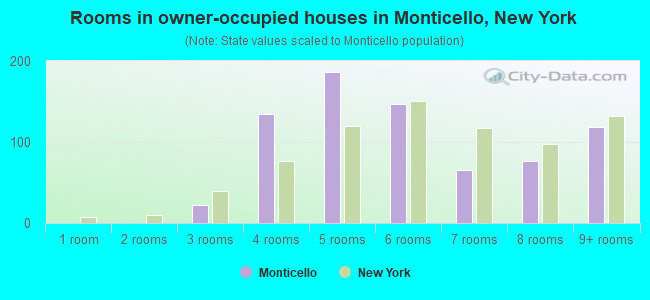
- Rooms in owner-occupied houses in Monticello, New York
- 01 room
- 02 rooms
- 223 rooms
- 1344 rooms
- 1875 rooms
- 1476 rooms
- 657 rooms
- 768 rooms
- 1199+ rooms
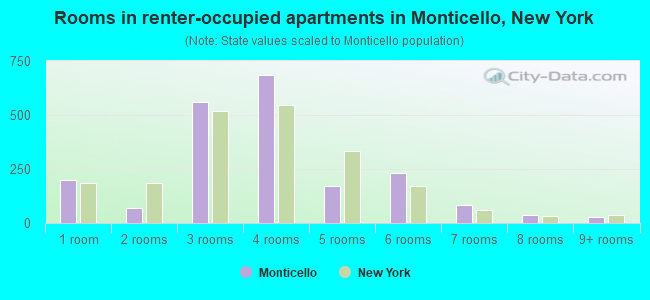
- Rooms in renter-occupied apartments in Monticello, New York
- 1991 room
- 692 rooms
- 5603 rooms
- 6864 rooms
- 1735 rooms
- 2306 rooms
- 847 rooms
- 388 rooms
- 269+ rooms
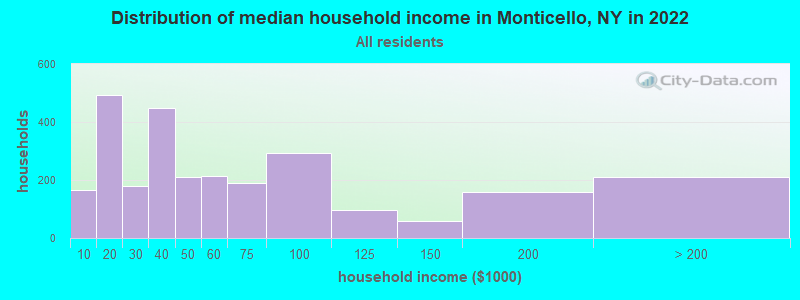
Monticello, NY household income distribution

- 165Less than $10,000
- 493$10,000 to $19,999
- 180$20,000 to $29,999
- 450$30,000 to $39,999
- 211$40,000 to $49,999
- 213$50,000 to $59,999
- 190$60,000 to $74,999
- 292$75,000 to $99,999
- 97$100,000 to $124,999
- 58$125,000 to $149,999
- 160$150,000 to $199,999
- 211$200,000 or more
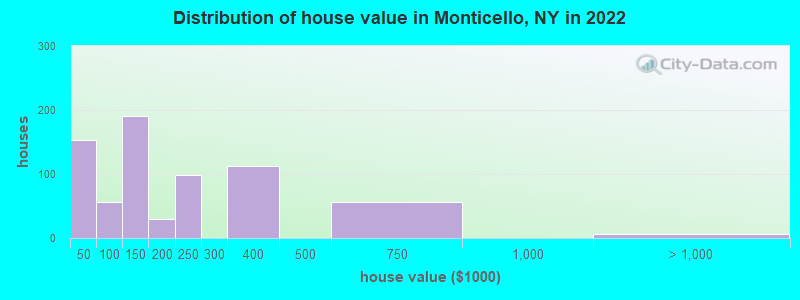
Home value of owner - occupied houses in 2022 in Monticello, NY
-
- 112Less than $10,000
- 29$20,000 to $24,999
- 10$30,000 to $34,999
- 49$50,000 to $59,999
- 5$60,000 to $69,999
- 43$100,000 to $124,999
- 147$125,000 to $149,999
- 19$150,000 to $174,999
- 10$175,000 to $199,999
- 98$200,000 to $249,999
- 112$300,000 to $399,999
- 57$500,000 to $749,999
- 6$1,000,000 to $1,499,999
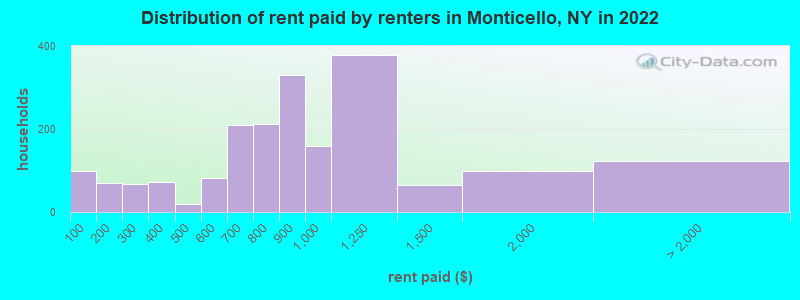
Rent paid by renters in 2022 in Monticello, NY
-
- 97Less than $100
- 69$150 to $199
- 14$200 to $249
- 51$250 to $299
- 43$300 to $349
- 28$350 to $399
- 18$450 to $499
- 82$550 to $599
- 141$600 to $649
- 67$650 to $699
- 63$700 to $749
- 149$750 to $799
- 329$800 to $899
- 157$900 to $999
- 378$1,000 to $1,249
- 65$1,250 to $1,499
- 100$1,500 to $1,999
- 33$2,000 to $2,499
- 63$3,500 or more
- 25No cash rent
Percentage of workers working in this county: 87.3%
Number of people working at home: 221 (6.6% of all workers)
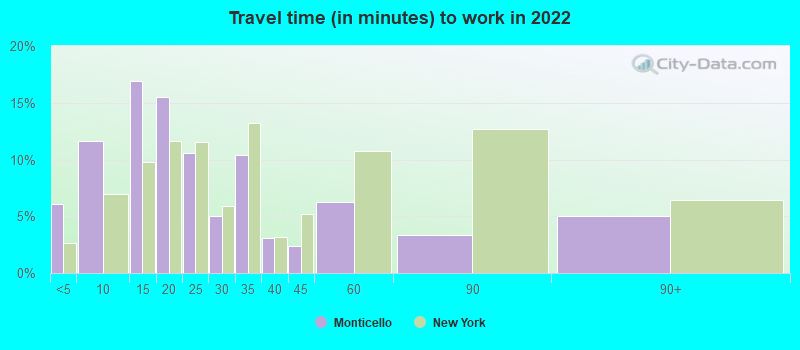
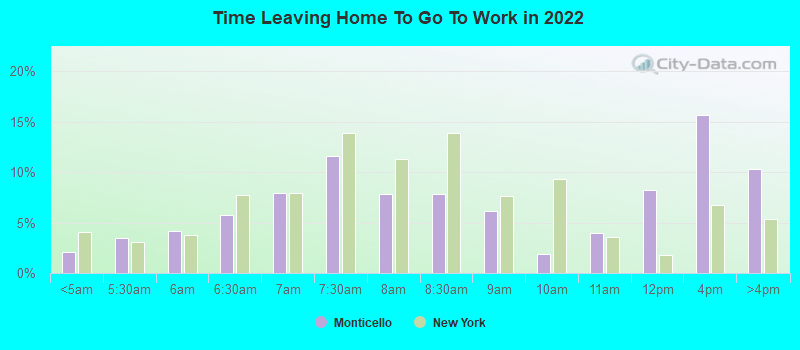
Travel time to work (commute)
- Less than 5 minutes: 507
- 5 to 9 minutes: 447
- 10 to 14 minutes: 865
- 15 to 19 minutes: 445
- 20 to 24 minutes: 189
- 25 to 29 minutes: 151
- 30 to 34 minutes: 199
- 35 to 39 minutes: 64
- 40 to 44 minutes: 0
- 45 to 59 minutes: 0
- 60 to 89 minutes: 183
- 90 or more minutes: 142
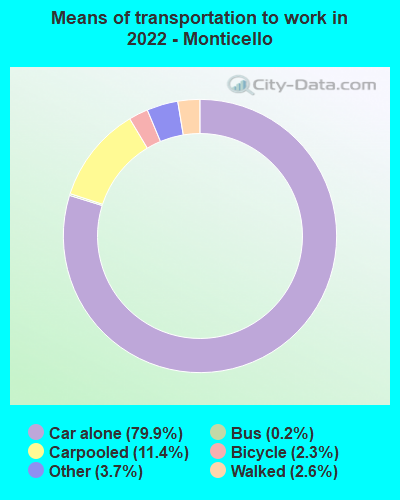
Means of transportation to work:
- Drove a car alone: 4,015 (75.2%)
- Carpooled: 608 (11.4%)
- Bus: 7 (0.1%)
- Subway or elevated rail: 2 (0.0%)
- Taxi: 226 (4.2%)
- Bicycle: 131 (2.5%)
- Walked: 129 (2.4%)
- Worked at home: 221 (4.1%)
- Unemployment by race in 2022
- Unemployment rate for White non-Hispanic residents
- 13.7%Females
- Unemployment rate for other race residents
- 27.6%Males
- Unemployment rate for two or more race residents
- 11.8%Males
- Unemployment rate for Hispanic or Latino residents
- 15.4%Males
- 8.9%Females
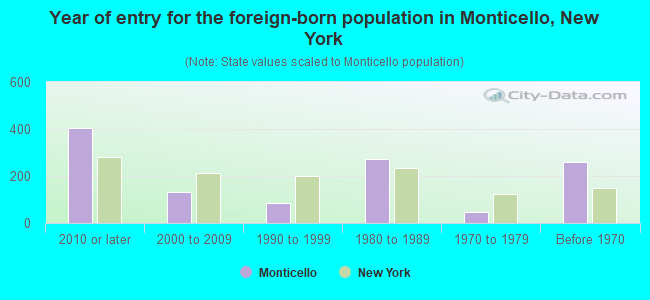
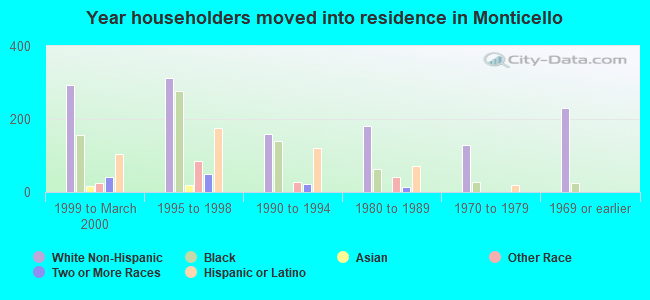
- Year of entry for the foreign-born population in Monticello, New York
- 4042010 or later
- 1332000 to 2009
- 841990 to 1999
- 2721980 to 1989
- 471970 to 1979
- 259Before 1970
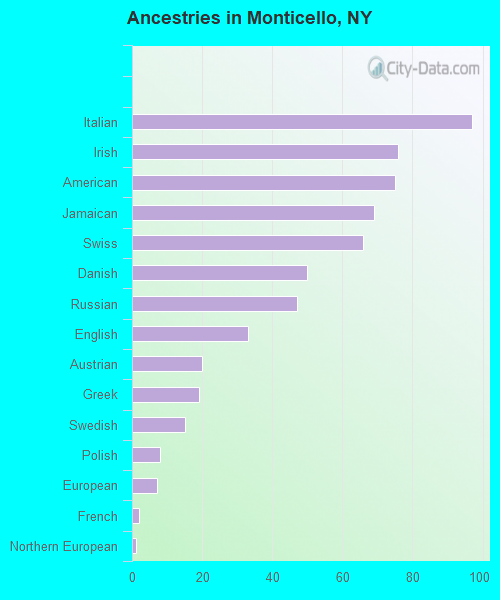
First ancestries reported:
- Italian: 97 (3.3%)
- Irish: 76 (2.6%)
- American: 75 (2.6%)
- Jamaican: 69 (2.4%)
- Swiss: 66 (2.3%)
- Danish: 50 (1.7%)
- Russian: 47 (1.6%)
- English: 33 (1.1%)
- Austrian: 20 (0.7%)
- Greek: 19 (0.7%)
- Swedish: 15 (0.5%)
- Polish: 8 (0.3%)
- European: 7 (0.2%)
- French: 2 (0.07%)
- Northern European: 1 (0.03%)
Most common places of birth for foreign-born residents (%):
| Monticello: | 29.2% (316) |
| New York: | 1.4% (61,245) |
| Monticello: | 16.5% (178) |
| New York: | 3.9% (177,448) |
| Monticello: | 9.9% (107) |
| New York: | 2.5% (111,920) |
| Monticello: | 8.7% (94) |
| New York: | 5.0% (227,557) |
| Monticello: | 8.0% (87) |
| New York: | 9.1% (410,910) |
| Monticello: | 6.0% (65) |
| New York: | 1.8% (81,374) |
| Monticello: | 5.0% (54) |
| New York: | 0.5% (22,582) |
| Monticello: | 4.2% (45) |
| New York: | 0.4% (18,080) |
| Monticello: | 2.9% (31) |
| New York: | 3.5% (158,432) |
| Monticello: | 2.4% (26) |
| New York: | 0.4% (16,179) |
| Monticello: | 2.0% (22) |
| New York: | 0.4% (17,363) |
| Monticello: | 2.0% (22) |
| New York: | 1.8% (82,786) |
Place of birth for U.S.-born residents:
- This state: 5,042
- Other state: 661
- Northeast: 229
- Midwest: 39
- South: 385
- West: 61
93.3% of Monticello residents lived in the same house 1 years ago.
Out of people who lived in different houses, 39.6% lived in this county.
Out of people who lived in different counties, 84.2% lived in New York.
| Monticello: | 93.3% |
| State average: | 89.6% |
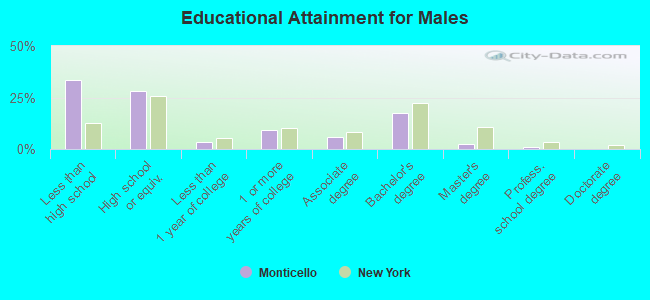
Education attainment for males 25 years and older:
- No schooling: 84
- Nursery to 4th grade: 173
- 5th and 6th grade: 2
- 7th and 8th grade: 17
- 9th grade: 102
- 10th grade: 139
- 11th grade: 111
- 12th grade, no diploma: 146
- High school graduate (or equivalency): 646
- Less than 1 year of college: 74
- Some college more than 1 year, no degree: 209
- Associate degree: 133
- Bachelor's degree: 402
- Master's degree: 53
- Professional school degree: 22
- Doctorate degree: 0
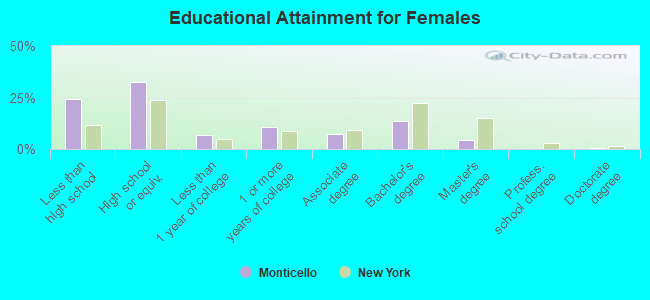
Education attainment for females 25 years and older:
- No schooling: 47
- Nursery to 4th grade: 0
- 5th and 6th grade: 17
- 7th and 8th grade: 126
- 9th grade: 107
- 10th grade: 74
- 11th grade: 188
- 12th grade, no diploma: 49
- High school graduate (or equivalency): 815
- Less than 1 year of college: 174
- Some college more than 1 year, no degree: 267
- Associate degree: 187
- Bachelor's degree: 337
- Master's degree: 104
- Professional school degree: 0
- Doctorate degree: 15
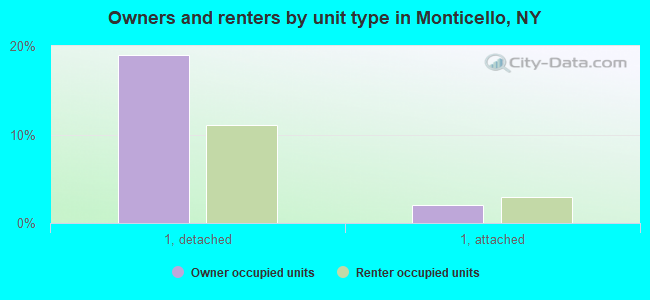
Housing units in structures:
- One, detached: 1,081
- One, attached: 161
- Two: 93
- 3 or 4: 318
- 5 to 9: 661
- 10 to 19: 121
- 20 to 49: 392
- 50 or more: 215
- Mobile homes: 144
Median worth of mobile homes: $11,698
Housing units lacking complete kitchen facilities in 2022: 7.7%
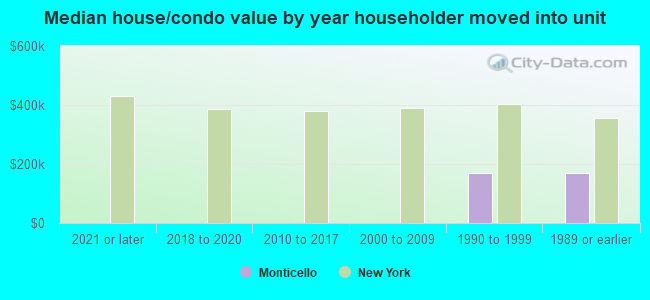
House/condo owner moved in on average 14 years ago
Renter moved in on average 3 years ago
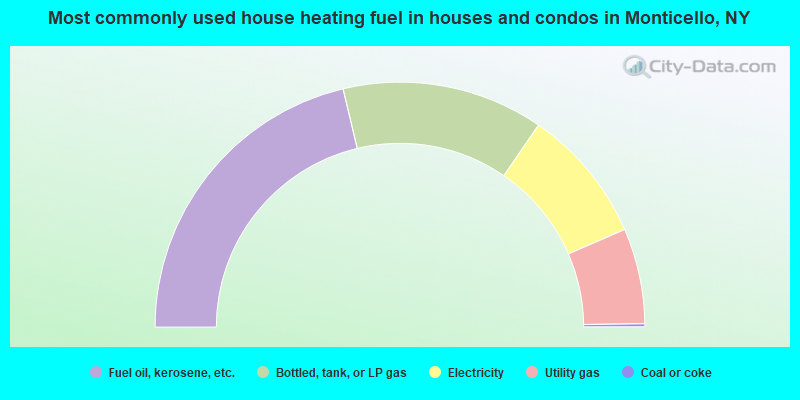
- 42.5%Fuel oil, kerosene, etc.
- 26.6%Bottled, tank, or LP gas
- 17.8%Electricity
- 12.6%Utility gas
- 0.4%Coal or coke
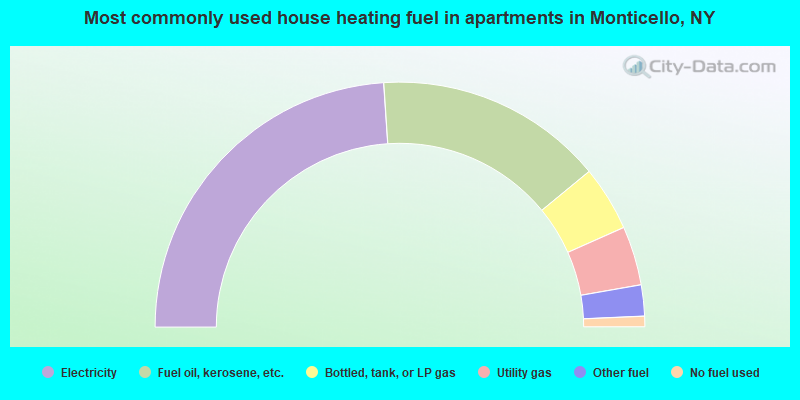
- 47.9%Electricity
- 30.2%Fuel oil, kerosene, etc.
- 8.6%Bottled, tank, or LP gas
- 7.8%Utility gas
- 4.1%Other fuel
- 1.4%No fuel used
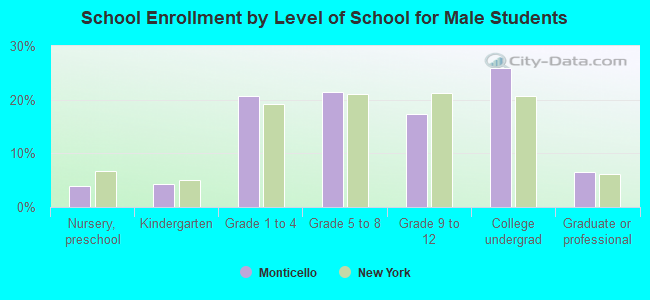
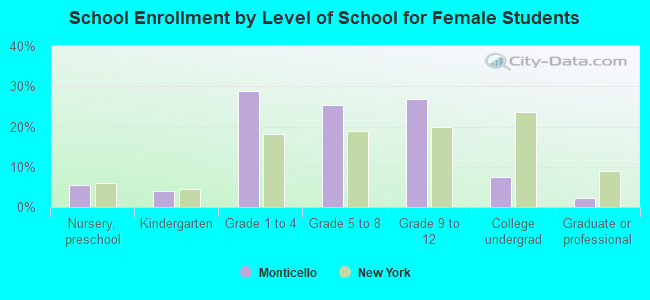
Private vs. public school enrollment:
| Here: | 0.0% |
| New York: | 15.6% |
| Here: | 2.1% |
| New York: | 15.0% |
| Here: | 25.4% |
| New York: | 39.2% |