Montrose, CO (Colorado) Houses and Residents
| Montrose: | $361,932 |
| Colorado: | $531,100 |
Total population: 19,045 (Urban population: 12,144 (all inside urban clusters), Rural population: 221 (all nonfarm))
Houses: 9,752 (8,754 occupied: 6,296 owner occupied, 2,548 renter occupied)
| % of renters here: | 29% |
| State: | 34% |
Housing density: 850 houses/condos per square mile
Median price asked for vacant for-sale houses and condos in 2022: $265,107.
Median contract rent in 2022: $915 (lower quartile is $523, upper quartile is $1,268)
Median rent asked for vacant for-rent units in 2022: $871
Median gross rent in Montrose, CO in 2022: $1,065
Housing units in Montrose with a mortgage: 3,422 (151 second mortgage, 25 home equity loan, 112 both second mortgage and home equity loan)
Houses without a mortgage: 0
Median household income for houses/condos with a mortgage: $80,652
Median household income for apartments without a mortgage: $55,252
Median monthly housing costs: $994
Compare current foreclosures in Montrose, CO:
| Photo | Address | Area | Beds / Baths | Price | Details |
|---|---|---|---|---|---|

|
#1
S Park Ave
Montrose, CO 81401
|
1,144 sq. feet
|
1 baths 3 beds |
show details | |

|
#2
Dover Rd
Montrose, CO 81401
|
- sq. feet
|
2 baths 3 beds |
show details | |

|
#3
Manchester Dr
Montrose, CO 81401
|
2,212 sq. feet
|
2 baths 4 beds |
show details | |

|
#4
Centennial Dr
Montrose, CO 81401
|
1,724 sq. feet
|
2 baths 3 beds |
show details | |

|
#5
Oxford St
Montrose, CO 81401
|
1,404 sq. feet
|
2 baths 4 beds |
show details | |

|
#6
6420 Rd
Montrose, CO 81403
|
1,419 sq. feet
|
2 baths 3 beds |
show details | |

|
#7
Alpine Rd
Montrose, CO 81403
|
1,520 sq. feet
|
1 baths 3 beds |
show details | |

|
#8
Poplar St
Montrose, CO 81401
|
2,212 sq. feet
|
2 baths 3 beds |
show details | |

|
#9
Miguel Rd
Montrose, CO 81401
|
1,296 sq. feet
|
2 baths 3 beds |
show details | |

|
#10
Alpine Rd
Montrose, CO 81403
|
1,520 sq. feet
|
1 baths 3 beds |
show details |
| Photo | Address | Area | Beds / Baths | Price | Details |
|---|---|---|---|---|---|

|
#11
Prospect Dr
Montrose, CO 81403
|
1,851 sq. feet
|
2 baths 3 beds |
show details | |

|
#12
Evergreen Ct
Montrose, CO 81403
|
1,200 sq. feet
|
2 baths 3 beds |
show details | |

|
#13
Kia Ln
Montrose, CO 81401
|
1,366 sq. feet
|
2 baths 3 beds |
show details | |

|
#14
Dover Rd
Montrose, CO 81401
|
779 sq. feet
|
1 baths - beds |
show details | |

|
#15
Highway 550
Montrose, CO 81403
|
1,446 sq. feet
|
3 baths - beds |
show details | |

|
#16
Kiowa Rd
Montrose, CO 81403
|
1,748 sq. feet
|
2 baths - beds |
show details | |

|
#17
L Rd
Montrose, CO 81403
|
1,352 sq. feet
|
1 baths - beds |
show details | |

|
#18
Manchester Dr
Montrose, CO 81401
|
2,212 sq. feet
|
3 baths - beds |
show details | |

|
#19
Market St
Montrose, CO 81401
|
- sq. feet
|
- baths - beds |
show details | |

|
#20
Canyon Ridge Rd
Montrose, CO 81403
|
- sq. feet
|
- baths - beds |
show details |
| Photo | Address | Area | Beds / Baths | Price | Details |
|---|---|---|---|---|---|

|
#21
S Highway 550
Montrose, CO 81403
|
- sq. feet
|
- baths - beds |
show details | |

|
#22
Highway 50 Trlr 13
Montrose, CO 81401
|
- sq. feet
|
- baths - beds |
show details | |

|
#23
N 6th St # 201
Montrose, CO 81401
|
- sq. feet
|
- baths - beds |
show details | |

|
#24
Locust Rd Trlr 103
Montrose, CO 81401
|
- sq. feet
|
- baths - beds |
show details | |

|
#25
S Nevada Ave
Montrose, CO 81401
|
- sq. feet
|
- baths - beds |
show details | |

|
#26
Encanto Pl Apt D2
Montrose, CO 81401
|
- sq. feet
|
- baths - beds |
show details | |

|
#27
Stover Ave
Montrose, CO 81401
|
- sq. feet
|
- baths - beds |
show details | |

|
#28
Highway 550
Montrose, CO 81403
|
- sq. feet
|
- baths - beds |
show details | |

|
#29
S 10th St
Montrose, CO 81401
|
- sq. feet
|
- baths - beds |
show details | |

|
#30
N 6th St # D308
Montrose, CO 81401
|
- sq. feet
|
- baths - beds |
show details |
| Photo | Address | Area | Beds / Baths | Price | Details |
|---|---|---|---|---|---|

|
#31
Orchard Rd
Montrose, CO 81403
|
- sq. feet
|
- baths - beds |
show details | |

|
#32
N Mesa Ave
Montrose, CO 81401
|
- sq. feet
|
- baths - beds |
show details | |

|
#33
Animas St
Montrose, CO 81401
|
- sq. feet
|
- baths - beds |
show details | |

|
#34
N Park Ave
Montrose, CO 81401
|
- sq. feet
|
- baths - beds |
show details | |

|
#35
Montrose Ct
Montrose, CO 81401
|
- sq. feet
|
- baths - beds |
show details | |

|
#36
Howard Fork Ave
Montrose, CO 81403
|
- sq. feet
|
- baths - beds |
show details | |

|
Check over 1 million property listings on Foreclosure.com!
|
browse all offers | |||

Latest news about housing in Montrose, CO collected exclusively by city-data.com from local newspapers, TV, and radio stations

 | Starter homes lack inventory in metro Denver (44 replies) |
| Manufactured/Modular Homes in Colorado (10 replies) |
| Where else in Colorado should we look? (Year round hiking, close to ski resort) (52 replies) |
| Another "Retire in CO" thread... (235 replies) |
| What is Montrose Like, Really (26 replies) |
| Colorado Front Range vs. Western Slope for Retirement (40 replies) |

Median year apartment built: 1987
Household type by relationship:
Households: 20,638- Male householders: 3,884 (1,050 living alone), Female householders: 4,666 (1,761 living alone)
4,257 spouses (4,149 opposite-sex spouses), 340 unmarried partners, (340 opposite-sex unmarried partners), 4,907 children (4,447 natural, 30 adopted, 429 stepchildren), 502 grandchildren, 341 brothers or sisters, 410 parents, 0 foster children, 187 other relatives, 718 non-relatives
- In group quarters: 421
Size of family households: 3,214 2-persons, 1,136 3-persons, 634 4-persons, 378 5-persons, 69 6-persons, 35 7-or-more-persons.
Size of nonfamily households: 2,954 1-person, 399 2-persons, 29 3-persons.
2,398 married couples with children.
1,012 single-parent households (402 men, 610 women).
84.4% of residents of Montrose speak English at home.
13.5% of residents speak Spanish at home (59% speak English very well, 16% speak English well, 21% speak English not well, 4% don't speak English at all).
2.8% of residents speak other Indo-European language at home (28% speak English very well, 44% speak English well, 19% speak English not well, 9% don't speak English at all).
0.3% of residents speak Asian or Pacific Island language at home (81% speak English very well, 19% speak English well).
Foreign born population: 1,566 (7.6%)
(41.0% of them are naturalized citizens)
| Here: | 5.9 |
| State: | 6.8 |
| Here: | 4.4 |
| State: | 4.0 |

- Bedrooms in owner-occupied houses and condos in Montrose, Colorado
- 0no bedroom
- 1811 bedroom
- 9632 bedrooms
- 3,6923 bedrooms
- 1,2334 bedrooms
- 2275+ bedrooms

- Bedrooms in renter-occupied apartments in Montrose, Colorado
- 253no bedroom
- 4621 bedroom
- 9572 bedrooms
- 7843 bedrooms
- 934 bedrooms
- 05+ bedrooms

- Cars and other vehicles available in Montrose in owner-occupied houses/condos
- 112no vehicle
- 1,7231 vehicle
- 2,9902 vehicles
- 1,0203 vehicles
- 3064 vehicles
- 1475+ vehicles

- Cars and other vehicles available in Montrose in renter-occupied apartments
- 241no vehicle
- 1,3291 vehicle
- 7452 vehicles
- 1923 vehicles
- 424 vehicles
- 05+ vehicles

- Rooms in owner-occupied houses in Montrose, Colorado
- 01 room
- 232 rooms
- 883 rooms
- 3854 rooms
- 1,7345 rooms
- 1,7216 rooms
- 8127 rooms
- 6948 rooms
- 8389+ rooms

- Rooms in renter-occupied apartments in Montrose, Colorado
- 2451 room
- 1212 rooms
- 3433 rooms
- 6034 rooms
- 6125 rooms
- 4806 rooms
- 1037 rooms
- 178 rooms
- 249+ rooms


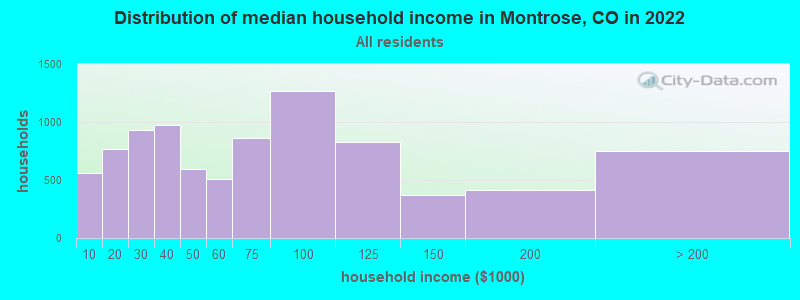
Montrose, CO household income distribution

- 563Less than $10,000
- 769$10,000 to $19,999
- 928$20,000 to $29,999
- 975$30,000 to $39,999
- 591$40,000 to $49,999
- 508$50,000 to $59,999
- 859$60,000 to $74,999
- 1,266$75,000 to $99,999
- 829$100,000 to $124,999
- 369$125,000 to $149,999
- 418$150,000 to $199,999
- 748$200,000 or more
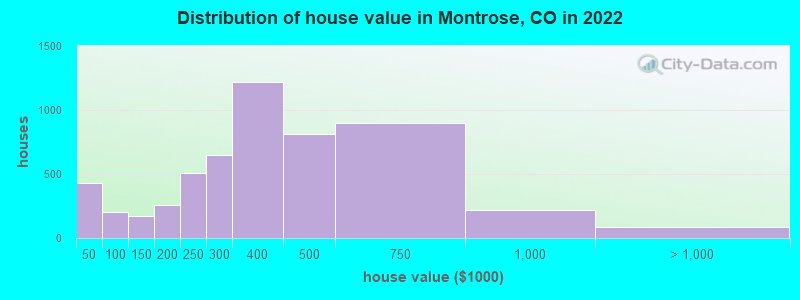
Home value of owner - occupied houses in 2022 in Montrose, CO
-
- 249Less than $10,000
- 12$10,000 to $14,999
- 12$15,000 to $19,999
- 29$20,000 to $24,999
- 10$25,000 to $29,999
- 21$30,000 to $34,999
- 25$35,000 to $39,999
- 67$40,000 to $49,999
- 42$50,000 to $59,999
- 9$70,000 to $79,999
- 37$80,000 to $89,999
- 46$90,000 to $99,999
- 126$100,000 to $124,999
- 48$125,000 to $149,999
- 141$150,000 to $174,999
- 117$175,000 to $199,999
- 507$200,000 to $249,999
- 644$250,000 to $299,999
- 1,219$300,000 to $399,999
- 812$400,000 to $499,999
- 902$500,000 to $749,999
- 221$750,000 to $999,999
- 7$1,000,000 to $1,499,999
- 80$2,000,000 or more
Rent paid by renters in 2022 in Montrose, CO
-
- 79$100 to $149
- 172$150 to $199
- 109$200 to $249
- 40$250 to $299
- 41$300 to $349
- 16$350 to $399
- 19$400 to $449
- 113$450 to $499
- 57$500 to $549
- 37$600 to $649
- 55$650 to $699
- 36$700 to $749
- 124$750 to $799
- 327$800 to $899
- 86$900 to $999
- 387$1,000 to $1,249
- 194$1,250 to $1,499
- 275$1,500 to $1,999
- 67$2,000 to $2,499
- 55$2,500 to $2,999
- 8$3,500 or more
- 176No cash rent


Percentage of workers working in this county: 91.7%
Number of people working at home: 1,263 (15.0% of all workers)
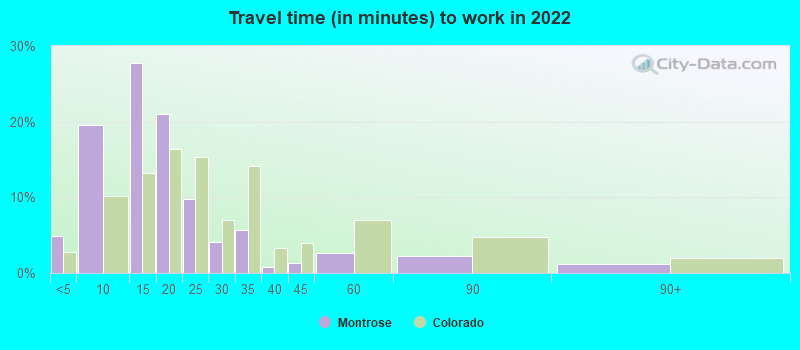
Travel time to work (commute)
- Less than 5 minutes: 510
- 5 to 9 minutes: 1,775
- 10 to 14 minutes: 2,205
- 15 to 19 minutes: 1,134
- 20 to 24 minutes: 384
- 25 to 29 minutes: 70
- 30 to 34 minutes: 226
- 35 to 39 minutes: 5
- 40 to 44 minutes: 31
- 45 to 59 minutes: 70
- 60 to 89 minutes: 432
- 90 or more minutes: 239

Means of transportation to work:
- Drove a car alone: 9,926 (75.3%)
- Carpooled: 1,020 (7.7%)
- Bus: 1 (0.0%)
- Taxi: 126 (1.0%)
- Bicycle: 107 (0.8%)
- Walked: 383 (2.9%)
- Worked at home: 1,263 (9.6%)

- Unemployment by race in 2022
- Unemployment rate for White non-Hispanic residents
- 2.2%Males
- 6.7%Females
- Unemployment rate for other race residents
- 28.8%Males
- Unemployment rate for Hispanic or Latino residents
- 7.5%Males

- Year of entry for the foreign-born population in Montrose, Colorado
- 3992010 or later
- 3292000 to 2009
- 3271990 to 1999
- 1281980 to 1989
- 1771970 to 1979
- 75Before 1970

First ancestries reported:
- English: 1,419 (14.5%)
- German: 1,029 (10.5%)
- Italian: 866 (8.8%)
- American: 776 (7.9%)
- Irish: 765 (7.8%)
- Polish: 284 (2.9%)
- European: 255 (2.6%)
- Scottish: 238 (2.4%)
- Norwegian: 187 (1.9%)
- French: 105 (1.1%)
- Dutch: 79 (0.8%)
- Swedish: 78 (0.8%)
- Welsh: 49 (0.5%)
- Armenian: 44 (0.4%)
- Scandinavian: 40 (0.4%)
- Russian: 39 (0.4%)
- Eastern European: 38 (0.4%)
- Czech: 34 (0.3%)
- Croatian: 32 (0.3%)
- French Canadian: 19 (0.2%)
- Portuguese: 16 (0.2%)
- Danish: 15 (0.2%)
- Scotch-Irish: 15 (0.2%)
- Greek: 14 (0.1%)
- Northern European: 14 (0.1%)
- Pennsylvania German: 12 (0.1%)
- African: 11 (0.1%)
- Ukrainian: 10 (0.1%)
- Finnish: 9 (0.09%)
- Serbian: 8 (0.08%)
- Australian: 7 (0.07%)
- British: 3 (0.03%)
Most common places of birth for foreign-born residents (%):
| Montrose: | 68.3% (1,069) |
| Colorado: | 38.3% (209,491) |
| Montrose: | 5.3% (83) |
| Colorado: | 2.3% (12,342) |
| Montrose: | 4.1% (64) |
| Colorado: | 0.4% (2,057) |
| Montrose: | 3.7% (58) |
| Colorado: | 0.7% (3,568) |
| Montrose: | 3.0% (47) |
| Colorado: | 1.4% (7,860) |
| Montrose: | 2.0% (31) |
| Colorado: | 0.3% (1,794) |
| Montrose: | 1.6% (25) |
| Colorado: | 0.9% (4,810) |
Place of birth for U.S.-born residents:
- This state: 8,987
- Other state: 9,817
- Northeast: 773
- Midwest: 3,687
- South: 2,192
- West: 3,147
88.8% of Montrose residents lived in the same house 1 years ago.
Out of people who lived in different houses, 32.3% lived in this county.
Out of people who lived in different counties, 77.5% lived in Colorado.
| Montrose: | 88.8% |
| State average: | 83.6% |
Education attainment for males 25 years and older:
- No schooling: 177
- Nursery to 4th grade: 0
- 5th and 6th grade: 106
- 7th and 8th grade: 14
- 9th grade: 22
- 10th grade: 111
- 11th grade: 39
- 12th grade, no diploma: 92
- High school graduate (or equivalency): 2,165
- Less than 1 year of college: 429
- Some college more than 1 year, no degree: 885
- Associate degree: 437
- Bachelor's degree: 1,669
- Master's degree: 533
- Professional school degree: 206
- Doctorate degree: 82

Education attainment for females 25 years and older:
- No schooling: 230
- Nursery to 4th grade: 75
- 5th and 6th grade: 32
- 7th and 8th grade: 115
- 9th grade: 22
- 10th grade: 162
- 11th grade: 146
- 12th grade, no diploma: 154
- High school graduate (or equivalency): 2,303
- Less than 1 year of college: 518
- Some college more than 1 year, no degree: 1,327
- Associate degree: 547
- Bachelor's degree: 1,658
- Master's degree: 644
- Professional school degree: 106
- Doctorate degree: 248


Housing units in structures:
- One, detached: 6,625
- One, attached: 458
- Two: 364
- 3 or 4: 497
- 5 to 9: 372
- 10 to 19: 105
- 20 to 49: 221
- 50 or more: 174
- Mobile homes: 923
- Boats, RVs, vans, etc.: 8
Median worth of mobile homes: $60,455
Housing units lacking complete kitchen facilities in 2022: 2.6%
House/condo owner moved in on average 8 years ago
Renter moved in on average 4 years ago

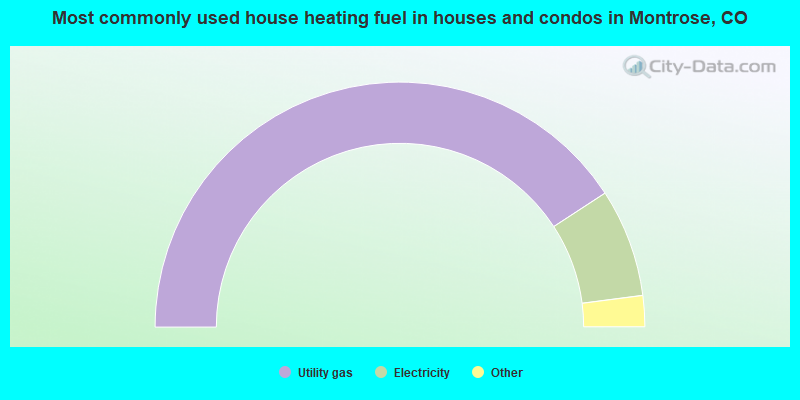
- 81.6%Utility gas
- 14.3%Electricity
- 2.0%Wood
- 1.1%Bottled, tank, or LP gas
- 0.5%No fuel used
- 0.4%Other fuel
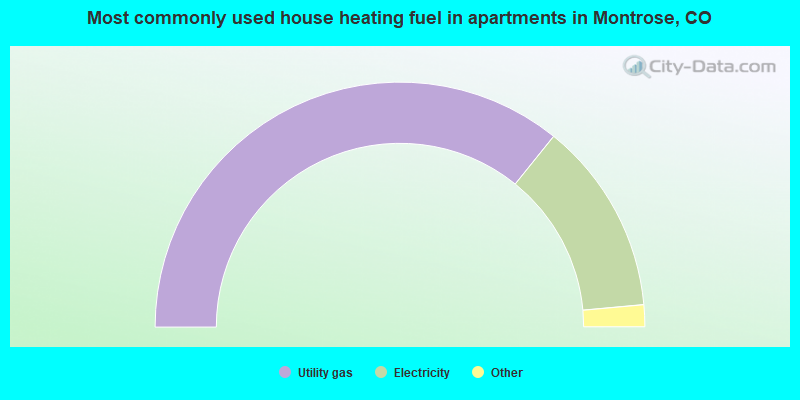
- 71.6%Utility gas
- 25.5%Electricity
- 1.8%Bottled, tank, or LP gas
- 1.1%Other fuel
Private vs. public school enrollment:
| Here: | 11.4% |
| Colorado: | 11.4% |
| Here: | 5.2% |
| Colorado: | 8.5% |
| Here: | 11.2% |
| Colorado: | 14.0% |


