Montverde, FL (Florida) Houses and Residents
| Montverde: | $494,797 |
| Florida: | $354,100 |
Mean price in 2022:
Detached houses: $551,129
Here: $551,129 State: $500,941 Mobile homes: $260,810
Here: $260,810 State: $113,202
Total population: 1,562 (Urban population: 0, Rural population: 894 (all nonfarm))
Houses: 708 (672 occupied: 577 owner occupied, 120 renter occupied)
| % of renters here: | 17% |
| State: | 33% |
Housing density: 451 houses/condos per square mile
Median price asked for vacant for-sale houses and condos in 2022 in this county: $155,595.
Median contract rent in 2022: $1,957 (lower quartile is $1,580, upper quartile is over $2,000)
Median rent asked for vacant for-rent units in 2022: $1,627
Median gross rent in Montverde, FL in 2022: over $2,000
Housing units in Montverde with a mortgage: 385 (18 second mortgage, 0 home equity loan, 9 both second mortgage and home equity loan)
Houses without a mortgage: 18
Median household income for houses/condos with a mortgage: $112,945
Median household income for apartments without a mortgage: $56,763
Median monthly housing costs: $1,400
Compare current foreclosures near Montverde, FL:
| Photo | Address | Area | Beds / Baths | Price | Details |
|---|---|---|---|---|---|

|
#1
Sugar Pine Way
Montverde, FL 34756
|
2,022 sq. feet
|
2 baths 3 beds |
show details | |

|
#2
Temple St
Montverde, FL 34756
|
1,296 sq. feet
|
2 baths - beds |
show details | |

|
#3
Pendio Dr
Montverde, FL 34756
|
- sq. feet
|
- baths - beds |
show details | |

|
#4
Ford St
Orlando, FL 32811
|
726 sq. feet
|
1 baths 2 beds |
$230,000
|
show details |

|
#5
Grand Regency Pointe Unit 104
Altamonte Springs, FL 32714
|
1,194 sq. feet
|
2 baths 3 beds |
$265,000
|
show details |

|
#6
Largovista Dr
Winter Garden, FL 34787
|
4,475 sq. feet
|
3 baths 5 beds |
$649,900
|
show details |

|
#7
Lake Catherine Cir
Groveland, FL 34736
|
2,590 sq. feet
|
2 baths 4 beds |
$309,900
|
show details |

|
#8
Sunshine Ln
Tavares, FL 32778
|
1,736 sq. feet
|
3 baths 3 beds |
$172,000
|
show details |

|
#9
E Highland Ave
Clermont, FL 34711
|
840 sq. feet
|
1 baths 3 beds |
$192,400
|
show details |

|
#10
Still Meadow Dr
Clermont, FL 34711
|
2,398 sq. feet
|
3 baths 4 beds |
show details |
| Photo | Address | Area | Beds / Baths | Price | Details |
|---|---|---|---|---|---|

|
#11
Fern Ave
Tavares, FL 32778
|
- sq. feet
|
2 baths 3 beds |
show details | |

|
#12
Shady Willow Dr
Orlando, FL 32808
|
1,460 sq. feet
|
2 baths 3 beds |
show details | |

|
#13
Roger Babson Rd
Orlando, FL 32808
|
1,501 sq. feet
|
1 baths 3 beds |
show details | |

|
#14
Kintla Rd
Apopka, FL 32712
|
2,599 sq. feet
|
2 baths 3 beds |
show details | |

|
#15
Eagle Ln
Winter Garden, FL 34787
|
1,260 sq. feet
|
2 baths 3 beds |
show details | |

|
#16
Pomona Dr
Apopka, FL 32712
|
1,112 sq. feet
|
2 baths 3 beds |
show details | |

|
#17
Gretchen Drive
Ocoee, FL 34761
|
1,675 sq. feet
|
2 baths 3 beds |
show details | |

|
#18
Seybold Ave
Orlando, FL 32808
|
989 sq. feet
|
1 baths 3 beds |
show details | |

|
#19
Cobble Ln
Mount Dora, FL 32757
|
1,362 sq. feet
|
2 baths 3 beds |
show details | |

|
#20
Barbados Loop
Clermont, FL 34711
|
2,191 sq. feet
|
2 baths 3 beds |
show details |
| Photo | Address | Area | Beds / Baths | Price | Details |
|---|---|---|---|---|---|

|
#21
Empire Ave
Orlando, FL 32810
|
1,612 sq. feet
|
1 baths 2 beds |
show details | |

|
#22
Casper Ln
Clermont, FL 34711
|
2,742 sq. feet
|
4 baths 4 beds |
show details | |

|
#23
Palio Ct
Ocoee, FL 34761
|
3,227 sq. feet
|
3 baths 4 beds |
show details | |

|
#24
Royal Fern Way
Astatula, FL 34705
|
1,296 sq. feet
|
2 baths 3 beds |
show details | |

|
#25
Biscayne Dr
Orlando, FL 32804
|
2,758 sq. feet
|
3 baths 4 beds |
show details | |

|
#26
Cabernet Cir
Ocoee, FL 34761
|
3,723 sq. feet
|
3 baths 4 beds |
show details | |

|
#27
Townhill Dr
Eustis, FL 32726
|
1,461 sq. feet
|
2 baths 2 beds |
show details | |

|
#28
Jayhil Dr
Clermont, FL 34715
|
2,008 sq. feet
|
2 baths 3 beds |
show details | |

|
#29
N Hastings St
Orlando, FL 32808
|
1,220 sq. feet
|
2 baths 3 beds |
show details | |

|
#30
Hamlin Ave
Howey In The Hills, FL 34737
|
1,849 sq. feet
|
2 baths 3 beds |
show details |
| Photo | Address | Area | Beds / Baths | Price | Details |
|---|---|---|---|---|---|

|
#31
Island Club Dr
Tavares, FL 32778
|
2,727 sq. feet
|
2 baths 3 beds |
show details | |

|
#32
Baptist Island Rd
Groveland, FL 34736
|
1,344 sq. feet
|
2 baths 3 beds |
show details | |

|
#33
Willow Wind Ct
Orlando, FL 32835
|
2,272 sq. feet
|
2 baths 4 beds |
show details | |

|
#34
Westmoreland Ave
Groveland, FL 34736
|
3,014 sq. feet
|
3 baths 3 beds |
show details | |

|
#35
Dovetail Ct
Apopka, FL 32703
|
1,206 sq. feet
|
2 baths 3 beds |
show details | |

|
#36
Green Ridge Dr
Apopka, FL 32703
|
960 sq. feet
|
1 baths 3 beds |
show details | |

|
#37
Cape Hatteras Dr
Clermont, FL 34714
|
3,744 sq. feet
|
3 baths 4 beds |
show details | |

|
#38
Votaw Rd
Apopka, FL 32703
|
1,620 sq. feet
|
2 baths 3 beds |
show details | |

|
#39
Long Grove Ct
Orlando, FL 32810
|
1,658 sq. feet
|
2 baths 4 beds |
show details | |

|
#40
Seabury Way
Orlando, FL 32818
|
1,191 sq. feet
|
2 baths 3 beds |
show details |
| Photo | Address | Area | Beds / Baths | Price | Details |
|---|---|---|---|---|---|

|
#41
Healy Dr
Orlando, FL 32818
|
1,872 sq. feet
|
1 baths 3 beds |
show details | |

|
#42
Lake Tiny Cir
Orlando, FL 32818
|
1,213 sq. feet
|
2 baths 3 beds |
show details | |

|
#43
Pine Needle Dr
Mascotte, FL 34753
|
1,435 sq. feet
|
2 baths 3 beds |
show details | |

|
#44
Livewood Oaks Dr
Orlando, FL 32818
|
1,415 sq. feet
|
2 baths 3 beds |
show details | |

|
#45
King Rail Ct
Orlando, FL 32810
|
1,919 sq. feet
|
2 baths 4 beds |
show details | |

|
#46
Summer Lakes Dr
Orlando, FL 32835
|
1,688 sq. feet
|
2 baths 3 beds |
show details | |

|
#47
Eden Dr
Apopka, FL 32703
|
1,600 sq. feet
|
2 baths 3 beds |
show details | |

|
#48
Bethesda St
Apopka, FL 32703
|
1,307 sq. feet
|
1 baths 4 beds |
show details | |

|
#49
Ambassador Dr
Orlando, FL 32818
|
1,354 sq. feet
|
2 baths 3 beds |
show details | |

|
Check over 1 million property listings on Foreclosure.com!
|
browse all offers | |||

Latest news about housing in Montverde, FL collected exclusively by city-data.com from local newspapers, TV, and radio stations

 | buying land fot a tiny house (2 replies) |
| Lake Nona or Bella Collina (13 replies) |
| Windermere/Isleworth or Bella Collina (26 replies) |
| School Options from Lake Nona? (Public or Private) (8 replies) |
| Give it to me straight - Minneola Public Schools (5 replies) |
| Ocala, Clermont, Mount Dora, or Minneola.... (5 replies) |

Median year apartment built: 1991
Household type by relationship:
Households: 1,889- Male householders: 331 (64 living alone), Female householders: 347 (73 living alone)
469 spouses (469 opposite-sex spouses), 31 unmarried partners, (31 opposite-sex unmarried partners), 540 children (508 natural, 6 adopted, 25 stepchildren), 69 grandchildren, 3 brothers or sisters, 32 parents, 0 foster children, 39 other relatives, 22 non-relatives
Size of family households: 220 2-persons, 149 3-persons, 79 4-persons, 48 5-persons, 9 6-persons, 15 7-or-more-persons.
Size of nonfamily households: 143 1-person, 26 2-persons.
256 married couples with children.
72 single-parent households (15 men, 57 women).
92.7% of residents of Montverde speak English at home.
5.7% of residents speak Spanish at home (91% speak English very well, 2% speak English well, 7% speak English not well).
0.9% of residents speak other Indo-European language at home (100% speak English very well).
Foreign born population: 151 (8.0%)
(57.6% of them are naturalized citizens)
| Here: | 7.0 |
| State: | 5.9 |
| Here: | 5.9 |
| State: | 4.2 |

- Bedrooms in owner-occupied houses and condos in Montverde, Florida
- 0no bedroom
- 111 bedroom
- 132 bedrooms
- 3103 bedrooms
- 2154 bedrooms
- 285+ bedrooms

- Bedrooms in renter-occupied apartments in Montverde, Florida
- 0no bedroom
- 171 bedroom
- 132 bedrooms
- 633 bedrooms
- 244 bedrooms
- 35+ bedrooms

- Cars and other vehicles available in Montverde in owner-occupied houses/condos
- 0no vehicle
- 1331 vehicle
- 2442 vehicles
- 913 vehicles
- 984 vehicles
- 115+ vehicles

- Cars and other vehicles available in Montverde in renter-occupied apartments
- 0no vehicle
- 491 vehicle
- 632 vehicles
- 93 vehicles
- 04 vehicles
- 05+ vehicles

- Rooms in owner-occupied houses in Montverde, Florida
- 01 room
- 02 rooms
- 213 rooms
- 144 rooms
- 995 rooms
- 1116 rooms
- 947 rooms
- 868 rooms
- 1529+ rooms

- Rooms in renter-occupied apartments in Montverde, Florida
- 01 room
- 132 rooms
- 43 rooms
- 104 rooms
- 35 rooms
- 446 rooms
- 237 rooms
- 178 rooms
- 79+ rooms


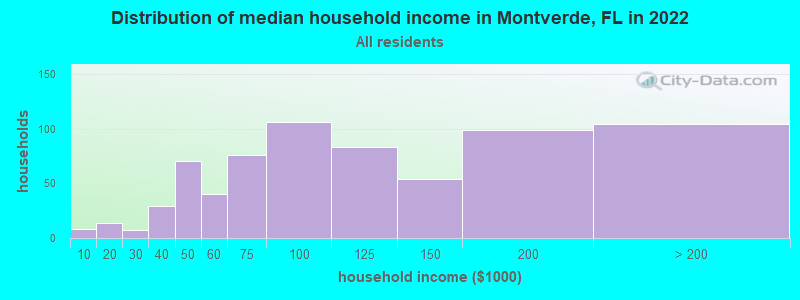
Montverde, FL household income distribution

- 8Less than $10,000
- 14$10,000 to $19,999
- 7$20,000 to $29,999
- 29$30,000 to $39,999
- 70$40,000 to $49,999
- 40$50,000 to $59,999
- 76$60,000 to $74,999
- 106$75,000 to $99,999
- 83$100,000 to $124,999
- 54$125,000 to $149,999
- 99$150,000 to $199,999
- 104$200,000 or more
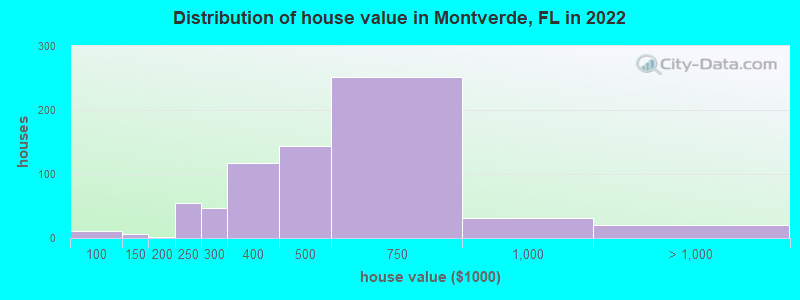
Home value of owner - occupied houses in 2022 in Montverde, FL
-
- 10$80,000 to $89,999
- 5$125,000 to $149,999
- 2$150,000 to $174,999
- 54$200,000 to $249,999
- 47$250,000 to $299,999
- 116$300,000 to $399,999
- 144$400,000 to $499,999
- 252$500,000 to $749,999
- 31$750,000 to $999,999
- 16$1,000,000 to $1,499,999
- 3$2,000,000 or more
Rent paid by renters in 2022 in Montverde, FL
-
- 2$900 to $999
- 4$1,000 to $1,249
- 32$1,500 to $1,999
- 4$2,500 to $2,999
- 8$3,000 to $3,499
- 48No cash rent


Percentage of workers working in this county: 50.4%
Number of people working at home: 289 (30.2% of all workers)
Travel time to work (commute)
- Less than 5 minutes: 87
- 5 to 9 minutes: 33
- 10 to 14 minutes: 20
- 15 to 19 minutes: 63
- 20 to 24 minutes: 63
- 25 to 29 minutes: 33
- 30 to 34 minutes: 102
- 35 to 39 minutes: 81
- 40 to 44 minutes: 36
- 45 to 59 minutes: 128
- 60 to 89 minutes: 64
- 90 or more minutes: 12
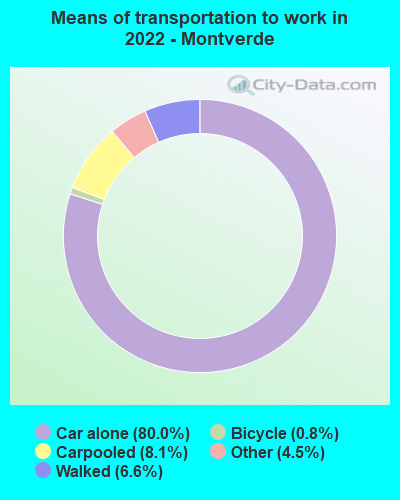
Means of transportation to work:
- Drove a car alone: 468 (56.2%)
- Carpooled: 50 (6.0%)
- Taxi: 29 (3.5%)
- Bicycle: 4 (0.5%)
- Walked: 41 (4.9%)
- Worked at home: 289 (34.7%)

- Unemployment by race in 2022
- Unemployment rate for White non-Hispanic residents
- 1.5%Males
- 2.4%Females

- Year of entry for the foreign-born population in Montverde, Florida
- 112010 or later
- 162000 to 2009
- 841990 to 1999
- 101980 to 1989
- 121970 to 1979
- 2Before 1970

First ancestries reported:
- American: 433 (43.8%)
- English: 98 (9.9%)
- German: 60 (6.1%)
- Irish: 44 (4.4%)
- Italian: 44 (4.4%)
- Polish: 20 (2.0%)
- European: 15 (1.5%)
- African: 12 (1.2%)
- Guyanese: 8 (0.8%)
- Scandinavian: 6 (0.6%)
- Swedish: 6 (0.6%)
- Romanian: 5 (0.5%)
- Scottish: 5 (0.5%)
- West Indian: 4 (0.4%)
- British: 3 (0.3%)
- Norwegian: 3 (0.3%)
- Jamaican: 2 (0.2%)
Most common places of birth for foreign-born residents (%):
| Montverde: | 16.0% (26) |
| Florida: | 0.1% (2,578) |
| Montverde: | 13.6% (22) |
| Florida: | 5.7% (262,042) |
| Montverde: | 9.9% (16) |
| Florida: | 0.7% (34,227) |
| Montverde: | 9.9% (16) |
| Florida: | 1.3% (57,263) |
| Montverde: | 6.8% (11) |
| Florida: | 2.7% (122,906) |
| Montverde: | 6.8% (11) |
| Florida: | 0.7% (33,556) |
| Montverde: | 5.6% (9) |
| Florida: | 6.5% (298,669) |
| Montverde: | 4.3% (7) |
| Florida: | 1.2% (54,272) |
| Montverde: | 4.3% (7) |
| Florida: | 5.0% (227,319) |
| Montverde: | 3.7% (6) |
| Florida: | 0.4% (20,008) |
| Montverde: | 3.1% (5) |
| Florida: | 1.2% (54,585) |
| Montverde: | 1.9% (3) |
| Florida: | 0.3% (15,079) |
Place of birth for U.S.-born residents:
- This state: 890
- Other state: 831
- Northeast: 227
- Midwest: 299
- South: 227
- West: 68
96.7% of Montverde residents lived in the same house 1 years ago.
Out of people who lived in different houses, 36.7% lived in this county.
Out of people who lived in different counties, 87.1% lived in Florida.
| Montverde: | 96.7% |
| State average: | 86.3% |
Education attainment for males 25 years and older:
- No schooling: 0
- Nursery to 4th grade: 0
- 5th and 6th grade: 0
- 7th and 8th grade: 6
- 9th grade: 3
- 10th grade: 25
- 11th grade: 8
- 12th grade, no diploma: 7
- High school graduate (or equivalency): 95
- Less than 1 year of college: 82
- Some college more than 1 year, no degree: 84
- Associate degree: 88
- Bachelor's degree: 108
- Master's degree: 89
- Professional school degree: 14
- Doctorate degree: 22

Education attainment for females 25 years and older:
- No schooling: 0
- Nursery to 4th grade: 0
- 5th and 6th grade: 3
- 7th and 8th grade: 11
- 9th grade: 1
- 10th grade: 2
- 11th grade: 0
- 12th grade, no diploma: 18
- High school graduate (or equivalency): 150
- Less than 1 year of college: 64
- Some college more than 1 year, no degree: 97
- Associate degree: 132
- Bachelor's degree: 166
- Master's degree: 77
- Professional school degree: 11
- Doctorate degree: 4


Housing units in structures:
- One, detached: 663
- Two: 18
- Mobile homes: 25
House/condo owner moved in on average 11 years ago
Renter moved in on average 1 years ago

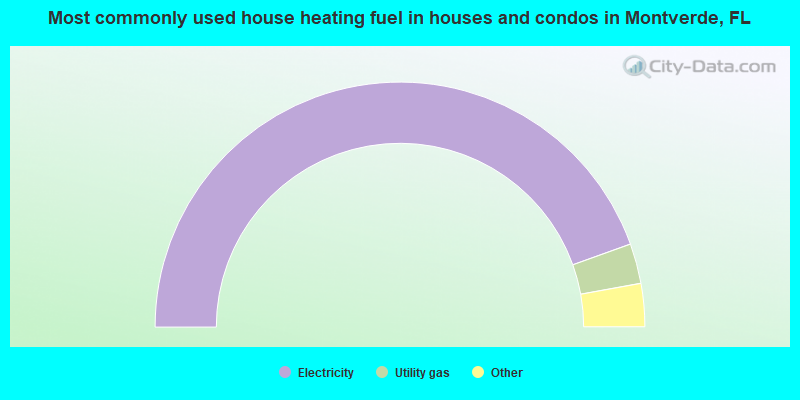
- 89.2%Electricity
- 5.3%Utility gas
- 3.0%Solar energy
- 2.5%No fuel used
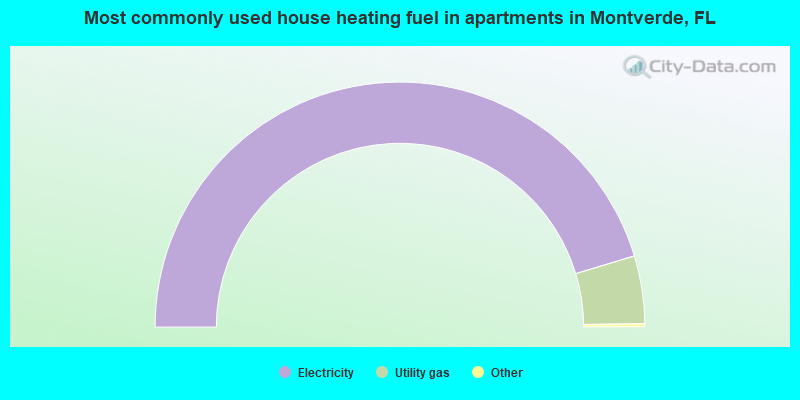
- 91.0%Electricity
- 9.0%Utility gas
Private vs. public school enrollment:
| Here: | 24.5% |
| Florida: | 15.8% |
| Here: | 8.6% |
| Florida: | 12.9% |
| Here: | 0.0% |
| Florida: | 23.6% |


