Jump to a detailed profile or search site with Google Custom Search

Moorpark, CA (California) Houses and Residents

Estimated median house or condo value in 2022: $886,439 (it was $273,300 in 2000)
Moorpark:

$886,439
California:

$715,900
Lower value quartile - upper value quartile: $652,572 - $1,004,568

Mean price in 2022:

Detached houses: $1,016,320
Here:

$1,016,320
State:

$988,808

Townhouses or other attached units: $591,868
Here:

$591,868
State:

$838,546

In 2-unit structures: $721,936
Here:

$721,936
State:

$1,138,100

In 3-to-4-unit structures: $534,640
Here:

$534,640
State:

$824,253

In 5-or-more-unit structures: $398,214
Here:

$398,214
State:

$730,996

Mobile homes: $244,784
Here:

$244,784
State:

$184,506

Total population: 35,550 (Urban population: 30,659, Rural population: 615 (33 farm, 582 nonfarm))

Houses: 11,775 (11,369 occupied: 9,041 owner occupied, 2,348 renter occupied)

% of renters here:

21%
State:

44%

Housing density: 619 houses/condos per square mile

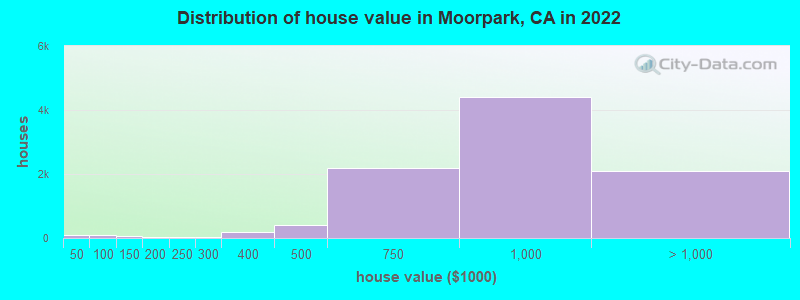
Median price asked for vacant for-sale houses and condos in 2022: $3,074,509.

Median contract rent in 2022: over $2,000 (lower quartile is $1,816, upper quartile is over $2,000)


Median rent asked for vacant for-rent units in 2022: $2,023


Median gross rent in Moorpark, CA in 2022: over $2,000

Housing units in Moorpark with a mortgage: 7,302 (743 second mortgage, 38 home equity loan, 548 both second mortgage and home equity loan)
Houses without a mortgage: 151

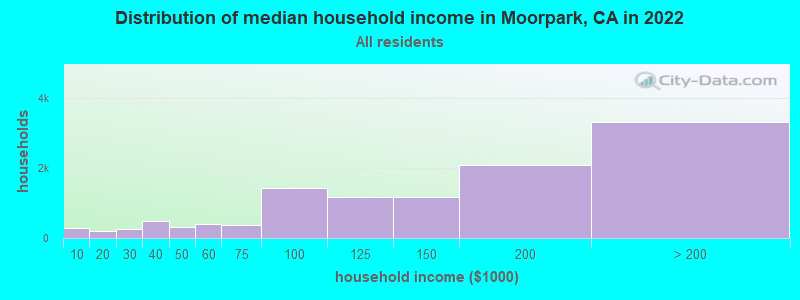
Median household income for houses/condos with a mortgage: $166,986

Median household income for apartments without a mortgage: $123,338

Median monthly housing costs: $2,551

Compare current foreclosures near Moorpark, CA:

Check out more offers near Moorpark, CA.
Powered by Foreclosure.com

Settings
X
Data:
Loading data...
Based on 2000-2022 data
Loading data...

123
Hide US histogram

Latest news about housing in Moorpark, CA collected exclusively by city-data.com from local newspapers, TV, and radio stations

Moorpark, California Age and Sex of Residents
Median year house/condo built: 1987

Median year apartment built: 1989

Household type by relationship:

Households: 35,670
  • Male householders: 6,546 (642 living alone), Female householders: 4,596 (979 living alone)
  • 7,449 spouses (7,435 opposite-sex spouses), 595 unmarried partners, (583 opposite-sex unmarried partners), 12,631 children (11,783 natural, 233 adopted, 614 stepchildren), 891 grandchildren, 409 brothers or sisters, 802 parents, 0 foster children, 986 other relatives, 757 non-relatives
  • In group quarters: 2

Size of family households: 2,737 2-persons, 2,738 3-persons, 2,125 4-persons, 809 5-persons, 457 6-persons, 325 7-or-more-persons.

Size of nonfamily households: 1,642 1-person, 426 2-persons, 135 3-persons, 7 4-persons.

5,759 married couples with children.
1,240 single-parent households (686 men, 554 women).

69.6% of residents of Moorpark speak English at home.
20.8% of residents speak Spanish at home (59% speak English very well, 17% speak English well, 13% speak English not well, 10% don't speak English at all).
4.2% of residents speak other Indo-European language at home (78% speak English very well, 19% speak English well, 3% speak English not well).
3.5% of residents speak Asian or Pacific Island language at home (80% speak English very well, 9% speak English well, 11% speak English not well).
1.4% of residents speak other language at home (59% speak English very well, 41% speak English well).

Foreign born population: 6,399 (17.9%)
(62.9% of them are naturalized citizens)

Median number of rooms in houses and condos:
Here:

7.0
State:

6.0

Median number of rooms in apartments
Here:

4.7
State:

3.9

Owner-occupied Renter-occupied
Bedrooms in owner-occupied houses and condos in Moorpark, California
  • Bedrooms in owner-occupied houses and condos in Moorpark, California
  • 10no bedroom
  • 841 bedroom
  • 8582 bedrooms
  • 2,8833 bedrooms
  • 3,8894 bedrooms
  • 1,3185+ bedrooms
Bedrooms in renter-occupied apartments in Moorpark, California
  • Bedrooms in renter-occupied apartments in Moorpark, California
  • 20no bedroom
  • 4271 bedroom
  • 6252 bedrooms
  • 8203 bedrooms
  • 3854 bedrooms
  • 725+ bedrooms
Owner-occupied Renter-occupied
Cars and other vehicles available in Moorpark in owner-occupied houses/condos
  • Cars and other vehicles available in Moorpark in owner-occupied houses/condos
  • 143no vehicle
  • 1,1901 vehicle
  • 3,9612 vehicles
  • 2,2143 vehicles
  • 9234 vehicles
  • 6125+ vehicles
Cars and other vehicles available in Moorpark in renter-occupied apartments
  • Cars and other vehicles available in Moorpark in renter-occupied apartments
  • 92no vehicle
  • 8351 vehicle
  • 7552 vehicles
  • 4253 vehicles
  • 1824 vehicles
  • 605+ vehicles
Owner-occupied Renter-occupied
Rooms in owner-occupied houses in Moorpark, California
  • Rooms in owner-occupied houses in Moorpark, California
  • 01 room
  • 732 rooms
  • 893 rooms
  • 6604 rooms
  • 9505 rooms
  • 1,8656 rooms
  • 1,8347 rooms
  • 1,5978 rooms
  • 1,9749+ rooms
Rooms in renter-occupied apartments in Moorpark, California
  • Rooms in renter-occupied apartments in Moorpark, California
  • 201 room
  • 1172 rooms
  • 2223 rooms
  • 6654 rooms
  • 3775 rooms
  • 4126 rooms
  • 1387 rooms
  • 2788 rooms
  • 1179+ rooms
Year house built
Median 2022 house/condo value by year built
Median house/condo value by year householder moved into unit
Breakdown of mean house values by ages of householders
Owners and renters by unit type in Moorpark, CA
  • Moorpark, CA household income distribution

  • Distribution of median household income in Moorpark, CA in 2022
  • 279Less than $10,000
  • 192$10,000 to $19,999
  • 248$20,000 to $29,999
  • 471$30,000 to $39,999
  • 301$40,000 to $49,999
  • 392$50,000 to $59,999
  • 376$60,000 to $74,999
  • 1,439$75,000 to $99,999
  • 1,178$100,000 to $124,999
  • 1,160$125,000 to $149,999
  • 2,085$150,000 to $199,999
  • 3,309$200,000 or more
  • Home value of owner - occupied houses in 2022 in Moorpark, CA

  • Distribution of house value in Moorpark, CA in 2022
  • 56Less than $10,000
  • 7$15,000 to $19,999
  • 30$35,000 to $39,999
  • 47$70,000 to $79,999
  • 35$90,000 to $99,999
  • 29$100,000 to $124,999
  • 25$125,000 to $149,999
  • 18$175,000 to $199,999
  • 45$200,000 to $249,999
  • 25$250,000 to $299,999
  • 200$300,000 to $399,999
  • 397$400,000 to $499,999
  • 2,200$500,000 to $749,999
  • 4,420$750,000 to $999,999
  • 1,574$1,000,000 to $1,499,999
  • 256$1,500,000 to $1,999,999
  • 273$2,000,000 or more
  • Rent paid by renters in 2022 in Moorpark, CA

  • Distribution of rent paid by renters in Moorpark, CA in 2022
  • 32Less than $100
  • 16$250 to $299
  • 8$300 to $349
  • 13$600 to $649
  • 48$750 to $799
  • 5$800 to $899
  • 20$900 to $999
  • 74$1,000 to $1,249
  • 126$1,250 to $1,499
  • 267$1,500 to $1,999
  • 750$2,000 to $2,499
  • 262$2,500 to $2,999
  • 299$3,000 to $3,499
  • 209$3,500 or more
  • 104No cash rent
Time Leaving Home To Go To Work in 2022

Percentage of workers working in this county: 78.3%
Number of people working at home: 3,588 (19.7% of all workers)

Travel time (in minutes) to work in 2022

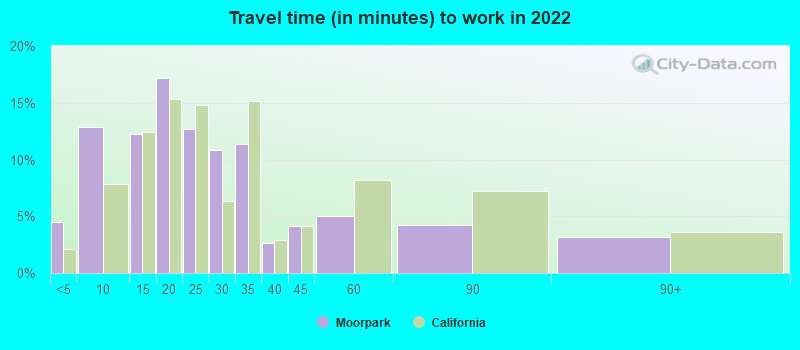
Travel time to work (commute)

  • Less than 5 minutes: 539
  • 5 to 9 minutes: 1,175
  • 10 to 14 minutes: 1,900
  • 15 to 19 minutes: 2,260
  • 20 to 24 minutes: 2,283
  • 25 to 29 minutes: 978
  • 30 to 34 minutes: 2,041
  • 35 to 39 minutes: 502
  • 40 to 44 minutes: 792
  • 45 to 59 minutes: 1,225
  • 60 to 89 minutes: 858
  • 90 or more minutes: 413
Means of transportation to work in 2022 - Moorpark

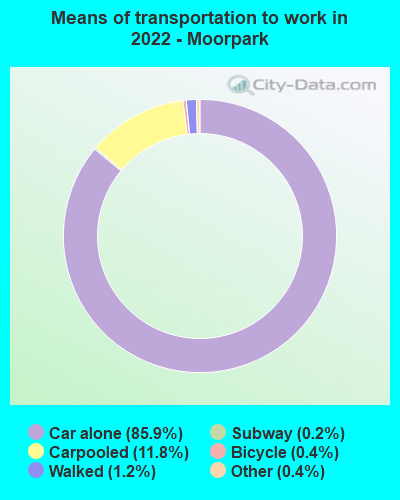
Means of transportation to work:

  • Drove a car alone: 8,438 (63.1%)
  • Carpooled: 1,372 (10.3%)
  • Long-distance train or commuter rail: 15 (0.1%)
  • Taxi: 53 (0.4%)
  • Bicycle: 47 (0.4%)
  • Walked: 129 (1.0%)
  • Worked at home: 3,588 (26.8%)
Class of Workers in 2022
  • Unemployment by race in 2022
  • Unemployment rate for White non-Hispanic residents
  • 4.5%Males
  • 3.2%Females
  • Unemployment rate for Black residents
  • 15.7%Males
  • Unemployment rate for American Indian and Alaska Native residents
  • 8.2%Males
  • 6.4%Females
  • Unemployment rate for Asian residents
  • 0.2%Males
  • 2.2%Females
  • Unemployment rate for other race residents
  • 8.6%Males
  • 3.4%Females
  • Unemployment rate for two or more race residents
  • 2.1%Males
  • 4.6%Females
  • Unemployment rate for Hispanic or Latino residents
  • 3.8%Males
  • 5.0%Females
Year of entry for the foreign-born population in Moorpark, California
  • Year of entry for the foreign-born population in Moorpark, California
  • 5922010 or later
  • 1,2052000 to 2009
  • 1,3951990 to 1999
  • 1,6981980 to 1989
  • 1,2861970 to 1979
  • 978Before 1970
Ancestries in Moorpark, CA

First ancestries reported:

  • German: 1,107 (6.1%)
  • Italian: 1,001 (5.5%)
  • Irish: 684 (3.7%)
  • European: 668 (3.7%)
  • English: 621 (3.4%)
  • American: 582 (3.2%)
  • Danish: 210 (1.1%)
  • Polish: 203 (1.1%)
  • Swedish: 183 (1.0%)
  • Egyptian: 180 (1.0%)
  • Eastern European: 167 (0.9%)
  • Norwegian: 141 (0.8%)
  • Russian: 121 (0.7%)
  • Belgian: 118 (0.6%)
  • Scandinavian: 115 (0.6%)
  • Iranian: 108 (0.6%)
  • Hungarian: 82 (0.4%)
  • French: 79 (0.4%)
  • Scottish: 72 (0.4%)
  • Armenian: 72 (0.4%)
  • Scotch-Irish: 64 (0.3%)
  • Ukrainian: 54 (0.3%)
  • Dutch: 47 (0.3%)
  • Canadian: 46 (0.3%)
  • African: 42 (0.2%)
  • Romanian: 41 (0.2%)
  • Arab: 41 (0.2%)
  • French Canadian: 34 (0.2%)
  • Slovak: 30 (0.2%)
  • Northern European: 30 (0.2%)
  • Portuguese: 24 (0.1%)
  • Turkish: 22 (0.1%)
  • Greek: 22 (0.1%)
  • Serbian: 20 (0.1%)
  • Brazilian: 18 (0.10%)
  • Welsh: 15 (0.08%)
  • British: 14 (0.08%)
  • Czech: 12 (0.07%)
  • Australian: 10 (0.05%)
  • Nigerian: 9 (0.05%)
  • Lebanese: 8 (0.04%)
  • Slavic: 7 (0.04%)
  • Lithuanian: 6 (0.03%)
  • Czechoslovakian: 5 (0.03%)
  • Swiss: 4 (0.02%)
  • Finnish: 3 (0.02%)
  • Austrian: 3 (0.02%)

Most common places of birth for foreign-born residents (%):

Mexico
Moorpark:

46.0% (2,833)
California:

37.2% (3,881,193)

Philippines
Moorpark:

7.6% (469)
California:

7.8% (818,297)

India
Moorpark:

5.1% (316)
California:

5.2% (539,184)

Vietnam
Moorpark:

4.2% (260)
California:

4.9% (512,335)

Canada
Moorpark:

2.8% (170)
California:

1.2% (127,477)

Korea
Moorpark:

2.2% (133)
California:

3.0% (315,248)

Iran
Moorpark:

2.1% (129)
California:

2.0% (206,004)

Ivory Coast
Moorpark:

2.0% (126)
California:

0.0% (1,318)

Egypt
Moorpark:

2.0% (125)
California:

0.4% (42,718)

Poland
Moorpark:

1.6% (96)
California:

0.2% (20,997)

Belgium
Moorpark:

1.6% (96)
California:

0.1% (6,176)

Place of birth for U.S.-born residents:

  • This state: 22,260
  • Other state: 6,570
  • Northeast: 1,660
  • Midwest: 2,157
  • South: 1,317
  • West: 1,437

93.1% of Moorpark residents lived in the same house 1 years ago.
   Out of people who lived in different houses, 43.0% lived in this county.
   Out of people who lived in different counties, 92.6% lived in California.


Moorpark:

93.1%
State average:

88.9%

Education attainment for males 25 years and older:

  • No schooling: 240
  • Nursery to 4th grade: 91
  • 5th and 6th grade: 224
  • 7th and 8th grade: 45
  • 9th grade: 176
  • 10th grade: 0
  • 11th grade: 165
  • 12th grade, no diploma: 154
  • High school graduate (or equivalency): 1,961
  • Less than 1 year of college: 551
  • Some college more than 1 year, no degree: 1,377
  • Associate degree: 1,382
  • Bachelor's degree: 3,856
  • Master's degree: 1,354
  • Professional school degree: 518
  • Doctorate degree: 284
Educational Attainment for Males

Education attainment for females 25 years and older:

  • No schooling: 171
  • Nursery to 4th grade: 188
  • 5th and 6th grade: 270
  • 7th and 8th grade: 33
  • 9th grade: 29
  • 10th grade: 42
  • 11th grade: 87
  • 12th grade, no diploma: 297
  • High school graduate (or equivalency): 1,852
  • Less than 1 year of college: 1,091
  • Some college more than 1 year, no degree: 1,396
  • Associate degree: 1,321
  • Bachelor's degree: 3,708
  • Master's degree: 1,536
  • Professional school degree: 355
  • Doctorate degree: 167
Educational Attainment for Females
Moorpark marital status for males
Moorpark marital status for females

Housing units in structures:

  • One, detached: 8,958
  • One, attached: 1,090
  • Two: 41
  • 3 or 4: 326
  • 5 to 9: 391
  • 10 to 19: 369
  • 20 to 49: 155
  • 50 or more: 207
  • Mobile homes: 233

Median worth of mobile homes: $185,997

Housing units lacking complete plumbing facilities in 2022: 0.9%

Housing units lacking complete kitchen facilities in 2022: 0.3%

House/condo owner moved in on average 14 years ago

Renter moved in on average 2 years ago

Year householders moved into residence in Moorpark
Houses and condos Apartments
Most commonly used house heating fuel in houses and condos in Moorpark, CA
  • 85.9%Utility gas
  • 9.4%Electricity
  • 2.1%Solar energy
  • 1.7%Bottled, tank, or LP gas
  • 0.4%Wood
  • 0.3%No fuel used
  • 0.2%Coal or coke
Most commonly used house heating fuel in apartments in Moorpark, CA
  • 71.2%Utility gas
  • 20.7%Electricity
  • 7.3%No fuel used
  • 0.8%Bottled, tank, or LP gas

Private vs. public school enrollment:

Students in private schools in grades 1 to 8 (elementary and middle school): 342
Here:

10.3%
California:

10.5%

Students in private schools in grades 9 to 12 (high school): 70
Here:

3.8%
California:

8.5%

Students in private undergraduate colleges: 234
Here:

12.9%
California:

15.9%
School Enrollment by Level of School for Male Students
School Enrollment by Level of School for Female Students
Age and Sex of Sensory-Disabled Noninstitutionalized Residents
Age and Sex of Physically-Disabled Noninstitutionalized Residents
Age and Sex of Mentally-Disabled Noninstitutionalized Residents
Age and Sex of Self-Care Disabled Noninstitutionalized Residents
Age and Sex of Go-Outside-Home Disabled Noninstitutionalized Residents
Age and Sex of Noninstitutionalized Residents with Employment Disability