Housing density: 628 houses/condos per square mile
Median price asked for vacant for-sale houses and condos in 2022 in this county: $378,161.
Median contract rent in 2022: over $2,000 (lower quartile is over $2,000, upper quartile is over $2,000)
Median rent asked for vacant for-rent units in 2022: $4,075
Median gross rent in Moraga, CA in 2022: over $2,000
Housing units in Moraga with a mortgage: 3,286 (361 second mortgage, 698 home equity loan, 13 both second mortgage and home equity loan) Houses without a mortgage: 1,167
In family households: 895,275 (185,206 male householders, 80,074 female householders)
199,021 spouses, 320,947 children (302,778 natural, 6,543 adopted, 11,626 stepchildren), 20,722 grandchildren, 14,424 brothers or sisters, 13,961 parents, foster children, 21,146 other relatives, 29,185 non-relatives
In nonfamily households: 143,436 (48,395 male householders (34,478 living alone)), 61,689 female householders (50,577 living alone)), 33,352 nonrelatives
In group quarters: 10,314 (5,346 institutionalized population)
175,577 married couples with children.
49,858 single-parent households (12,019 men, 37,839 women).
81.6% of residents of Moraga speak English at home.
3.3% of residents speak Spanish at home (75% speak English very well, 16% speak English well, 8% speak English not well).
6.1% of residents speak other Indo-European language at home (79% speak English very well, 13% speak English well, 8% speak English not well).
8.0% of residents speak Asian or Pacific Island language at home (58% speak English very well, 29% speak English well, 13% speak English not well).
1.1% of residents speak other language at home (66% speak English very well, 32% speak English well, 2% speak English not well).
Foreign born population: 4,431 (21.8%)
(82.0% of them are naturalized citizens)
Percentage of workers working in this county: 60.2% Number of people working at home: 1,935 (20.7% of all workers)
Travel time to work (commute)
Less than 5 minutes: 214
5 to 9 minutes: 710
10 to 14 minutes: 431
15 to 19 minutes: 594
20 to 24 minutes: 697
25 to 29 minutes: 446
30 to 34 minutes: 970
35 to 39 minutes: 381
40 to 44 minutes: 365
45 to 59 minutes: 905
60 to 89 minutes: 936
90 or more minutes: 282
Means of transportation to work:
Drove a car alone: 4,783 (64.4%)
Carpooled: 787 (10.6%)
Bus or trolley bus: 48 (0.6%)
Streetcar or trolley car: 4 (0.1%)
Subway or elevated: 820 (11.0%)
Railroad: 45 (0.6%)
Ferryboat: 5 (0.1%)
Taxi: 6 (0.1%)
Motorcycle: 14 (0.2%)
Bicycle: 13 (0.2%)
Walked: 330 (4.4%)
Other means: 76 (1.0%)
Worked at home: 496 (6.7%)
Year of entry for the foreign-born population in Moraga, California
4751995 to March 2000
2031990 to 1994
3561985 to 1989
3391980 to 1984
2601975 to 1979
2061970 to 1974
2161965 to 1969
508Before 1965
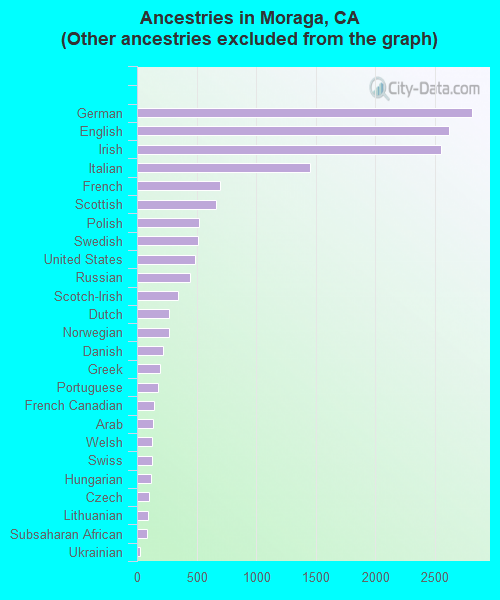
First ancestries reported:
Other: 6,141 (28.7%)
German: 2,817 (13.2%)
English: 2,624 (12.3%)
Irish: 2,555 (12.0%)
Italian: 1,455 (6.8%)
French: 696 (3.3%)
Scottish: 667 (3.1%)
Polish: 523 (2.4%)
Swedish: 509 (2.4%)
United States: 487 (2.3%)
Russian: 448 (2.1%)
Scotch-Irish: 344 (1.6%)
Dutch: 270 (1.3%)
Norwegian: 266 (1.2%)
Danish: 220 (1.0%)
Greek: 193 (0.9%)
Portuguese: 174 (0.8%)
French Canadian: 140 (0.7%)
Arab: 135 (0.6%)
Welsh: 125 (0.6%)
Swiss: 123 (0.6%)
Hungarian: 114 (0.5%)
Czech: 105 (0.5%)
Lithuanian: 92 (0.4%)
Subsaharan African: 88 (0.4%)
Ukrainian: 26 (0.1%)
Slovak: 22 (0.1%)
West Indian: 6 (0.03%)
Most common places of birth for foreign-born residents (%):
China, excluding Hong Kong and Taiwan
Moraga:
15.1% (387)
California:
3.7% (327,611)
Taiwan
Moraga:
9.4% (240)
California:
1.7% (151,775)
United Kingdom
Moraga:
8.5% (219)
California:
1.5% (133,090)
Iran
Moraga:
6.2% (158)
California:
1.8% (158,613)
Hong Kong
Moraga:
5.8% (148)
California:
1.0% (91,101)
Canada
Moraga:
5.6% (144)
California:
1.6% (141,181)
Korea
Moraga:
4.7% (121)
California:
3.0% (268,452)
Germany
Moraga:
4.4% (112)
California:
1.1% (98,160)
Japan
Moraga:
4.0% (102)
California:
1.3% (112,212)
India
Moraga:
3.1% (80)
California:
2.2% (198,201)
Philippines
Moraga:
2.7% (69)
California:
7.5% (664,935)
Other Western Europe
Moraga:
2.6% (67)
California:
0.2% (16,809)
Mexico
Moraga:
2.1% (55)
California:
44.3% (3,928,701)
Russia
Moraga:
1.5% (39)
California:
0.6% (54,660)
Place of birth for U.S.-born residents:
This state: 8,648
Other state: 5,240
Northeast: 1,616
Midwest: 1,860
South: 788
West: 976
60% of Moraga residents lived in the same house 5 years ago. Out of people who lived in different houses, 37% lived in this county. Out of people who lived in different counties, 74% lived in California.
Education attainment for males 25 years and older:
No schooling: 0
Nursery to 4th grade: 0
5th and 6th grade: 6
7th and 8th grade: 4
9th grade: 0
10th grade: 22
11th grade: 29
12th grade, no diploma: 49
High school graduate (or equivalency): 230
Less than 1 year of college: 104
Some college more than 1 year, no degree: 506
Associate degree: 150
Bachelor's degree: 1,742
Master's degree: 1,111
Professional school degree: 579
Doctorate degree: 334
Education attainment for females 25 years and older:
No schooling: 9
Nursery to 4th grade: 6
5th and 6th grade: 0
7th and 8th grade: 23
9th grade: 15
10th grade: 36
11th grade: 34
12th grade, no diploma: 78
High school graduate (or equivalency): 649
Less than 1 year of college: 214
Some college more than 1 year, no degree: 909
Associate degree: 369
Bachelor's degree: 2,179
Master's degree: 814
Professional school degree: 281
Doctorate degree: 119
Housing units in structures:
One, detached: 4,044
One, attached: 979
Two: 72
3 or 4: 174
5 to 9: 206
10 to 19: 137
20 to 49: 151
50 or more: 57
Mobile homes: 7
Median worth of mobile homes: $209,851
Housing units lacking complete plumbing facilities: 0.1%