Housing density: 1,088 houses/condos per square mile
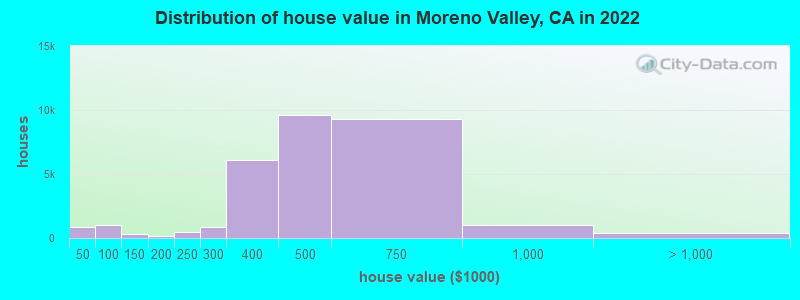
Median price asked for vacant for-sale houses and condos in 2022: $481,079.
Median contract rent in 2022: $1,712 (lower quartile is $1,329, upper quartile is $1,983)
Median rent asked for vacant for-rent units in 2022: $2,424
Median gross rent in Moreno Valley, CA in 2022: $1,951
Housing units in Moreno Valley with a mortgage: 27,940 (1,185 second mortgage, 53 home equity loan, 505 both second mortgage and home equity loan) Houses without a mortgage: 173
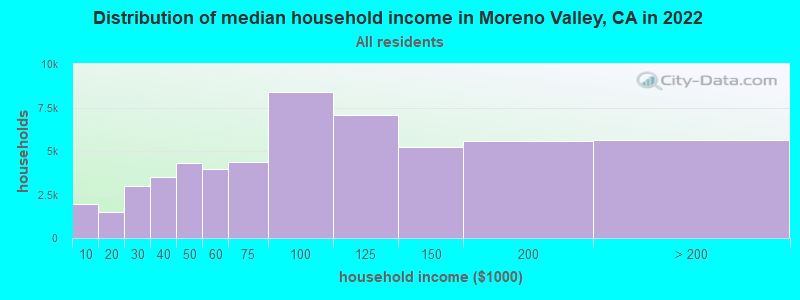
Median household income for houses/condos with a mortgage: $107,916
Median household income for apartments without a mortgage: $78,750
Median monthly housing costs: $1,858
Compare current foreclosures in Moreno Valley, CA:
27,029 married couples with children.
15,010 single-parent households (3,516 men, 11,494 women).
50.2% of residents of Moreno Valley speak English at home.
41.9% of residents speak Spanish at home (61% speak English very well, 19% speak English well, 12% speak English not well, 9% don't speak English at all).
1.9% of residents speak other Indo-European language at home (55% speak English very well, 43% speak English well, 2% speak English not well).
4.6% of residents speak Asian or Pacific Island language at home (59% speak English very well, 28% speak English well, 13% speak English not well).
1.4% of residents speak other language at home (51% speak English very well, 28% speak English well, 21% speak English not well).
Foreign born population: 51,469 (24.3%)
(57.8% of them are naturalized citizens)
Percentage of workers working in this county: 69.8% Number of people working at home: 7,786 (7.8% of all workers)
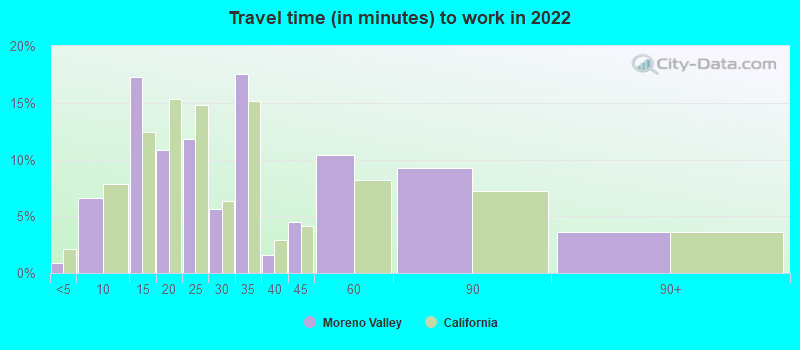
Travel time to work (commute)
Less than 5 minutes: 759
5 to 9 minutes: 4,397
10 to 14 minutes: 9,490
15 to 19 minutes: 12,039
20 to 24 minutes: 11,559
25 to 29 minutes: 5,108
30 to 34 minutes: 15,868
35 to 39 minutes: 4,315
40 to 44 minutes: 3,753
45 to 59 minutes: 9,367
60 to 89 minutes: 9,444
90 or more minutes: 6,551
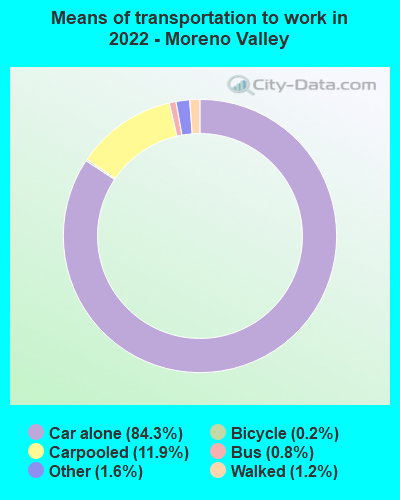
Means of transportation to work:
Drove a car alone: 43,383 (73.0%)
Carpooled: 6,649 (11.2%)
Bus: 348 (0.6%)
Long-distance train or commuter rail: 4 (0.0%)
Taxi: 869 (1.5%)
Bicycle: 138 (0.2%)
Walked: 605 (1.0%)
Worked at home: 7,254 (12.2%)
Unemployment by race in 2022
Unemployment rate for White non-Hispanic residents
1.8%Males
7.1%Females
Unemployment rate for Black residents
10.8%Males
8.1%Females
Unemployment rate for American Indian and Alaska Native residents
5.6%Males
5.7%Females
Unemployment rate for Asian residents
9.0%Males
4.0%Females
Unemployment rate for other race residents
5.2%Males
1.0%Females
Unemployment rate for two or more race residents
4.9%Males
9.1%Females
Unemployment rate for Hispanic or Latino residents
6.0%Males
3.4%Females
Year of entry for the foreign-born population in Moreno Valley, California
7,3482010 or later
12,0472000 to 2009
12,7321990 to 1999
9,8941980 to 1989
6,8151970 to 1979
4,318Before 1970
First ancestries reported:
American: 2,024 (1.3%)
English: 1,531 (1.0%)
German: 1,181 (0.8%)
Irish: 1,013 (0.7%)
Nigerian: 994 (0.7%)
African: 944 (0.6%)
Italian: 883 (0.6%)
Egyptian: 386 (0.3%)
European: 362 (0.2%)
Arab: 239 (0.2%)
Polish: 226 (0.1%)
Scottish: 189 (0.1%)
Scotch-Irish: 141 (0.09%)
West Indian: 138 (0.09%)
Kenyan: 128 (0.08%)
Swedish: 126 (0.08%)
Scandinavian: 124 (0.08%)
Norwegian: 121 (0.08%)
Iraqi: 113 (0.07%)
French: 112 (0.07%)
Romanian: 101 (0.07%)
Palestinian: 76 (0.05%)
Dutch: 72 (0.05%)
Czech: 70 (0.05%)
British: 67 (0.04%)
Belizean: 66 (0.04%)
Afghan: 63 (0.04%)
Eastern European: 60 (0.04%)
Armenian: 56 (0.04%)
French Canadian: 53 (0.03%)
Ukrainian: 51 (0.03%)
Danish: 44 (0.03%)
Haitian: 39 (0.03%)
Turkish: 36 (0.02%)
Swiss: 33 (0.02%)
Ethiopian: 32 (0.02%)
Russian: 31 (0.02%)
Canadian: 29 (0.02%)
Sudanese: 25 (0.02%)
Greek: 25 (0.02%)
Iranian: 21 (0.01%)
Ugandan: 20 (0.01%)
Jamaican: 19 (0.01%)
Lithuanian: 18 (0.01%)
Syrian: 16 (0.01%)
Portuguese: 15 (0.01%)
Welsh: 14 (0.01%)
Lebanese: 12 (0.01%)
Sierra Leonean: 11 (0.01%)
Northern European: 9 (0.01%)
Belgian: 9 (0.01%)
Austrian: 8 (0.01%)
Australian: 8 (0.01%)
Most common places of birth for foreign-born residents (%):
Mexico
Moreno Valley:
63.2% (34,052)
California:
37.2% (3,881,193)
El Salvador
Moreno Valley:
5.3% (2,837)
California:
4.2% (440,287)
Philippines
Moreno Valley:
5.1% (2,726)
California:
7.8% (818,297)
Guatemala
Moreno Valley:
3.5% (1,900)
California:
2.8% (290,436)
Nigeria
Moreno Valley:
1.8% (955)
California:
0.3% (35,557)
Vietnam
Moreno Valley:
1.6% (881)
California:
4.9% (512,335)
China, excluding Hong Kong and Taiwan
Moreno Valley:
1.6% (837)
California:
6.6% (684,672)
Place of birth for U.S.-born residents:
This state: 138,384
Other state: 17,725
Northeast: 2,465
Midwest: 6,420
South: 5,183
West: 3,657
92.5% of Moreno Valley residents lived in the same house 1 years ago. Out of people who lived in different houses, 35.5% lived in this county. Out of people who lived in different counties, 90.7% lived in California.
Moreno Valley:
92.5%
State average:
88.9%
Education attainment for males 25 years and older:
No schooling: 2,413
Nursery to 4th grade: 618
5th and 6th grade: 2,549
7th and 8th grade: 1,074
9th grade: 1,677
10th grade: 1,029
11th grade: 652
12th grade, no diploma: 3,669
High school graduate (or equivalency): 22,376
Less than 1 year of college: 3,557
Some college more than 1 year, no degree: 12,131
Associate degree: 5,014
Bachelor's degree: 6,749
Master's degree: 2,340
Professional school degree: 93
Doctorate degree: 259
Education attainment for females 25 years and older:
No schooling: 1,980
Nursery to 4th grade: 816
5th and 6th grade: 2,509
7th and 8th grade: 534
9th grade: 1,270
10th grade: 798
11th grade: 1,370
12th grade, no diploma: 2,479
High school graduate (or equivalency): 21,087
Less than 1 year of college: 3,408
Some college more than 1 year, no degree: 10,412
Associate degree: 6,180
Bachelor's degree: 8,787
Master's degree: 3,961
Professional school degree: 123
Doctorate degree: 594
Housing units in structures:
One, detached: 44,171
One, attached: 684
Two: 400
3 or 4: 1,183
5 to 9: 3,925
10 to 19: 1,433
20 to 49: 592
50 or more: 1,929
Mobile homes: 1,438
Median worth of mobile homes: $81,400
Housing units lacking complete plumbing facilities in 2022: 0.1%
Housing units lacking complete kitchen facilities in 2022: 0.9%
House/condo owner moved in on average 12 years ago