Morris, CT (Connecticut) Houses and Residents
| Morris: | $404,706 |
| Connecticut: | $347,200 |
Total population: 2,388 (Urban population: 0, Rural population: 2,301 (37 farm, 2,264 nonfarm))
Houses: 1,181 (912 occupied: 717 owner occupied, 195 renter occupied)
| % of renters here: | 21% |
| State: | 34% |
Housing density: 69 houses/condos per square mile
Median price asked for vacant for-sale houses and condos in 2022 in this county: $399,480.
Median contract rent in 2022: $1,165 (lower quartile is $779, upper quartile is $1,734)
Median rent asked for vacant for-rent units in 2022: $1,309
Median gross rent in Morris, CT in 2022: $1,310
Housing units in Morris with a mortgage: 420 (25 second mortgage, 67 home equity loan, 8 both second mortgage and home equity loan)
Houses without a mortgage: 147
Compare current foreclosures near Morris, CT:
| Photo | Address | Area | Beds / Baths | Price | Details |
|---|---|---|---|---|---|

|
#1
Chestnut St
Naugatuck, CT 06770
|
1,012 sq. feet
|
1 baths 2 beds |
$279,900
|
show details |

|
#2
Janwood Rd
Waterbury, CT 06708
|
1,200 sq. feet
|
2 baths 3 beds |
$275,000
|
show details |

|
#3
Allen St
Bristol, CT 06010
|
1,092 sq. feet
|
1 baths 3 beds |
$215,000
|
show details |

|
#4
Clinton Hill Rd
Wolcott, CT 06716
|
1,828 sq. feet
|
1 baths 3 beds |
$240,000
|
show details |

|
#5
Woodbine St
Torrington, CT 06790
|
2,756 sq. feet
|
3 baths 6 beds |
$419,900
|
show details |

|
#6
Wieting Rd
New Milford, CT 06776
|
3,210 sq. feet
|
3 baths 5 beds |
$549,900
|
show details |

|
#7
Surrey Dr
Bristol, CT 06010
|
1,079 sq. feet
|
1 baths 3 beds |
show details | |

|
#8
Spring St
Naugatuck, CT 06770
|
1,216 sq. feet
|
1 baths 3 beds |
show details | |

|
#9
Horne Cir
Southington, CT 06489
|
1,902 sq. feet
|
2 baths 4 beds |
show details | |

|
#10
Lockhart Ave
Waterbury, CT 06705
|
2,104 sq. feet
|
2 baths 3 beds |
show details |
| Photo | Address | Area | Beds / Baths | Price | Details |
|---|---|---|---|---|---|

|
#11
Clairmont Ave
Waterbury, CT 06708
|
1,564 sq. feet
|
2 baths 4 beds |
show details | |

|
#12
Marcia Dr
Torrington, CT 06790
|
1,496 sq. feet
|
2 baths 4 beds |
show details | |

|
#13
Doran St
Waterbury, CT 06704
|
1,036 sq. feet
|
1 baths 3 beds |
show details | |

|
#14
Sylvan Ave
Terryville, CT 06786
|
1,691 sq. feet
|
1 baths 4 beds |
show details | |

|
#15
Fairfield Ave
Waterbury, CT 06708
|
1,538 sq. feet
|
1 baths 2 beds |
show details | |

|
#16
Calumet St
Waterbury, CT 06710
|
2,175 sq. feet
|
2 baths 4 beds |
show details | |

|
#17
Sylvan Ave
Waterbury, CT 06706
|
1,350 sq. feet
|
1 baths 4 beds |
show details | |

|
#18
Farmington Chase Cre
Farmington, CT 06032
|
1,317 sq. feet
|
1 baths 2 beds |
show details | |

|
#19
Litchfield Rd
Harwinton, CT 06791
|
2,216 sq. feet
|
1 baths 3 beds |
show details | |

|
#20
Vanderbilt Rd
Bristol, CT 06010
|
1,803 sq. feet
|
1 baths 5 beds |
show details |
| Photo | Address | Area | Beds / Baths | Price | Details |
|---|---|---|---|---|---|

|
#21
Bch St
Goshen, CT 06756
|
1,380 sq. feet
|
1 baths 4 beds |
show details | |

|
#22
Melinda Ln
Bristol, CT 06010
|
- sq. feet
|
2 baths 4 beds |
show details | |

|
#23
Barbara Dr
Waterbury, CT 06705
|
1,248 sq. feet
|
2 baths 3 beds |
show details | |

|
#24
Park St
Bristol, CT 06010
|
3,171 sq. feet
|
4 baths 9 beds |
show details | |

|
#25
Wolcott St
Bristol, CT 06010
|
1,920 sq. feet
|
2 baths 3 beds |
show details | |

|
#26
N Walnut St
Waterbury, CT 06704
|
1,404 sq. feet
|
1 baths 2 beds |
show details | |

|
#27
Tree Hill Rd
Waterbury, CT 06708
|
960 sq. feet
|
1 baths 3 beds |
show details | |

|
#28
Wood Creek Rd
Burlington, CT 06013
|
1,706 sq. feet
|
2 baths 2 beds |
show details | |

|
#29
Nepaug Rd
Burlington, CT 06013
|
1,100 sq. feet
|
1 baths 3 beds |
show details | |

|
#30
Leonard Rd
Middlebury, CT 06762
|
1,072 sq. feet
|
1 baths 2 beds |
show details |
| Photo | Address | Area | Beds / Baths | Price | Details |
|---|---|---|---|---|---|

|
#31
Transit St
Waterbury, CT 06704
|
1,132 sq. feet
|
2 baths 3 beds |
show details | |

|
#32
Wolcott St Apt 21
Bristol, CT 06010
|
980 sq. feet
|
1 baths 2 beds |
show details | |

|
#33
Orange St
Waterbury, CT 06704
|
1,122 sq. feet
|
1 baths 3 beds |
show details | |

|
#34
Tower Rd
Middlebury, CT 06762
|
2,608 sq. feet
|
2 baths 4 beds |
show details | |

|
#35
Emmett St Apt 78
Bristol, CT 06010
|
900 sq. feet
|
1 baths 2 beds |
show details | |

|
#36
Fairfield Ave
Waterbury, CT 06708
|
1,152 sq. feet
|
1 baths 3 beds |
show details | |

|
#37
Richard Ave
Wolcott, CT 06716
|
1,800 sq. feet
|
1 baths 3 beds |
show details | |

|
#38
Magnolia Ave
Bristol, CT 06010
|
1,044 sq. feet
|
1 baths 4 beds |
show details | |

|
#39
Chestnut St
Bristol, CT 06010
|
2,644 sq. feet
|
3 baths 4 beds |
show details | |

|
#40
Neagle St
Naugatuck, CT 06770
|
1,512 sq. feet
|
2 baths 3 beds |
show details |
| Photo | Address | Area | Beds / Baths | Price | Details |
|---|---|---|---|---|---|

|
#41
Ben St
Bristol, CT 06010
|
1,114 sq. feet
|
2 baths 3 beds |
show details | |

|
#42
Cedar Ln
Wolcott, CT 06716
|
1,876 sq. feet
|
1 baths 3 beds |
show details | |

|
#43
Dennison Dr
Torrington, CT 06790
|
1,330 sq. feet
|
1 baths 3 beds |
show details | |

|
#44
Pleasant View Rd
New Milford, CT 06776
|
2,568 sq. feet
|
2 baths 4 beds |
show details | |

|
#45
Joy Rd
Waterbury, CT 06708
|
1,650 sq. feet
|
1 baths 4 beds |
show details | |

|
#46
Fern Cir
Waterbury, CT 06708
|
2,280 sq. feet
|
2 baths 3 beds |
show details | |

|
#47
Second Hill Rd
New Milford, CT 06776
|
3,662 sq. feet
|
2 baths 4 beds |
show details | |

|
#48
Jeremy Swamp Rd
Southbury, CT 06488
|
3,592 sq. feet
|
3 baths 5 beds |
show details | |

|
#49
Jordan Ln
Torrington, CT 06790
|
1,550 sq. feet
|
2 baths 3 beds |
show details | |

|
Check over 1 million property listings on Foreclosure.com!
|
browse all offers | |||
Latest news about housing in Morris, CT collected exclusively by city-data.com from local newspapers, TV, and radio stations


Household type by relationship:
Households: 187,123- In family households: 156,490 (36,561 male householders, 14,969 female householders)
41,185 spouses, 52,814 children (49,404 natural, 1,325 adopted, 2,085 stepchildren), 2,365 grandchildren, 1,073 brothers or sisters, 1,650 parents, foster children, 1,216 other relatives, 3,500 non-relatives
- In nonfamily households: 30,633 (11,692 male householders (9,019 living alone)), 13,418 female householders (11,384 living alone)), 5,523 nonrelatives
- In group quarters: 2,804 (1,566 institutionalized population)
34,479 married couples with children.
7,472 single-parent households (1,895 men, 5,577 women).
95.6% of residents of Morris speak English at home.
0.4% of residents speak Spanish at home (100% speak English very well).
3.6% of residents speak other Indo-European language at home (85% speak English very well, 15% speak English well).
0.4% of residents speak other language at home (100% speak English well).
Foreign born population: 144 (5.2%)
(91.0% of them are naturalized citizens)
| Here: | 7.2 |
| State: | 6.5 |
| Here: | 3.5 |
| State: | 4.0 |

- Bedrooms in owner-occupied houses and condos in Morris, Connecticut
- 0no bedroom
- 241 bedroom
- 1542 bedrooms
- 3623 bedrooms
- 1514 bedrooms
- 265+ bedrooms

- Bedrooms in renter-occupied apartments in Morris, Connecticut
- 0no bedroom
- 851 bedroom
- 702 bedrooms
- 353 bedrooms
- 54 bedrooms
- 05+ bedrooms

- Cars and other vehicles available in Morris in owner-occupied houses/condos
- 12no vehicle
- 1551 vehicle
- 3042 vehicles
- 1873 vehicles
- 304 vehicles
- 295+ vehicles

- Cars and other vehicles available in Morris in renter-occupied apartments
- 10no vehicle
- 841 vehicle
- 882 vehicles
- 133 vehicles
- 04 vehicles
- 05+ vehicles

- Rooms in owner-occupied houses in Morris, Connecticut
- 01 room
- 02 rooms
- 43 rooms
- 674 rooms
- 1745 rooms
- 1776 rooms
- 1307 rooms
- 768 rooms
- 899+ rooms

- Rooms in renter-occupied apartments in Morris, Connecticut
- 01 room
- 192 rooms
- 703 rooms
- 434 rooms
- 75 rooms
- 336 rooms
- 137 rooms
- 08 rooms
- 109+ rooms


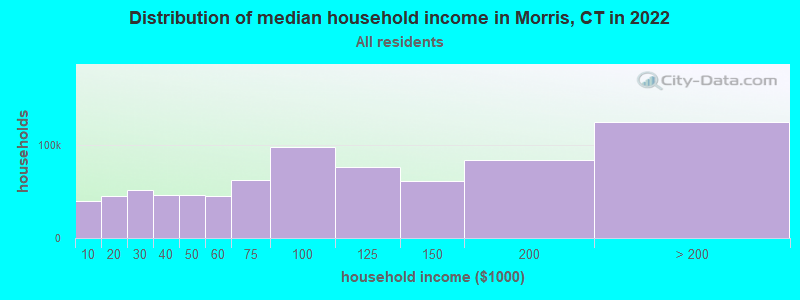
Morris, CT household income distribution

- 4,391Less than $10,000
- 3,564$10,000 to $19,999
- 5,573$20,000 to $29,999
- 7,187$30,000 to $39,999
- 5,820$40,000 to $49,999
- 7,050$50,000 to $59,999
- 13,645$60,000 to $74,999
- 19,713$75,000 to $99,999
- 18,801$100,000 to $124,999
- 15,155$125,000 to $149,999
- 21,817$150,000 to $199,999
- 40,118$200,000 or more
Percentage of workers working in this county: 71.5%
Number of people working at home: 265 (18.8% of all workers)
Travel time to work (commute)
- Less than 5 minutes: 38
- 5 to 9 minutes: 92
- 10 to 14 minutes: 121
- 15 to 19 minutes: 137
- 20 to 24 minutes: 190
- 25 to 29 minutes: 81
- 30 to 34 minutes: 139
- 35 to 39 minutes: 22
- 40 to 44 minutes: 66
- 45 to 59 minutes: 139
- 60 to 89 minutes: 65
- 90 or more minutes: 38
Means of transportation to work:
- Drove a car alone: 976 (81.0%)
- Carpooled: 126 (10.5%)
- Bicycle: 5 (0.4%)
- Walked: 21 (1.7%)
- Worked at home: 77 (6.4%)


- Year of entry for the foreign-born population in Morris, Connecticut
- 181995 to March 2000
- 01990 to 1994
- 01985 to 1989
- 161980 to 1984
- 41975 to 1979
- 81970 to 1974
- 01965 to 1969
- 41Before 1965

First ancestries reported:
- English: 409 (13.8%)
- Italian: 405 (13.6%)
- German: 375 (12.6%)
- Irish: 366 (12.3%)
- French: 212 (7.1%)
- Other: 209 (7.0%)
- Swedish: 140 (4.7%)
- French Canadian: 138 (4.6%)
- Polish: 111 (3.7%)
- United States: 110 (3.7%)
- Lithuanian: 85 (2.9%)
- Scottish: 83 (2.8%)
- Dutch: 60 (2.0%)
- Czech: 51 (1.7%)
- Russian: 48 (1.6%)
- Hungarian: 38 (1.3%)
- Arab: 35 (1.2%)
- Slovak: 17 (0.6%)
- Norwegian: 14 (0.5%)
- Ukrainian: 14 (0.5%)
- Swiss: 13 (0.4%)
- Scotch-Irish: 12 (0.4%)
- Welsh: 8 (0.3%)
- Subsaharan African: 6 (0.2%)
- Portuguese: 5 (0.2%)
- Danish: 4 (0.1%)
Most common places of birth for foreign-born residents (%):
| Morris: | 14.9% (13) |
| Connecticut: | 3.1% (11,432) |
| Morris: | 10.3% (9) |
| Connecticut: | 0.7% (2,646) |
| Morris: | 9.2% (8) |
| Connecticut: | 2.1% (7,596) |
| Morris: | 6.9% (6) |
| Connecticut: | 1.4% (5,021) |
| Morris: | 6.9% (6) |
| Connecticut: | 0.3% (1,269) |
| Morris: | 6.9% (6) |
| Connecticut: | 0.5% (1,832) |
| Morris: | 6.9% (6) |
| Connecticut: | 3.2% (12,009) |
| Morris: | 5.7% (5) |
| Connecticut: | 1.2% (4,344) |
| Morris: | 5.7% (5) |
| Connecticut: | 4.1% (15,108) |
| Morris: | 5.7% (5) |
| Connecticut: | 0.3% (1,053) |
| Morris: | 4.6% (4) |
| Connecticut: | 4.4% (16,395) |
| Morris: | 4.6% (4) |
| Connecticut: | 0.5% (1,693) |
| Morris: | 4.6% (4) |
| Connecticut: | 3.6% (13,282) |
| Morris: | 3.4% (3) |
| Connecticut: | 0.6% (2,220) |
| Morris: | 3.4% (3) |
| Connecticut: | 0.3% (1,224) |
Place of birth for U.S.-born residents:
- This state: 1,761
- Other state: 451
- Northeast: 321
- Midwest: 47
- South: 49
- West: 34
74% of Morris residents lived in the same house 5 years ago.
Out of people who lived in different houses, 69% lived in this county.
Out of people who lived in different counties, 76% lived in Connecticut.
Education attainment for males 25 years and older:
- No schooling: 0
- Nursery to 4th grade: 0
- 5th and 6th grade: 20
- 7th and 8th grade: 50
- 9th grade: 0
- 10th grade: 18
- 11th grade: 18
- 12th grade, no diploma: 23
- High school graduate (or equivalency): 267
- Less than 1 year of college: 54
- Some college more than 1 year, no degree: 109
- Associate degree: 48
- Bachelor's degree: 119
- Master's degree: 55
- Professional school degree: 21
- Doctorate degree: 3

Education attainment for females 25 years and older:
- No schooling: 0
- Nursery to 4th grade: 0
- 5th and 6th grade: 0
- 7th and 8th grade: 30
- 9th grade: 26
- 10th grade: 24
- 11th grade: 8
- 12th grade, no diploma: 34
- High school graduate (or equivalency): 222
- Less than 1 year of college: 67
- Some college more than 1 year, no degree: 122
- Associate degree: 78
- Bachelor's degree: 120
- Master's degree: 63
- Professional school degree: 21
- Doctorate degree: 11


Housing units in structures:
- One, detached: 1,052
- One, attached: 15
- Two: 35
- 3 or 4: 37
- 5 to 9: 14
- 10 to 19: 13
- Mobile homes: 10
- Boats, RVs, vans, etc.: 5
Median worth of mobile homes: $143,870
Housing units lacking complete kitchen facilities: 0.8%

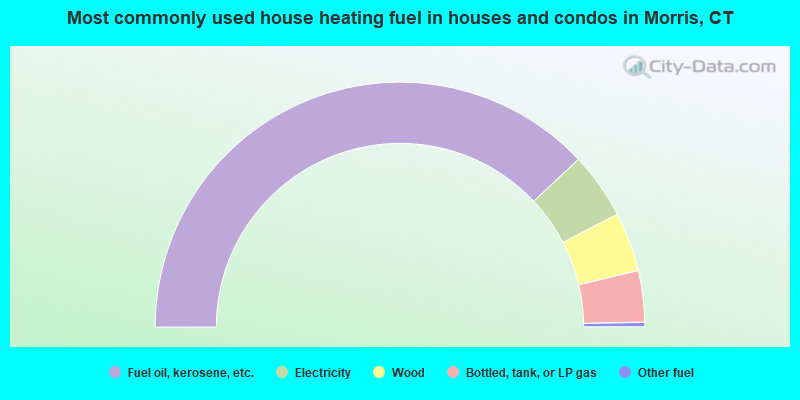
- 76.0%Fuel oil, kerosene, etc.
- 8.8%Electricity
- 7.8%Wood
- 6.8%Bottled, tank, or LP gas
- 0.6%Other fuel
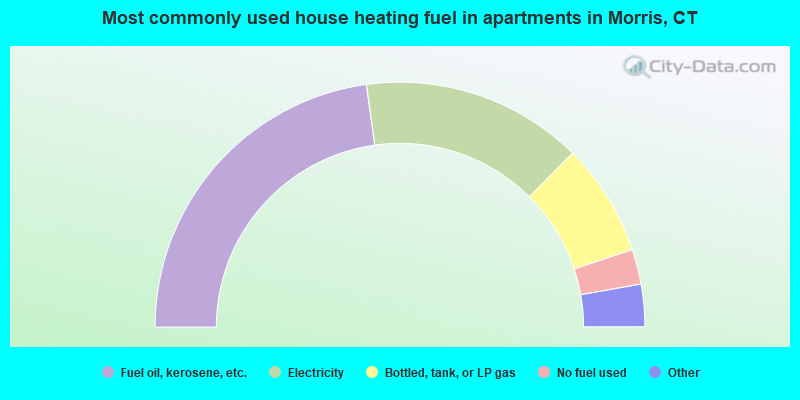
- 45.6%Fuel oil, kerosene, etc.
- 29.2%Electricity
- 14.9%Bottled, tank, or LP gas
- 4.6%No fuel used
- 3.1%Utility gas
- 2.6%Wood
Private vs. public school enrollment:
| Here: | 10.2% |
| Connecticut: | 9.9% |
| Here: | 3.6% |
| Connecticut: | 11.0% |
| Here: | 31.2% |
| Connecticut: | 33.4% |


