Morrow, OH (Ohio) Houses and Residents
| Morrow: | $236,619 |
| Ohio: | $204,100 |
Total population: 1,261 (Urban population: 0, Rural population: 1,276 (all nonfarm))
Houses: 891 (835 occupied: 611 owner occupied, 245 renter occupied)
| % of renters here: | 29% |
| State: | 33% |
Housing density: 527 houses/condos per square mile
Median price asked for vacant for-sale houses and condos in 2022 in this county: $286,266.
Median contract rent in 2022: $675 (lower quartile is $552, upper quartile is $787)
Median rent asked for vacant for-rent units in 2022: $704
Median gross rent in Morrow, OH in 2022: $898
Housing units in Morrow with a mortgage: 465 (27 second mortgage, 0 home equity loan, 27 both second mortgage and home equity loan)
Houses without a mortgage: 6
Median household income for houses/condos with a mortgage: $92,034
Median household income for apartments without a mortgage: $55,738
Median monthly housing costs: $1,119
Compare current foreclosures near Morrow, OH:
| Photo | Address | Area | Beds / Baths | Price | Details |
|---|---|---|---|---|---|

|
#1
Trovillo Rd
Morrow, OH 45152
|
2,232 sq. feet
|
2 baths 3 beds |
$199,900
|
show details |

|
#2
2nd St
Morrow, OH 45152
|
960 sq. feet
|
1 baths 3 beds |
$219,900
|
show details |

|
#3
Highlawn Ave
Morrow, OH 45152
|
1,232 sq. feet
|
1 baths 2 beds |
show details | |

|
#4
Brampton Abbey
Morrow, OH 45152
|
1,712 sq. feet
|
2 baths 4 beds |
show details | |

|
#5
Crested Owl Ct
Morrow, OH 45152
|
1,828 sq. feet
|
2 baths 4 beds |
show details | |

|
#6
Yellowtail Ter
Morrow, OH 45152
|
2,008 sq. feet
|
2 baths 4 beds |
show details | |

|
#7
Sullivans Ridge Dr
Morrow, OH 45152
|
- sq. feet
|
- baths - beds |
show details | |

|
#8
Jessica Suzanne Dr
Morrow, OH 45152
|
- sq. feet
|
- baths - beds |
show details | |

|
#9
Grande Oaks Dr
Morrow, OH 45152
|
- sq. feet
|
- baths - beds |
show details | |

|
#10
Jessica Suzanne Dr
Morrow, OH 45152
|
- sq. feet
|
- baths - beds |
show details |
| Photo | Address | Area | Beds / Baths | Price | Details |
|---|---|---|---|---|---|

|
#11
Mason Morrow Millgrove Rd
Morrow, OH 45152
|
- sq. feet
|
- baths - beds |
show details | |

|
#12
E Us Highway 22 And 3
Morrow, OH 45152
|
- sq. feet
|
- baths - beds |
show details | |

|
#13
Morning Mist Dr
Morrow, OH 45152
|
- sq. feet
|
- baths - beds |
show details | |

|
#14
Mason Morrow Millgrove Rd
Morrow, OH 45152
|
- sq. feet
|
- baths - beds |
show details | |

|
#15
Jessica Suzanne Dr
Morrow, OH 45152
|
- sq. feet
|
- baths - beds |
show details | |

|
#16
State Route 730
Blanchester, OH 45107
|
1,638 sq. feet
|
2 baths 4 beds |
$349,900
|
show details |

|
#17
Lewis St
Middletown, OH 45044
|
960 sq. feet
|
1 baths 3 beds |
$189,900
|
show details |

|
#18
El Camino Dr
Middletown, OH 45044
|
1,536 sq. feet
|
2 baths 4 beds |
show details | |

|
#19
Amberley Ct
Middletown, OH 45044
|
3,354 sq. feet
|
4 baths 4 beds |
show details | |

|
#20
Yankee Rd
Middletown, OH 45044
|
1,376 sq. feet
|
1 baths 3 beds |
show details |
| Photo | Address | Area | Beds / Baths | Price | Details |
|---|---|---|---|---|---|

|
#21
Plum St
Owensville, OH 45160
|
1,053 sq. feet
|
1 baths 3 beds |
show details | |

|
#22
Kingsgate Way
West Chester, OH 45069
|
1,600 sq. feet
|
2 baths 3 beds |
show details | |

|
#23
Cambridge Dr
Springboro, OH 45066
|
2,152 sq. feet
|
3 baths 4 beds |
show details | |

|
#24
Westfield Dr
Wilmington, OH 45177
|
1,675 sq. feet
|
1 baths 3 beds |
show details | |

|
#25
August Ave
Middletown, OH 45044
|
960 sq. feet
|
1 baths 3 beds |
show details | |

|
#26
Anderson St
Franklin, OH 45005
|
1,284 sq. feet
|
1 baths 2 beds |
show details | |

|
#27
Sweet Street
Martinsville, OH 45146
|
1,204 sq. feet
|
2 baths 3 beds |
show details | |

|
#28
Winton St
Middletown, OH 45044
|
1,165 sq. feet
|
1 baths 2 beds |
show details | |

|
#29
Frances Dr
Blanchester, OH 45107
|
1,520 sq. feet
|
2 baths 3 beds |
show details | |

|
#30
Court Edmun
Middletown, OH 45044
|
1,304 sq. feet
|
2 baths 3 beds |
show details |
| Photo | Address | Area | Beds / Baths | Price | Details |
|---|---|---|---|---|---|

|
#31
Winters Ln
Mason, OH 45040
|
2,680 sq. feet
|
2 baths 3 beds |
show details | |

|
#32
Alpine Aster Ct
Middletown, OH 45044
|
4,307 sq. feet
|
4 baths 4 beds |
show details | |

|
#33
Monarch Dr
Middletown, OH 45044
|
1,276 sq. feet
|
1 baths 3 beds |
show details | |

|
#34
Tucker Dr
West Chester, OH 45069
|
2,848 sq. feet
|
3 baths 4 beds |
show details | |

|
#35
Shawnray Dr Apt 66
Middletown, OH 45044
|
956 sq. feet
|
1 baths 2 beds |
show details | |

|
#36
Fallen Oaks Dr
Mason, OH 45040
|
1,694 sq. feet
|
2 baths 3 beds |
show details | |

|
#37
Taylor Dr
Wilmington, OH 45177
|
1,188 sq. feet
|
2 baths 3 beds |
show details | |

|
#38
Marlette Dr
Cincinnati, OH 45249
|
2,484 sq. feet
|
2 baths 4 beds |
show details | |

|
#39
Halpin Rd
Clarksville, OH 45113
|
1,456 sq. feet
|
2 baths 3 beds |
show details | |

|
#40
Stillington Dr
Hamilton, OH 45011
|
2,302 sq. feet
|
2 baths 4 beds |
show details |
| Photo | Address | Area | Beds / Baths | Price | Details |
|---|---|---|---|---|---|

|
#41
Hopewell Rd
Cincinnati, OH 45242
|
1,572 sq. feet
|
3 baths 4 beds |
show details | |

|
#42
Linden Creek Dr
Milford, OH 45150
|
1,508 sq. feet
|
1 baths 3 beds |
show details | |

|
#43
Broadview Pl
Milford, OH 45150
|
1,400 sq. feet
|
1 baths 3 beds |
show details | |

|
#44
Polo Trail Pl
West Chester, OH 45069
|
2,268 sq. feet
|
2 baths 4 beds |
show details | |

|
#45
Bardean Dr
West Chester, OH 45069
|
960 sq. feet
|
1 baths 3 beds |
show details | |

|
#46
Whispering Pines Dr
Loveland, OH 45140
|
2,862 sq. feet
|
2 baths 4 beds |
show details | |

|
#47
Cedar Knoll Dr
Mason, OH 45040
|
2,240 sq. feet
|
2 baths 4 beds |
show details | |

|
#48
Graham Rd
Fayetteville, OH 45118
|
1,224 sq. feet
|
1 baths 3 beds |
show details | |

|
#49
Hancock Cv
Franklin, OH 45005
|
1,586 sq. feet
|
2 baths 3 beds |
show details | |

|
Check over 1 million property listings on Foreclosure.com!
|
browse all offers | |||

Latest news about housing in Morrow, OH collected exclusively by city-data.com from local newspapers, TV, and radio stations


Median year apartment built: 1963
Household type by relationship:
Households: 2,401- Male householders: 455 (84 living alone), Female householders: 376 (118 living alone)
453 spouses (453 opposite-sex spouses), 56 unmarried partners, (56 opposite-sex unmarried partners), 907 children (772 natural, 45 adopted, 90 stepchildren), 8 grandchildren, 3 brothers or sisters, 30 parents, 0 foster children, 7 other relatives, 53 non-relatives
- In group quarters: 48
Size of family households: 232 2-persons, 82 3-persons, 204 4-persons, 29 5-persons, 29 6-persons, 4 7-or-more-persons.
Size of nonfamily households: 248 1-person, 23 2-persons, 3 3-persons, 4 4-persons.
467 married couples with children.
156 single-parent households (65 men, 91 women).
91.7% of residents of Morrow speak English at home.
7.0% of residents speak Spanish at home (84% speak English very well, 13% speak English well, 3% don't speak English at all).
0.2% of residents speak other Indo-European language at home (100% speak English very well).
0.6% of residents speak Asian or Pacific Island language at home (50% speak English very well, 50% speak English well).
Foreign born population: 132 (5.5%)
(54.5% of them are naturalized citizens)
| Here: | 6.9 |
| State: | 6.7 |
| Here: | 4.5 |
| State: | 4.4 |

- Bedrooms in owner-occupied houses and condos in Morrow, Ohio
- 0no bedroom
- 01 bedroom
- 322 bedrooms
- 3133 bedrooms
- 2334 bedrooms
- 345+ bedrooms

- Bedrooms in renter-occupied apartments in Morrow, Ohio
- 8no bedroom
- 751 bedroom
- 582 bedrooms
- 673 bedrooms
- 214 bedrooms
- 165+ bedrooms

- Cars and other vehicles available in Morrow in owner-occupied houses/condos
- 18no vehicle
- 1561 vehicle
- 2432 vehicles
- 1043 vehicles
- 274 vehicles
- 625+ vehicles

- Cars and other vehicles available in Morrow in renter-occupied apartments
- 20no vehicle
- 1361 vehicle
- 422 vehicles
- 383 vehicles
- 44 vehicles
- 45+ vehicles

- Rooms in owner-occupied houses in Morrow, Ohio
- 01 room
- 02 rooms
- 03 rooms
- 124 rooms
- 1275 rooms
- 986 rooms
- 1327 rooms
- 1098 rooms
- 1339+ rooms

- Rooms in renter-occupied apartments in Morrow, Ohio
- 81 room
- 222 rooms
- 423 rooms
- 554 rooms
- 245 rooms
- 396 rooms
- 187 rooms
- 118 rooms
- 259+ rooms


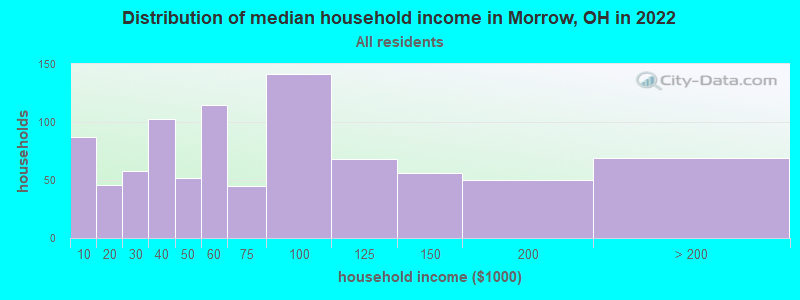
Morrow, OH household income distribution

- 87Less than $10,000
- 46$10,000 to $19,999
- 58$20,000 to $29,999
- 103$30,000 to $39,999
- 52$40,000 to $49,999
- 115$50,000 to $59,999
- 45$60,000 to $74,999
- 141$75,000 to $99,999
- 68$100,000 to $124,999
- 56$125,000 to $149,999
- 50$150,000 to $199,999
- 69$200,000 or more
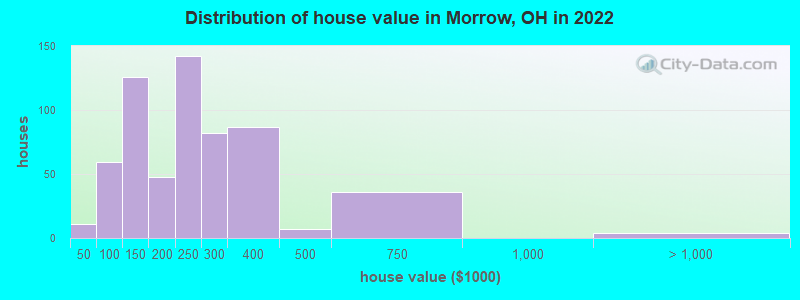
Home value of owner - occupied houses in 2022 in Morrow, OH
-
- 2Less than $10,000
- 2$10,000 to $14,999
- 6$15,000 to $19,999
- 9$50,000 to $59,999
- 47$80,000 to $89,999
- 1$90,000 to $99,999
- 51$100,000 to $124,999
- 74$125,000 to $149,999
- 28$150,000 to $174,999
- 19$175,000 to $199,999
- 142$200,000 to $249,999
- 81$250,000 to $299,999
- 87$300,000 to $399,999
- 6$400,000 to $499,999
- 35$500,000 to $749,999
- 4$1,500,000 to $1,999,999
Rent paid by renters in 2022 in Morrow, OH
-
- 22$200 to $249
- 16$300 to $349
- 6$350 to $399
- 9$400 to $449
- 11$500 to $549
- 20$550 to $599
- 60$650 to $699
- 10$700 to $749
- 5$750 to $799
- 9$800 to $899
- 5$900 to $999
- 20$1,000 to $1,249
- 8$1,250 to $1,499
- 1$2,000 to $2,499
- 7$2,500 to $2,999
- 9No cash rent


Percentage of workers working in this county: 63.4%
Number of people working at home: 245 (24.3% of all workers)

Travel time to work (commute)
- Less than 5 minutes: 6
- 5 to 9 minutes: 13
- 10 to 14 minutes: 46
- 15 to 19 minutes: 54
- 20 to 24 minutes: 76
- 25 to 29 minutes: 105
- 30 to 34 minutes: 132
- 35 to 39 minutes: 15
- 40 to 44 minutes: 160
- 45 to 59 minutes: 105
- 60 to 89 minutes: 56
- 90 or more minutes: 97
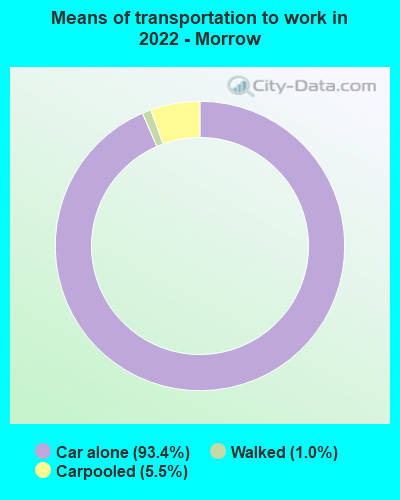
Means of transportation to work:
- Drove a car alone: 705 (72.5%)
- Carpooled: 44 (4.5%)
- Walked: 7 (0.7%)
- Worked at home: 245 (25.2%)

- Unemployment by race in 2022
- Unemployment rate for White non-Hispanic residents
- 3.4%Males
- 1.5%Females
- Unemployment rate for two or more race residents
- 4.9%Males

- Year of entry for the foreign-born population in Morrow, Ohio
- 122010 or later
- 942000 to 2009
- 81990 to 1999
- 01980 to 1989
- 01970 to 1979
- 4Before 1970

First ancestries reported:
- American: 161 (20.9%)
- German: 115 (14.9%)
- English: 69 (9.0%)
- Irish: 59 (7.7%)
- European: 46 (6.0%)
- Italian: 23 (3.0%)
- Scottish: 16 (2.1%)
- French: 9 (1.2%)
- Polish: 3 (0.4%)
- Slovak: 3 (0.4%)
- Scotch-Irish: 2 (0.3%)
- British: 1 (0.1%)
- Hungarian: 1 (0.1%)
Most common places of birth for foreign-born residents (%):
| Morrow: | 66.4% (79) |
| Ohio: | 7.8% (44,796) |
| Morrow: | 21.8% (26) |
| Ohio: | 0.2% (1,360) |
| Morrow: | 2.5% (3) |
| Ohio: | 0.4% (2,094) |
| Morrow: | 2.5% (3) |
| Ohio: | 11.6% (66,525) |
| Morrow: | 1.7% (2) |
| Ohio: | 0.9% (5,422) |
Place of birth for U.S.-born residents:
- This state: 1,549
- Other state: 663
- Northeast: 41
- Midwest: 156
- South: 389
- West: 86
83.4% of Morrow residents lived in the same house 1 years ago.
Out of people who lived in different houses, 26.1% lived in this county.
Out of people who lived in different counties, 82.2% lived in Ohio.
| Morrow: | 83.4% |
| State average: | 87.8% |
Education attainment for males 25 years and older:
- No schooling: 15
- Nursery to 4th grade: 0
- 5th and 6th grade: 0
- 7th and 8th grade: 10
- 9th grade: 1
- 10th grade: 4
- 11th grade: 41
- 12th grade, no diploma: 14
- High school graduate (or equivalency): 285
- Less than 1 year of college: 42
- Some college more than 1 year, no degree: 97
- Associate degree: 44
- Bachelor's degree: 97
- Master's degree: 61
- Professional school degree: 5
- Doctorate degree: 0

Education attainment for females 25 years and older:
- No schooling: 1
- Nursery to 4th grade: 0
- 5th and 6th grade: 0
- 7th and 8th grade: 10
- 9th grade: 0
- 10th grade: 13
- 11th grade: 23
- 12th grade, no diploma: 9
- High school graduate (or equivalency): 273
- Less than 1 year of college: 112
- Some college more than 1 year, no degree: 96
- Associate degree: 90
- Bachelor's degree: 130
- Master's degree: 52
- Professional school degree: 3
- Doctorate degree: 9


Housing units in structures:
- One, detached: 706
- One, attached: 5
- Two: 66
- 3 or 4: 31
- 5 to 9: 15
- 20 to 49: 59
- Mobile homes: 6
Housing units lacking complete kitchen facilities in 2022: 0.7%
House/condo owner moved in on average 7 years ago
Renter moved in on average 3 years ago

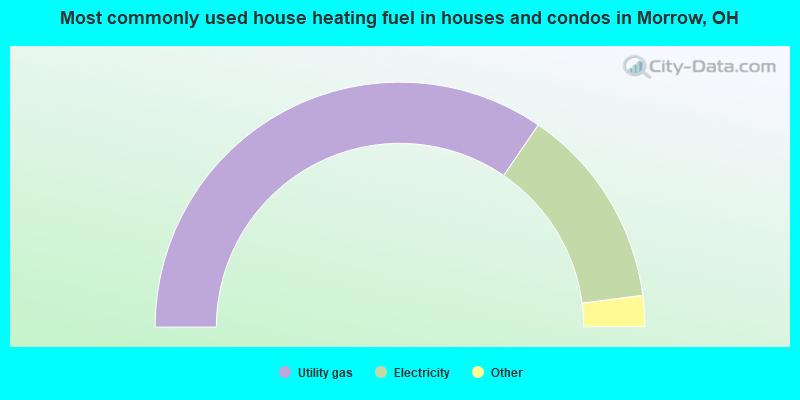
- 69.2%Utility gas
- 26.8%Electricity
- 1.7%Bottled, tank, or LP gas
- 0.9%Wood
- 0.7%Fuel oil, kerosene, etc.
- 0.7%Other fuel
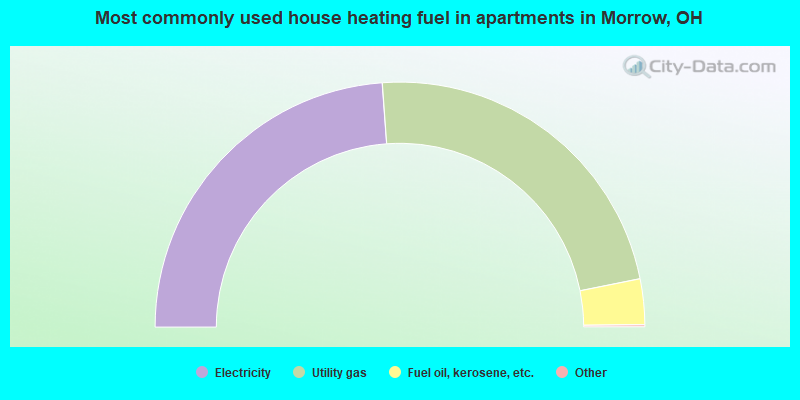
- 47.8%Electricity
- 46.1%Utility gas
- 6.0%Fuel oil, kerosene, etc.
Private vs. public school enrollment:
| Here: | 4.9% |
| Ohio: | 16.0% |
| Here: | 3.6% |
| Ohio: | 13.1% |
| Here: | 14.9% |
| Ohio: | 22.3% |


