Mount Clare, IL (Illinois) Houses and Residents
| Mount Clare: | $93,653 |
| Illinois: | $251,600 |
Total population: 271 (All urban)
Houses: 132 (108 occupied: 76 owner occupied, 33 renter occupied)
| % of renters here: | 30% |
| State: | 33% |
Housing density: 87 houses/condos per square mile
Median price asked for vacant for-sale houses and condos in 2022 in this county: $62,969.
Median contract rent in 2022: $411 (lower quartile is $311, upper quartile is $557)
Median rent asked for vacant for-rent units in 2022: $382
Median gross rent in Mount Clare, IL in 2022: $705
Housing units in Mount Clare with a mortgage: 36 (4 second mortgage, 0 home equity loan, 4 both second mortgage and home equity loan)
Houses without a mortgage: 0
Median household income for houses/condos with a mortgage: $61,479
Median household income for apartments without a mortgage: $50,781
Median monthly housing costs: $701
Compare current foreclosures near Mount Clare, IL:
| Photo | Address | Area | Beds / Baths | Price | Details |
|---|---|---|---|---|---|

|
#1
Quail Run
Bethalto, IL 62010
|
1,336 sq. feet
|
2 baths 3 beds |
show details | |

|
#2
Saint James Dr
Edwardsville, IL 62025
|
1,468 sq. feet
|
3 baths 3 beds |
show details | |

|
#3
New Douglas Rd
New Douglas, IL 62074
|
1,008 sq. feet
|
1 baths 3 beds |
show details | |

|
#4
Van Buren St
Litchfield, IL 62056
|
1,910 sq. feet
|
1 baths 4 beds |
show details | |

|
#5
Bononi Rd
New Douglas, IL 62074
|
1,144 sq. feet
|
2 baths 5 beds |
show details | |

|
#6
Shore Dr SW
Edwardsville, IL 62025
|
768 sq. feet
|
2 baths 3 beds |
show details | |

|
#7
Renken Rd
Dorsey, IL 62021
|
1,520 sq. feet
|
1 baths 5 beds |
show details | |

|
#8
Seiler Rd
Alton, IL 62002
|
984 sq. feet
|
1 baths 4 beds |
show details | |

|
#9
W Chestnut St
Gillespie, IL 62033
|
1,092 sq. feet
|
1 baths 2 beds |
show details | |

|
#10
Dorothy St
Moro, IL 62067
|
952 sq. feet
|
1 baths 2 beds |
show details |
| Photo | Address | Area | Beds / Baths | Price | Details |
|---|---|---|---|---|---|

|
#11
Route 4
Staunton, IL 62088
|
1,382 sq. feet
|
2 baths 3 beds |
show details | |

|
#12
Lakeside Dr
Bethalto, IL 62010
|
2,062 sq. feet
|
3 baths 5 beds |
show details | |

|
#13
State Route 4
Staunton, IL 62088
|
- sq. feet
|
1 baths 4 beds |
show details | |

|
#14
Illinois Route 16
Litchfield, IL 62056
|
- sq. feet
|
1 baths 3 beds |
show details | |

|
#15
N Oak St
Carlinville, IL 62626
|
- sq. feet
|
- baths - beds |
$15,900
|
show details |

|
#16
Saint James Dr
Edwardsville, IL 62025
|
3,701 sq. feet
|
1 baths - beds |
show details | |

|
#17
E Columbia St
Litchfield, IL 62056
|
832 sq. feet
|
- baths - beds |
show details | |

|
#18
Pinnacle Dr
Worden, IL 62097
|
1,696 sq. feet
|
1 baths - beds |
show details | |

|
#19
Saint James Dr
Edwardsville, IL 62025
|
3,046 sq. feet
|
1 baths - beds |
show details | |

|
#20
Waikiki Dr
Worden, IL 62097
|
1,522 sq. feet
|
1 baths - beds |
show details |
| Photo | Address | Area | Beds / Baths | Price | Details |
|---|---|---|---|---|---|

|
#21
Newport Bay Dr
Edwardsville, IL 62025
|
1,524 sq. feet
|
1 baths - beds |
show details | |

|
#22
S Jackson St
Litchfield, IL 62056
|
1,140 sq. feet
|
- baths - beds |
show details | |

|
#23
Albrecht Road
Staunton, IL 62088
|
1,568 sq. feet
|
1 baths - beds |
show details | |

|
#24
Old Straube Ln
Alton, IL 62002
|
1,344 sq. feet
|
1 baths - beds |
show details | |

|
#25
San Juan Dr
Edwardsville, IL 62025
|
2,043 sq. feet
|
1 baths - beds |
show details | |

|
#26
Schwinn Ln
Bunker Hill, IL 62014
|
- sq. feet
|
- baths - beds |
show details | |

|
#27
Kansas St
Worden, IL 62097
|
940 sq. feet
|
- baths - beds |
show details | |

|
#28
E Donnewald St
Worden, IL 62097
|
- sq. feet
|
- baths - beds |
show details | |

|
#29
Mckinley St
Worden, IL 62097
|
1,024 sq. feet
|
- baths - beds |
show details | |

|
#30
College St
Alhambra, IL 62001
|
1,008 sq. feet
|
- baths - beds |
show details |
| Photo | Address | Area | Beds / Baths | Price | Details |
|---|---|---|---|---|---|

|
#31
Alhambra Rd
New Douglas, IL 62074
|
1,248 sq. feet
|
- baths - beds |
show details | |

|
#32
Osborne Ln
Brighton, IL 62012
|
- sq. feet
|
- baths - beds |
show details | |

|
#33
E Moro Dr
Moro, IL 62067
|
1,286 sq. feet
|
- baths - beds |
show details | |

|
#34
Kerin Rd
Alhambra, IL 62001
|
1,638 sq. feet
|
- baths - beds |
show details | |

|
#35
N 6th St
New Douglas, IL 62074
|
- sq. feet
|
- baths - beds |
show details | |

|
#36
S Marshall St
Alhambra, IL 62001
|
862 sq. feet
|
- baths - beds |
show details | |

|
#37
Ash St
Carlinville, IL 62626
|
- sq. feet
|
- baths - beds |
show details | |

|
#38
Brandt Rd
Alhambra, IL 62001
|
- sq. feet
|
- baths - beds |
show details | |

|
#39
Moreland Ct
Moro, IL 62067
|
- sq. feet
|
- baths - beds |
show details | |

|
#40
Barnett Trl
Litchfield, IL 62056
|
- sq. feet
|
- baths - beds |
show details |
| Photo | Address | Area | Beds / Baths | Price | Details |
|---|---|---|---|---|---|

|
#41
Key West Dr
Edwardsville, IL 62025
|
- sq. feet
|
- baths - beds |
show details | |

|
#42
High Point Dr
Edwardsville, IL 62025
|
1,130 sq. feet
|
- baths - beds |
show details | |

|
#43
High Point Dr
Edwardsville, IL 62025
|
1,344 sq. feet
|
- baths - beds |
show details | |

|
#44
Seiler Rd
Bethalto, IL 62010
|
- sq. feet
|
- baths - beds |
show details | |

|
#45
Shore Dr SW
Edwardsville, IL 62025
|
- sq. feet
|
- baths - beds |
show details | |

|
#46
Wolf Ave
Hamel, IL 62046
|
- sq. feet
|
- baths - beds |
show details | |

|
#47
E Water St
Litchfield, IL 62056
|
- sq. feet
|
- baths - beds |
show details | |

|
#48
N 5th St
Benld, IL 62009
|
- sq. feet
|
- baths - beds |
show details | |

|
#49
S Douglas St
Litchfield, IL 62056
|
- sq. feet
|
- baths - beds |
show details | |

|
Check over 1 million property listings on Foreclosure.com!
|
browse all offers | |||


Median year apartment built: 1947
Household type by relationship:
Households: 336- Male householders: 41 (22 living alone), Female householders: 65 (16 living alone)
44 spouses (44 opposite-sex spouses), 5 unmarried partners, (5 opposite-sex unmarried partners), 67 children (62 natural, 0 adopted, 4 stepchildren), 0 grandchildren, 1 brothers or sisters, 2 parents, 0 foster children, 0 other relatives, 33 non-relatives
- In group quarters: 72
Size of family households: 42 2-persons, 2 3-persons, 15 4-persons, 2 7-or-more-persons.
Size of nonfamily households: 41 1-person, 1 2-persons, 5 5-persons.
25 married couples with children.
25 single-parent households (0 men, 25 women).
100.6% of residents of Mount Clare speak English at home.
Foreign born population: 5 (1.5%)
(0.0% of them are naturalized citizens)
| Here: | 5.6 |
| State: | 6.4 |
| Here: | 4.9 |
| State: | 4.1 |

- Bedrooms in owner-occupied houses and condos in Mount Clare, Illinois
- 0no bedroom
- 51 bedroom
- 262 bedrooms
- 343 bedrooms
- 114 bedrooms
- 05+ bedrooms

- Bedrooms in renter-occupied apartments in Mount Clare, Illinois
- 0no bedroom
- 101 bedroom
- 52 bedrooms
- 173 bedrooms
- 14 bedrooms
- 05+ bedrooms

- Cars and other vehicles available in Mount Clare in owner-occupied houses/condos
- 3no vehicle
- 251 vehicle
- 192 vehicles
- 223 vehicles
- 64 vehicles
- 05+ vehicles

- Cars and other vehicles available in Mount Clare in renter-occupied apartments
- 9no vehicle
- 141 vehicle
- 62 vehicles
- 23 vehicles
- 24 vehicles
- 05+ vehicles

- Rooms in owner-occupied houses in Mount Clare, Illinois
- 01 room
- 02 rooms
- 23 rooms
- 84 rooms
- 265 rooms
- 256 rooms
- 47 rooms
- 58 rooms
- 59+ rooms

- Rooms in renter-occupied apartments in Mount Clare, Illinois
- 01 room
- 22 rooms
- 13 rooms
- 64 rooms
- 145 rooms
- 56 rooms
- 17 rooms
- 28 rooms
- 29+ rooms


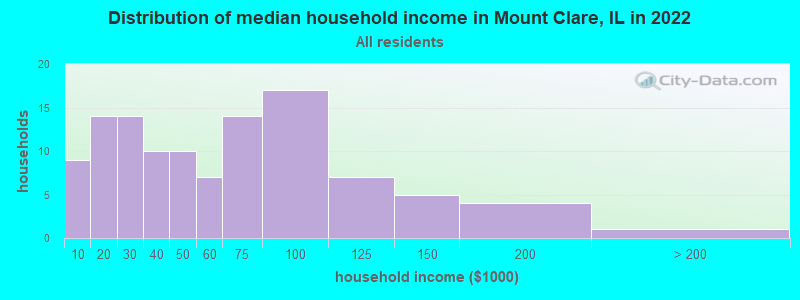
Mount Clare, IL household income distribution

- 9Less than $10,000
- 14$10,000 to $19,999
- 14$20,000 to $29,999
- 10$30,000 to $39,999
- 10$40,000 to $49,999
- 7$50,000 to $59,999
- 14$60,000 to $74,999
- 17$75,000 to $99,999
- 7$100,000 to $124,999
- 5$125,000 to $149,999
- 4$150,000 to $199,999
- 1$200,000 or more
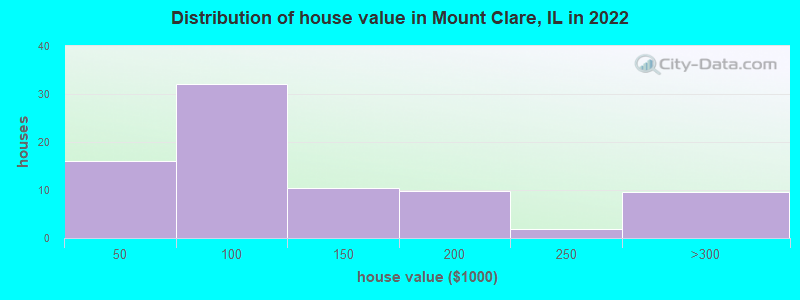
Home value of owner - occupied houses in 2022 in Mount Clare, IL
-
- 6Less than $10,000
- 0$15,000 to $19,999
- 2$20,000 to $24,999
- 2$35,000 to $39,999
- 4$40,000 to $49,999
- 6$50,000 to $59,999
- 9$60,000 to $69,999
- 2$70,000 to $79,999
- 5$80,000 to $89,999
- 3$90,000 to $99,999
- 8$100,000 to $124,999
- 1$125,000 to $149,999
- 6$150,000 to $174,999
- 3$175,000 to $199,999
- 1$200,000 to $249,999
- 9$250,000 to $299,999
Rent paid by renters in 2022 in Mount Clare, IL
-
- 0Less than $100
- 2$100 to $149
- 2$150 to $199
- 8$300 to $349
- 9$400 to $449
- 1$450 to $499
- 3$550 to $599
- 1$600 to $649
- 1$650 to $699
- 2$800 to $899

Percentage of workers working in this county: 60.8%
Number of people working at home: 7 (7.2% of all workers)
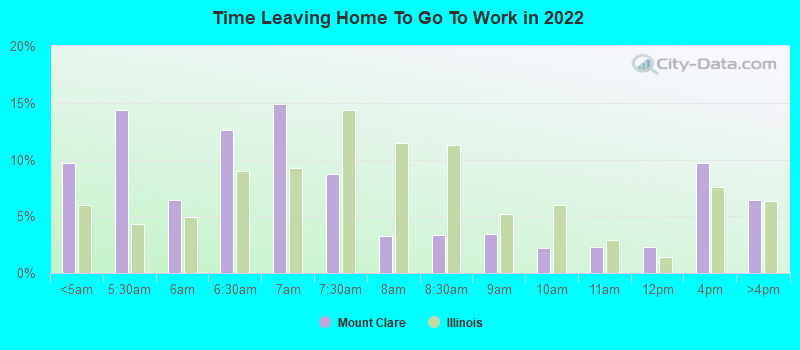
Travel time to work (commute)
- Less than 5 minutes: 1
- 5 to 9 minutes: 26
- 10 to 14 minutes: 17
- 15 to 19 minutes: 12
- 20 to 24 minutes: 9
- 25 to 29 minutes: 0
- 30 to 34 minutes: 3
- 35 to 39 minutes: 0
- 40 to 44 minutes: 1
- 45 to 59 minutes: 2
- 60 to 89 minutes: 4
- 90 or more minutes: 5
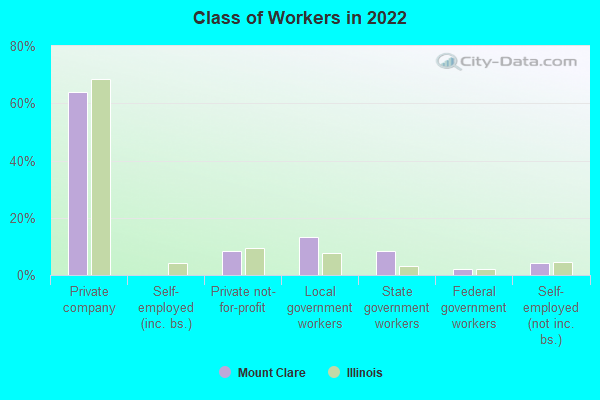
Means of transportation to work:
- Drove a car alone: 102 (64.2%)
- Carpooled: 45 (28.3%)
- Bus or trolley bus: 3 (1.9%)
- Walked: 2 (1.3%)
- Worked at home: 7 (4.4%)
- Unemployment by race in 2022
- Unemployment rate for White non-Hispanic residents
- 10.9%Males
- 3.4%Females
- Unemployment rate for American Indian and Alaska Native residents
- 100.0%Females

- Year of entry for the foreign-born population in Mount Clare, Illinois
- 02010 or later
- 02000 to 2009
- 01990 to 1999
- 01980 to 1989
- 01970 to 1979
- 1Before 1970

First ancestries reported:
- Italian: 31 (25.7%)
- German: 24 (19.9%)
- Irish: 18 (14.9%)
- English: 16 (13.2%)
- Czechoslovakian: 3 (2.5%)
- Lithuanian: 1 (0.8%)
- Polish: 1 (0.8%)
Most common places of birth for foreign-born residents (%):
| Mount Clare: | 80.0% (4) |
| Illinois: | 0.9% (16,308) |
Place of birth for U.S.-born residents:
- This state: 270
- Other state: 52
- Northeast: 2
- Midwest: 37
- South: 8
- West: 5
90.2% of Mount Clare residents lived in the same house 1 years ago.
Out of people who lived in different houses, 31.9% lived in this county.
Out of people who lived in different counties, 70.6% lived in Illinois.
| Mount Clare: | 90.2% |
| State average: | 88.3% |
Education attainment for males 25 years and older:
- No schooling: 0
- Nursery to 4th grade: 0
- 5th and 6th grade: 0
- 7th and 8th grade: 0
- 9th grade: 0
- 10th grade: 0
- 11th grade: 4
- 12th grade, no diploma: 4
- High school graduate (or equivalency): 68
- Less than 1 year of college: 4
- Some college more than 1 year, no degree: 10
- Associate degree: 3
- Bachelor's degree: 10
- Master's degree: 8
- Professional school degree: 2
- Doctorate degree: 0

Education attainment for females 25 years and older:
- No schooling: 2
- Nursery to 4th grade: 0
- 5th and 6th grade: 0
- 7th and 8th grade: 1
- 9th grade: 0
- 10th grade: 19
- 11th grade: 4
- 12th grade, no diploma: 3
- High school graduate (or equivalency): 71
- Less than 1 year of college: 7
- Some college more than 1 year, no degree: 15
- Associate degree: 6
- Bachelor's degree: 8
- Master's degree: 1
- Professional school degree: 0
- Doctorate degree: 4


Housing units in structures:
- One, detached: 109
- 3 or 4: 11
- 5 to 9: 10
- Mobile homes: 2
Housing units lacking complete kitchen facilities in 2022: 12.1%
House/condo owner moved in on average 17 years ago
Renter moved in on average 8 years ago

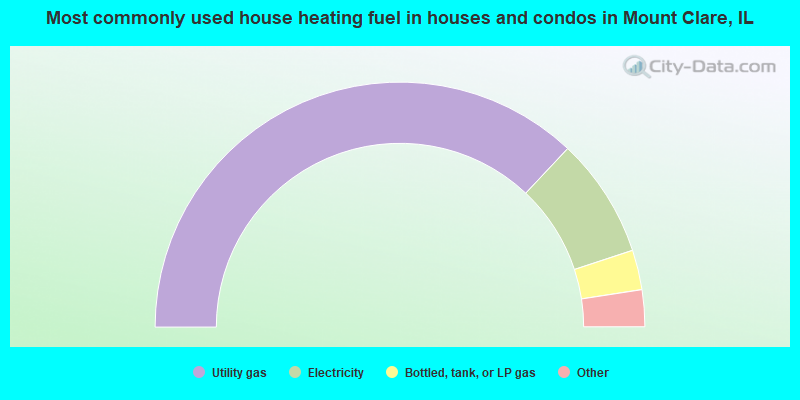
- 74.7%Utility gas
- 16.0%Electricity
- 5.3%Bottled, tank, or LP gas
- 2.7%Other fuel
- 1.3%Wood
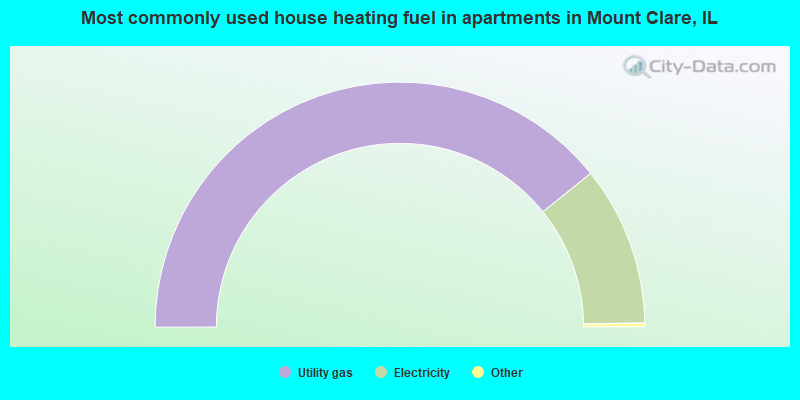
- 78.8%Utility gas
- 21.2%Electricity
Private vs. public school enrollment:
| Here: | 13.8% |
| Illinois: | 13.3% |
| Here: | 0.0% |
| Illinois: | 9.9% |


