Mount Healthy, OH (Ohio) Houses and Residents
| Mount Healthy: | $132,513 |
| Ohio: | $204,100 |
Total population: 6,061 (All urban)
Houses: 3,268 (3,001 occupied: 1,373 owner occupied, 1,674 renter occupied)
| % of renters here: | 55% |
| State: | 33% |
Housing density: 2,296 houses/condos per square mile
Median price asked for vacant for-sale houses and condos in 2022 in this county: $136,154.
Median contract rent in 2022: $844 (lower quartile is $588, upper quartile is $1,053)
Median rent asked for vacant for-rent units in 2022: $436
Median gross rent in Mount Healthy, OH in 2022: $1,023
Housing units in Mount Healthy with a mortgage: 833 (81 second mortgage, 0 home equity loan, 69 both second mortgage and home equity loan)
Houses without a mortgage: 32
Median household income for houses/condos with a mortgage: $73,777
Median household income for apartments without a mortgage: $67,128
Median monthly housing costs: $968
Compare current foreclosures near Mount Healthy, OH:
| Photo | Address | Area | Beds / Baths | Price | Details |
|---|---|---|---|---|---|

|
#1
Werner Ave
Cincinnati, OH 45231
|
1,032 sq. feet
|
1 baths 2 beds |
$124,900
|
show details |

|
#2
Beechwood Dr
Fairfield, OH 45014
|
2,468 sq. feet
|
4 baths 5 beds |
$264,900
|
show details |

|
#3
Williams St
Cincinnati, OH 45215
|
1,152 sq. feet
|
1 baths 2 beds |
show details | |

|
#4
Ann St
Newport, KY 41071
|
939 sq. feet
|
1 baths 2 beds |
show details | |

|
#5
Amberley Ct
Middletown, OH 45044
|
3,354 sq. feet
|
4 baths 4 beds |
show details | |

|
#6
Glade Ave
Cincinnati, OH 45230
|
1,138 sq. feet
|
1 baths 3 beds |
show details | |

|
#7
Kingsgate Way
West Chester, OH 45069
|
1,600 sq. feet
|
2 baths 3 beds |
show details | |

|
#8
Creekhill Dr
Cincinnati, OH 45231
|
1,352 sq. feet
|
3 baths 3 beds |
show details | |

|
#9
Leway Dr
Fairfield, OH 45014
|
960 sq. feet
|
1 baths 4 beds |
show details | |

|
#10
Cascade Rd
Cincinnati, OH 45240
|
1,423 sq. feet
|
1 baths 4 beds |
show details |
| Photo | Address | Area | Beds / Baths | Price | Details |
|---|---|---|---|---|---|

|
#11
Andrew St
Cincinnati, OH 45217
|
1,172 sq. feet
|
1 baths 3 beds |
show details | |

|
#12
Woodlyn Hills Dr
Erlanger, KY 41018
|
1,908 sq. feet
|
3 baths 3 beds |
show details | |

|
#13
Stormy Way
Cincinnati, OH 45230
|
2,448 sq. feet
|
2 baths 4 beds |
show details | |

|
#14
Blossom Dr
Newport, KY 41076
|
1,823 sq. feet
|
2 baths 3 beds |
show details | |

|
#15
Kumler Rd
Seven Mile, OH 45062
|
1,530 sq. feet
|
2 baths 3 beds |
show details | |

|
#16
Linda Dr
Cincinnati, OH 45238
|
1,131 sq. feet
|
2 baths 3 beds |
show details | |

|
#17
Alex Ct
Hebron, KY 41048
|
1,432 sq. feet
|
2 baths 3 beds |
show details | |

|
#18
Clark St
Hamilton, OH 45011
|
1,052 sq. feet
|
1 baths 2 beds |
show details | |

|
#19
Seven Mile Ave
Hamilton, OH 45011
|
720 sq. feet
|
1 baths 2 beds |
show details | |

|
#20
Race Rd
Cincinnati, OH 45211
|
1,523 sq. feet
|
2 baths 3 beds |
show details |
| Photo | Address | Area | Beds / Baths | Price | Details |
|---|---|---|---|---|---|

|
#21
Lexington Dr
Erlanger, KY 41018
|
1,063 sq. feet
|
1 baths 3 beds |
show details | |

|
#22
Kirkup Ave
Cincinnati, OH 45213
|
2,142 sq. feet
|
2 baths 4 beds |
show details | |

|
#23
Perry St
Cincinnati, OH 45231
|
1,176 sq. feet
|
1 baths 2 beds |
show details | |

|
#24
Delhi Ave
Cincinnati, OH 45204
|
950 sq. feet
|
1 baths 3 beds |
show details | |

|
#25
Ramble Vw Unit 102
Cincinnati, OH 45231
|
1,129 sq. feet
|
2 baths 2 beds |
show details | |

|
#26
Philloret Dr
Cincinnati, OH 45239
|
1,233 sq. feet
|
1 baths 3 beds |
show details | |

|
#27
Bertus St
Cincinnati, OH 45217
|
1,488 sq. feet
|
2 baths 2 beds |
show details | |

|
#28
Lakeview Dr
Middletown, OH 45044
|
1,825 sq. feet
|
2 baths 4 beds |
show details | |

|
#29
Knollridge Ln
Cincinnati, OH 45231
|
1,307 sq. feet
|
2 baths 3 beds |
show details | |

|
#30
Garvey Ave
Erlanger, KY 41018
|
848 sq. feet
|
1 baths 3 beds |
show details |
| Photo | Address | Area | Beds / Baths | Price | Details |
|---|---|---|---|---|---|

|
#31
Sidney Rd
Cincinnati, OH 45238
|
1,469 sq. feet
|
2 baths 2 beds |
show details | |

|
#32
Clover Dr
Mason, OH 45040
|
1,521 sq. feet
|
1 baths 3 beds |
show details | |

|
#33
Elk Green Ct
Hamilton, OH 45011
|
2,055 sq. feet
|
2 baths 4 beds |
show details | |

|
#34
Grovedale Pl
Cincinnati, OH 45208
|
2,091 sq. feet
|
2 baths 3 beds |
show details | |

|
#35
Ashbrook Dr
Cincinnati, OH 45238
|
1,021 sq. feet
|
1 baths 1 beds |
show details | |

|
#36
Apple Tree Ln
Erlanger, KY 41018
|
960 sq. feet
|
1 baths 3 beds |
show details | |

|
#37
Charloe St
Cincinnati, OH 45227
|
1,036 sq. feet
|
1 baths 3 beds |
show details | |

|
#38
Concord St
Cincinnati, OH 45206
|
1,696 sq. feet
|
1 baths 3 beds |
show details | |

|
#39
Lehman Rd Unit No306
Cincinnati, OH 45204
|
1,014 sq. feet
|
1 baths 2 beds |
show details | |

|
#40
Elk Run Dr
Hamilton, OH 45011
|
1,566 sq. feet
|
2 baths 3 beds |
show details |
| Photo | Address | Area | Beds / Baths | Price | Details |
|---|---|---|---|---|---|

|
#41
Brookcrest Dr
Mason, OH 45040
|
960 sq. feet
|
1 baths 3 beds |
show details | |

|
#42
Pogue Ave
Cincinnati, OH 45208
|
1,396 sq. feet
|
1 baths 2 beds |
show details | |

|
#43
Minion Ave
Cincinnati, OH 45205
|
936 sq. feet
|
1 baths 3 beds |
show details | |

|
#44
Heatherwood Ln
Cincinnati, OH 45244
|
1,286 sq. feet
|
2 baths 3 beds |
show details | |

|
#45
Apple Tree Ln
Erlanger, KY 41018
|
1,140 sq. feet
|
1 baths 3 beds |
show details | |

|
#46
Plainfield Rd
Cincinnati, OH 45236
|
936 sq. feet
|
1 baths 2 beds |
show details | |

|
#47
Vinnedge Ave
Fairfield, OH 45014
|
1,080 sq. feet
|
1 baths 3 beds |
show details | |

|
#48
Vinnedge Ave
Fairfield, OH 45014
|
1,238 sq. feet
|
1 baths 2 beds |
show details | |

|
#49
Virginia Ave
Cincinnati, OH 45236
|
985 sq. feet
|
1 baths 3 beds |
show details | |

|
Check over 1 million property listings on Foreclosure.com!
|
browse all offers | |||


 | second tier schools in cincinnati suburbs and close to downtown Cincy (11 replies) |
| Chicago to Dayton... Any pointers, opinions, advice? (52 replies) |
| Relocating to Cincinnati...Autism family, Ohio Vs. Northern Ky.... (8 replies) |
| My thoughts on Cincinnati: considering relocating (164 replies) |
| Which neighborhoods will gentrify in the next ten years? (112 replies) |
| Nice Evening in Cincy (10 replies) |

Median year apartment built: 1973
Household type by relationship:
Households: 6,926- Male householders: 1,159 (419 living alone), Female householders: 1,816 (629 living alone)
641 spouses (626 opposite-sex spouses), 253 unmarried partners, (253 opposite-sex unmarried partners), 2,157 children (1,990 natural, 41 adopted, 124 stepchildren), 280 grandchildren, 137 brothers or sisters, 96 parents, 3 foster children, 109 other relatives, 42 non-relatives
- In group quarters: 228
Size of family households: 848 2-persons, 548 3-persons, 327 4-persons, 55 5-persons, 41 6-persons, 2 7-or-more-persons.
Size of nonfamily households: 1,044 1-person, 161 2-persons, 11 3-persons.
360 married couples with children.
866 single-parent households (231 men, 635 women).
96.6% of residents of Mount Healthy speak English at home.
3.0% of residents speak Spanish at home (77% speak English very well, 23% speak English not well).
0.6% of residents speak Asian or Pacific Island language at home (100% speak English very well).
0.1% of residents speak other language at home (100% speak English well).
Foreign born population: 89 (1.3%)
(77.5% of them are naturalized citizens)
| Here: | 6.0 |
| State: | 6.7 |
| Here: | 4.0 |
| State: | 4.4 |

- Bedrooms in owner-occupied houses and condos in Mount Healthy, Ohio
- 0no bedroom
- 681 bedroom
- 4712 bedrooms
- 5433 bedrooms
- 2914 bedrooms
- 05+ bedrooms

- Bedrooms in renter-occupied apartments in Mount Healthy, Ohio
- 40no bedroom
- 6581 bedroom
- 5912 bedrooms
- 2823 bedrooms
- 1034 bedrooms
- 05+ bedrooms

- Cars and other vehicles available in Mount Healthy in owner-occupied houses/condos
- 59no vehicle
- 4411 vehicle
- 5592 vehicles
- 2503 vehicles
- 194 vehicles
- 445+ vehicles

- Cars and other vehicles available in Mount Healthy in renter-occupied apartments
- 431no vehicle
- 7261 vehicle
- 3892 vehicles
- 823 vehicles
- 474 vehicles
- 05+ vehicles

- Rooms in owner-occupied houses in Mount Healthy, Ohio
- 01 room
- 02 rooms
- 503 rooms
- 1024 rooms
- 3395 rooms
- 3686 rooms
- 3347 rooms
- 728 rooms
- 1089+ rooms

- Rooms in renter-occupied apartments in Mount Healthy, Ohio
- 401 room
- 1552 rooms
- 3893 rooms
- 4254 rooms
- 2955 rooms
- 2826 rooms
- 37 rooms
- 338 rooms
- 539+ rooms


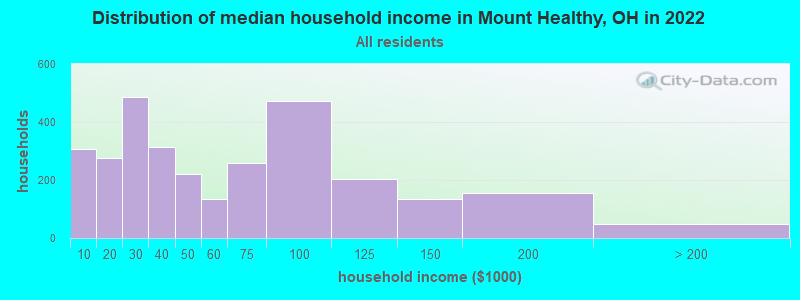
Mount Healthy, OH household income distribution

- 308Less than $10,000
- 277$10,000 to $19,999
- 487$20,000 to $29,999
- 315$30,000 to $39,999
- 221$40,000 to $49,999
- 134$50,000 to $59,999
- 258$60,000 to $74,999
- 471$75,000 to $99,999
- 203$100,000 to $124,999
- 136$125,000 to $149,999
- 155$150,000 to $199,999
- 49$200,000 or more
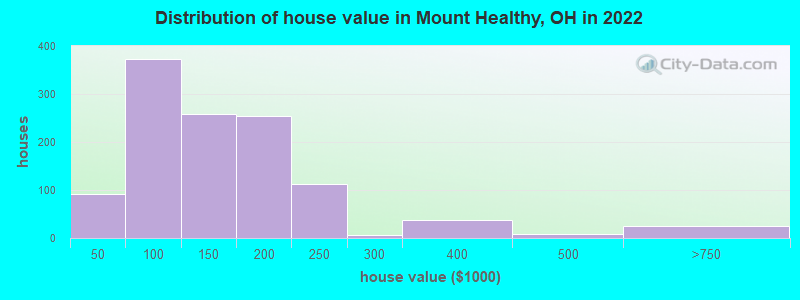
Home value of owner - occupied houses in 2022 in Mount Healthy, OH
-
- 13Less than $10,000
- 30$10,000 to $14,999
- 34$15,000 to $19,999
- 12$40,000 to $49,999
- 5$50,000 to $59,999
- 28$60,000 to $69,999
- 216$80,000 to $89,999
- 108$90,000 to $99,999
- 133$100,000 to $124,999
- 124$125,000 to $149,999
- 189$150,000 to $174,999
- 66$175,000 to $199,999
- 111$200,000 to $249,999
- 7$250,000 to $299,999
- 37$300,000 to $399,999
- 8$400,000 to $499,999
- 26$500,000 to $749,999
Rent paid by renters in 2022 in Mount Healthy, OH
-
- 32$100 to $149
- 46$200 to $249
- 11$250 to $299
- 46$300 to $349
- 21$350 to $399
- 60$400 to $449
- 52$500 to $549
- 179$550 to $599
- 26$650 to $699
- 63$700 to $749
- 46$750 to $799
- 369$800 to $899
- 127$900 to $999
- 334$1,000 to $1,249
- 46$1,250 to $1,499
- 39No cash rent

Percentage of workers working in this county: 85.8%
Number of people working at home: 256 (8.4% of all workers)
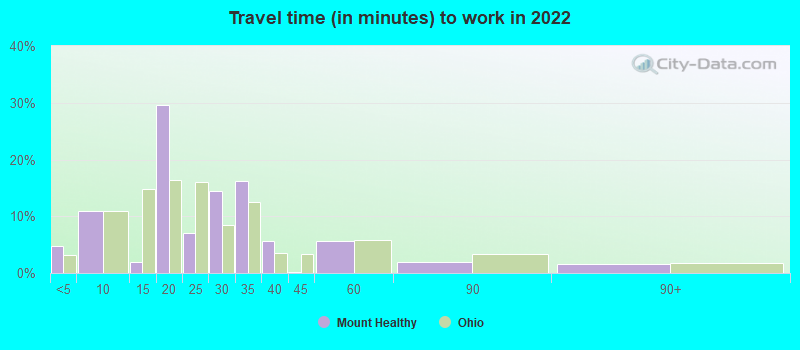
Travel time to work (commute)
- Less than 5 minutes: 94
- 5 to 9 minutes: 96
- 10 to 14 minutes: 219
- 15 to 19 minutes: 252
- 20 to 24 minutes: 729
- 25 to 29 minutes: 216
- 30 to 34 minutes: 688
- 35 to 39 minutes: 215
- 40 to 44 minutes: 62
- 45 to 59 minutes: 111
- 60 to 89 minutes: 24
- 90 or more minutes: 27
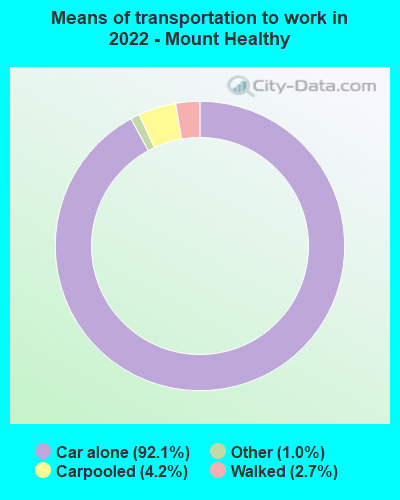
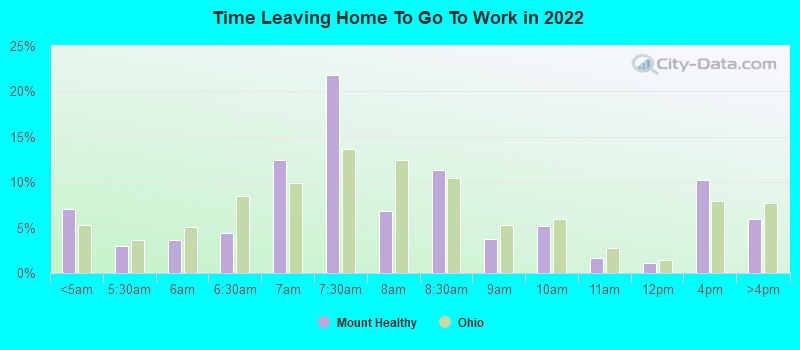
Means of transportation to work:
- Drove a car alone: 1,476 (78.8%)
- Carpooled: 70 (3.7%)
- Taxi: 22 (1.2%)
- Walked: 45 (2.4%)
- Worked at home: 256 (13.7%)
- Unemployment by race in 2022
- Unemployment rate for White non-Hispanic residents
- 6.1%Males
- 1.5%Females
- Unemployment rate for Black residents
- 14.9%Males

- Year of entry for the foreign-born population in Mount Healthy, Ohio
- 92010 or later
- 332000 to 2009
- 331990 to 1999
- 181980 to 1989
- 181970 to 1979
- 68Before 1970
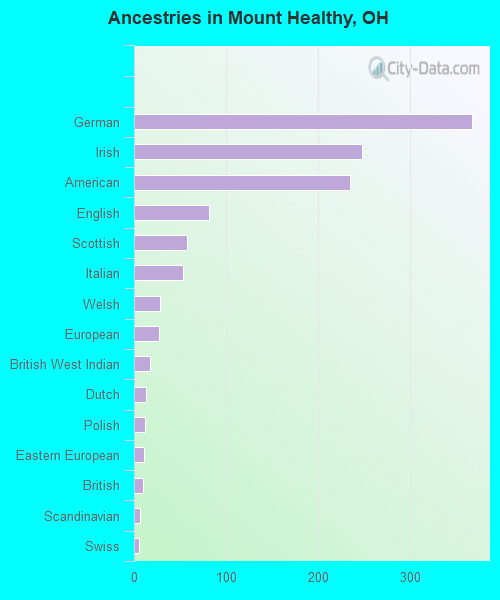
First ancestries reported:
- German: 367 (8.9%)
- Irish: 247 (6.0%)
- American: 234 (5.7%)
- English: 81 (2.0%)
- Scottish: 58 (1.4%)
- Italian: 53 (1.3%)
- Welsh: 28 (0.7%)
- European: 27 (0.7%)
- British West Indian: 17 (0.4%)
- Dutch: 13 (0.3%)
- Polish: 12 (0.3%)
- Eastern European: 11 (0.3%)
- British: 10 (0.2%)
- Scandinavian: 6 (0.1%)
- Swiss: 5 (0.1%)
Most common places of birth for foreign-born residents (%):
| Mount Healthy: | 25.3% (23) |
| Ohio: | 0.7% (3,920) |
| Mount Healthy: | 20.9% (19) |
| Ohio: | 0.1% (482) |
| Mount Healthy: | 17.6% (16) |
| Ohio: | 11.6% (66,525) |
| Mount Healthy: | 13.2% (12) |
| Ohio: | 3.1% (17,818) |
| Mount Healthy: | 9.9% (9) |
| Ohio: | 0.8% (4,549) |
| Mount Healthy: | 5.5% (5) |
| Ohio: | 6.2% (35,703) |
| Mount Healthy: | 5.5% (5) |
| Ohio: | 0.6% (3,210) |
Place of birth for U.S.-born residents:
- This state: 5,507
- Other state: 1,197
- Northeast: 154
- Midwest: 292
- South: 704
- West: 45
90.1% of Mount Healthy residents lived in the same house 1 years ago.
Out of people who lived in different houses, 41.4% lived in this county.
Out of people who lived in different counties, 22.4% lived in Ohio.
| Mount Healthy: | 90.1% |
| State average: | 87.8% |
Education attainment for males 25 years and older:
- No schooling: 33
- Nursery to 4th grade: 0
- 5th and 6th grade: 1
- 7th and 8th grade: 3
- 9th grade: 15
- 10th grade: 7
- 11th grade: 30
- 12th grade, no diploma: 34
- High school graduate (or equivalency): 766
- Less than 1 year of college: 115
- Some college more than 1 year, no degree: 380
- Associate degree: 231
- Bachelor's degree: 276
- Master's degree: 43
- Professional school degree: 0
- Doctorate degree: 0

Education attainment for females 25 years and older:
- No schooling: 17
- Nursery to 4th grade: 0
- 5th and 6th grade: 15
- 7th and 8th grade: 51
- 9th grade: 21
- 10th grade: 28
- 11th grade: 55
- 12th grade, no diploma: 45
- High school graduate (or equivalency): 1,063
- Less than 1 year of college: 84
- Some college more than 1 year, no degree: 477
- Associate degree: 491
- Bachelor's degree: 332
- Master's degree: 97
- Professional school degree: 22
- Doctorate degree: 11


Housing units in structures:
- One, detached: 1,711
- One, attached: 160
- Two: 150
- 3 or 4: 284
- 5 to 9: 297
- 10 to 19: 156
- 20 to 49: 35
- 50 or more: 322
- Mobile homes: 147
Median worth of mobile homes: $8,498
Housing units lacking complete kitchen facilities in 2022: 0.9%
House/condo owner moved in on average 14 years ago
Renter moved in on average 6 years ago

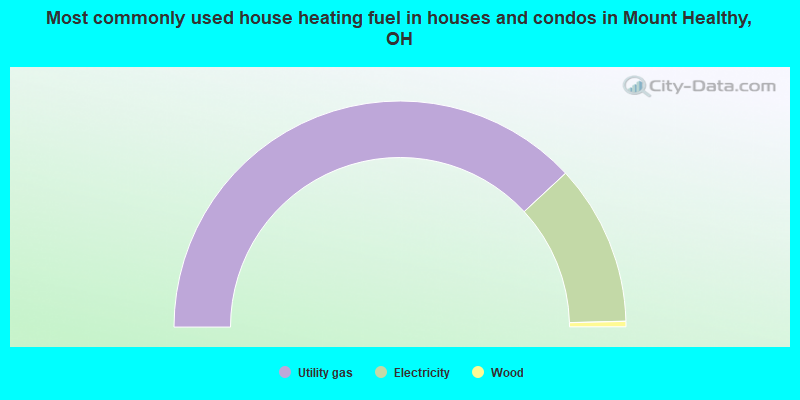
- 76.2%Utility gas
- 23.0%Electricity
- 0.8%Wood
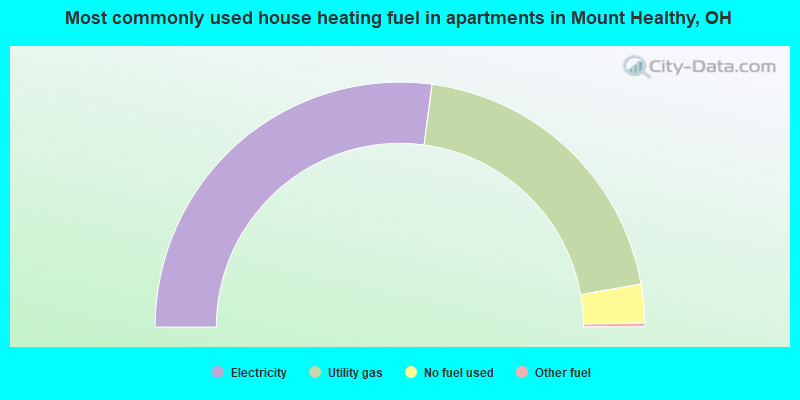
- 54.2%Electricity
- 40.2%Utility gas
- 5.1%No fuel used
- 0.5%Other fuel
Private vs. public school enrollment:
| Here: | 24.7% |
| Ohio: | 16.0% |
| Here: | 52.6% |
| Ohio: | 13.1% |
| Here: | 10.2% |
| Ohio: | 22.3% |


