Mount Morris, IL (Illinois) Houses and Residents
| Mount Morris: | $129,115 |
| Illinois: | $251,600 |
Mean price in 2022:
Detached houses: $141,180
Here: $141,180 State: $310,164 Townhouses or other attached units: $213,271
Here: $213,271 State: $286,230
Total population: 2,905 (Urban population: 2,890 (all inside urban clusters), Rural population: 35 (all nonfarm))
Houses: 1,512 (1,407 occupied: 941 owner occupied, 484 renter occupied)
| % of renters here: | 34% |
| State: | 33% |
Housing density: 1,297 houses/condos per square mile
Median price asked for vacant for-sale houses and condos in 2022 in this county: $112,424.
Median contract rent in 2022: $420 (lower quartile is $376, upper quartile is $596)
Median rent asked for vacant for-rent units in 2022: $350
Median gross rent in Mount Morris, IL in 2022: $484
Housing units in Mount Morris with a mortgage: 496 (0 second mortgage, 0 home equity loan, 0 both second mortgage and home equity loan)
Houses without a mortgage: 37
Median household income for houses/condos with a mortgage: $60,832
Median household income for apartments without a mortgage: $62,984
Median monthly housing costs: $604
Compare current foreclosures near Mount Morris, IL:
| Photo | Address | Area | Beds / Baths | Price | Details |
|---|---|---|---|---|---|

|
#1
S Mckendrie Ave
Mount Morris, IL 61054
|
2 sq. feet
|
2 baths 3 beds |
show details | |

|
#2
S Ogle Ave Apt 2
Mount Morris, IL 61054
|
- sq. feet
|
- baths - beds |
show details | |

|
#3
N Mckendrie Ave
Mount Morris, IL 61054
|
- sq. feet
|
- baths - beds |
show details | |

|
#4
W Lincoln St Apt 2w
Mount Morris, IL 61054
|
- sq. feet
|
- baths - beds |
show details | |

|
#5
W Lincoln St Apt 3w
Mount Morris, IL 61054
|
- sq. feet
|
- baths - beds |
show details | |

|
#6
W 1st St
Mount Morris, IL 61054
|
- sq. feet
|
- baths - beds |
show details | |

|
#7
W Lincoln St
Mount Morris, IL 61054
|
- sq. feet
|
- baths - beds |
show details | |

|
#8
W Hitt St
Mount Morris, IL 61054
|
- sq. feet
|
- baths - beds |
show details | |

|
#9
N Mckendrie Ave
Mount Morris, IL 61054
|
- sq. feet
|
- baths - beds |
show details | |

|
#10
W Mud Creek Rd
Mount Morris, IL 61054
|
- sq. feet
|
- baths - beds |
show details |
| Photo | Address | Area | Beds / Baths | Price | Details |
|---|---|---|---|---|---|

|
#11
Hill St
Mount Morris, IL 61054
|
- sq. feet
|
- baths - beds |
show details | |

|
#12
W Front St
Mount Morris, IL 61054
|
- sq. feet
|
- baths - beds |
show details | |

|
#13
W Fulton St
Polo, IL 61064
|
1,378 sq. feet
|
1 baths 3 beds |
show details | |

|
#14
S 2nd St
Oregon, IL 61061
|
- sq. feet
|
- baths - beds |
$43,900
|
show details |

|
#15
Chicago Ave
Dixon, IL 61021
|
1,000 sq. feet
|
2 baths 3 beds |
show details | |

|
#16
N Ottawa Ave
Dixon, IL 61021
|
- sq. feet
|
1 baths 3 beds |
show details | |

|
#17
W Maple St
Franklin Grove, IL 61031
|
- sq. feet
|
2 baths 6 beds |
show details | |

|
#18
N Main St
Baileyville, IL 61007
|
- sq. feet
|
- baths - beds |
show details | |

|
#19
N Court St Apt A
Dixon, IL 61021
|
- sq. feet
|
- baths - beds |
show details | |

|
#20
Maple Ln
Dixon, IL 61021
|
- sq. feet
|
- baths - beds |
show details |
| Photo | Address | Area | Beds / Baths | Price | Details |
|---|---|---|---|---|---|

|
#21
S Chana Rd
Chana, IL 61015
|
- sq. feet
|
- baths - beds |
show details | |

|
#22
Lowell Park Rd Apt 7e
Dixon, IL 61021
|
- sq. feet
|
- baths - beds |
show details | |

|
#23
E 3rd St
Byron, IL 61010
|
- sq. feet
|
- baths - beds |
show details | |

|
#24
E 5th St Apt 1
Byron, IL 61010
|
- sq. feet
|
- baths - beds |
show details | |

|
#25
W Lincoln St
Stillman Valley, IL 61084
|
- sq. feet
|
- baths - beds |
show details | |

|
#26
Jay Dee Ave
Dixon, IL 61021
|
- sq. feet
|
- baths - beds |
show details | |

|
#27
E 2nd St
Dixon, IL 61021
|
- sq. feet
|
- baths - beds |
show details | |

|
#28
E 5th St
Dixon, IL 61021
|
- sq. feet
|
- baths - beds |
show details | |

|
#29
1/2 W 3rd St
Dixon, IL 61021
|
- sq. feet
|
- baths - beds |
show details | |

|
#30
Carondelet Rd # 1
Dixon, IL 61021
|
- sq. feet
|
- baths - beds |
show details |
| Photo | Address | Area | Beds / Baths | Price | Details |
|---|---|---|---|---|---|

|
#31
W 3rd St
Dixon, IL 61021
|
- sq. feet
|
- baths - beds |
show details | |

|
#32
W 3rd St
Byron, IL 61010
|
- sq. feet
|
- baths - beds |
show details | |

|
#33
W Florence Rd
Baileyville, IL 61007
|
- sq. feet
|
- baths - beds |
show details | |

|
#34
S State St
Franklin Grove, IL 61031
|
- sq. feet
|
- baths - beds |
show details | |

|
#35
Douglas Ave
Ashton, IL 61006
|
- sq. feet
|
- baths - beds |
show details | |

|
#36
White Birch Ln
Davis Junction, IL 61020
|
- sq. feet
|
- baths - beds |
show details | |

|
#37
Minnesota Dr
Dixon, IL 61021
|
- sq. feet
|
- baths - beds |
show details | |

|
#38
Luther Dr Apt 4
Byron, IL 61010
|
- sq. feet
|
- baths - beds |
show details | |

|
#39
Green St
Dixon, IL 61021
|
- sq. feet
|
- baths - beds |
show details | |

|
#40
N Leaf River Rd Apt 1
Leaf River, IL 61047
|
- sq. feet
|
- baths - beds |
show details |
| Photo | Address | Area | Beds / Baths | Price | Details |
|---|---|---|---|---|---|

|
#41
Main St
Leaf River, IL 61047
|
- sq. feet
|
- baths - beds |
show details | |

|
#42
N 5th St
Oregon, IL 61061
|
- sq. feet
|
- baths - beds |
show details | |

|
#43
N 4th St
Oregon, IL 61061
|
- sq. feet
|
- baths - beds |
show details | |

|
#44
S 2nd St
Oregon, IL 61061
|
- sq. feet
|
- baths - beds |
show details | |

|
#45
N Il Route 26
Forreston, IL 61030
|
- sq. feet
|
- baths - beds |
show details | |

|
#46
W Oregon St
Polo, IL 61064
|
- sq. feet
|
- baths - beds |
show details | |

|
#47
W Meadow St
Polo, IL 61064
|
- sq. feet
|
- baths - beds |
show details | |

|
#48
S 2nd Ave
Forreston, IL 61030
|
- sq. feet
|
- baths - beds |
show details | |

|
#49
S 4th Ave
Forreston, IL 61030
|
- sq. feet
|
- baths - beds |
show details | |

|
Check over 1 million property listings on Foreclosure.com!
|
browse all offers | |||


Median year apartment built: 1963
Household type by relationship:
Households: 2,813- Male householders: 671 (330 living alone), Female householders: 710 (415 living alone)
376 spouses (334 opposite-sex spouses), 93 unmarried partners, (93 opposite-sex unmarried partners), 728 children (638 natural, 90 adopted, 0 stepchildren), 6 grandchildren, 31 brothers or sisters, 26 parents, 0 foster children, 0 other relatives, 54 non-relatives
- In group quarters: 113
Size of family households: 352 2-persons, 83 3-persons, 21 4-persons, 81 5-persons, 54 6-persons.
Size of nonfamily households: 785 1-person, 55 2-persons.
411 married couples with children.
224 single-parent households (0 men, 224 women).
99.8% of residents of Mount Morris speak English at home.
0.7% of residents speak other Indo-European language at home (100% speak English very well).
0.2% of residents speak Asian or Pacific Island language at home (100% speak English not well).
Foreign born population: 62 (2.2%)
(88.7% of them are naturalized citizens)
| Here: | 7.0 |
| State: | 6.4 |
| Here: | 3.5 |
| State: | 4.1 |

- Bedrooms in owner-occupied houses and condos in Mount Morris, Illinois
- 0no bedroom
- 181 bedroom
- 2182 bedrooms
- 4183 bedrooms
- 2534 bedrooms
- 345+ bedrooms

- Bedrooms in renter-occupied apartments in Mount Morris, Illinois
- 34no bedroom
- 2191 bedroom
- 1072 bedrooms
- 1103 bedrooms
- 154 bedrooms
- 05+ bedrooms

- Cars and other vehicles available in Mount Morris in owner-occupied houses/condos
- 17no vehicle
- 4061 vehicle
- 3802 vehicles
- 173 vehicles
- 1214 vehicles
- 05+ vehicles

- Cars and other vehicles available in Mount Morris in renter-occupied apartments
- 197no vehicle
- 2041 vehicle
- 132 vehicles
- 703 vehicles
- 04 vehicles
- 05+ vehicles

- Rooms in owner-occupied houses in Mount Morris, Illinois
- 01 room
- 02 rooms
- 153 rooms
- 854 rooms
- 2265 rooms
- 516 rooms
- 1877 rooms
- 658 rooms
- 3119+ rooms

- Rooms in renter-occupied apartments in Mount Morris, Illinois
- 341 room
- 162 rooms
- 1823 rooms
- 1524 rooms
- 135 rooms
- 266 rooms
- 177 rooms
- 158 rooms
- 289+ rooms


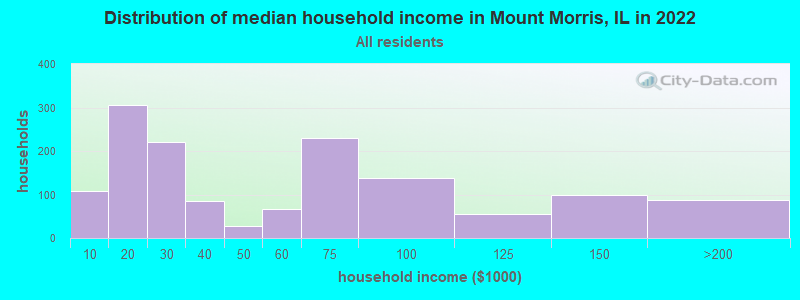
Mount Morris, IL household income distribution

- 108Less than $10,000
- 305$10,000 to $19,999
- 221$20,000 to $29,999
- 85$30,000 to $39,999
- 28$40,000 to $49,999
- 66$50,000 to $59,999
- 229$60,000 to $74,999
- 137$75,000 to $99,999
- 56$100,000 to $124,999
- 99$125,000 to $149,999
- 88$150,000 to $199,999
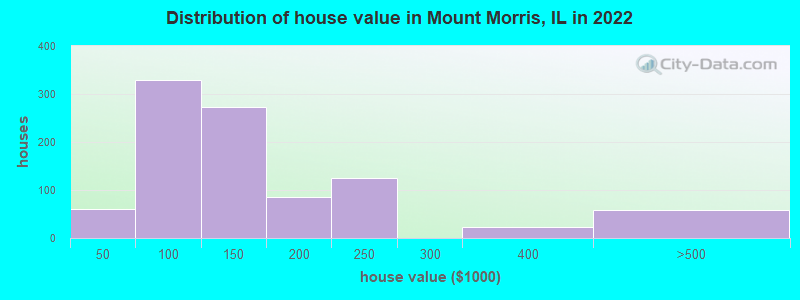
Home value of owner - occupied houses in 2022 in Mount Morris, IL
-
- 59$40,000 to $49,999
- 14$50,000 to $59,999
- 17$60,000 to $69,999
- 199$80,000 to $89,999
- 37$90,000 to $99,999
- 133$100,000 to $124,999
- 138$125,000 to $149,999
- 26$150,000 to $174,999
- 58$175,000 to $199,999
- 124$200,000 to $249,999
- 22$300,000 to $399,999
- 57$400,000 to $499,999
Rent paid by renters in 2022 in Mount Morris, IL
-
- 16$100 to $149
- 40$200 to $249
- 101$350 to $399
- 194$400 to $449
- 13$450 to $499
- 14$550 to $599
- 48$600 to $649
- 12$700 to $749
- 16$900 to $999
- 15$1,500 to $1,999
- 26$2,000 to $2,499
- 15No cash rent


Percentage of workers working in this county: 55.3%
Number of people working at home: 52 (4.5% of all workers)
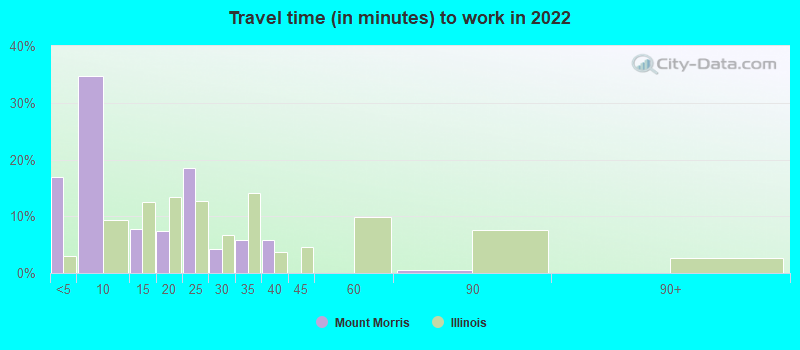
Travel time to work (commute)
- Less than 5 minutes: 56
- 5 to 9 minutes: 68
- 10 to 14 minutes: 217
- 15 to 19 minutes: 302
- 20 to 24 minutes: 72
- 25 to 29 minutes: 88
- 30 to 34 minutes: 83
- 35 to 39 minutes: 46
- 40 to 44 minutes: 29
- 45 to 59 minutes: 69
- 60 to 89 minutes: 0
- 90 or more minutes: 49
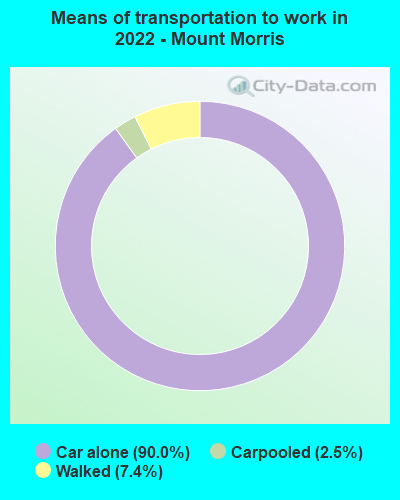
Means of transportation to work:
- Drove a car alone: 538 (81.5%)
- Carpooled: 15 (2.3%)
- Walked: 43 (6.5%)
- Worked at home: 54 (8.2%)

- Unemployment by race in 2022
- Unemployment rate for White non-Hispanic residents
- 9.0%Females

- Year of entry for the foreign-born population in Mount Morris, Illinois
- 82010 or later
- 452000 to 2009
- 01990 to 1999
- 121980 to 1989
- 171970 to 1979
- 8Before 1970

First ancestries reported:
- Norwegian: 297 (24.5%)
- German: 228 (18.8%)
- Italian: 205 (16.9%)
- American: 44 (3.6%)
- Swedish: 39 (3.2%)
- English: 34 (2.8%)
- Polish: 30 (2.5%)
- Czech: 27 (2.2%)
- Welsh: 14 (1.2%)
- French: 13 (1.1%)
- Irish: 13 (1.1%)
- Russian: 3 (0.2%)
Most common places of birth for foreign-born residents (%):
| Mount Morris: | 93.5% (58) |
| Illinois: | 0.9% (15,679) |
| Mount Morris: | 9.7% (6) |
| Illinois: | 5.2% (93,003) |
| Mount Morris: | 9.7% (6) |
| Illinois: | 0.5% (8,551) |
Place of birth for U.S.-born residents:
- This state: 1,932
- Other state: 799
- Northeast: 29
- Midwest: 501
- South: 202
- West: 65
95.3% of Mount Morris residents lived in the same house 1 years ago.
Out of people who lived in different houses, 30.9% lived in this county.
Out of people who lived in different counties, 50.0% lived in Illinois.
| Mount Morris: | 95.3% |
| State average: | 88.3% |
Education attainment for males 25 years and older:
- No schooling: 0
- Nursery to 4th grade: 0
- 5th and 6th grade: 0
- 7th and 8th grade: 0
- 9th grade: 71
- 10th grade: 53
- 11th grade: 0
- 12th grade, no diploma: 0
- High school graduate (or equivalency): 353
- Less than 1 year of college: 46
- Some college more than 1 year, no degree: 42
- Associate degree: 165
- Bachelor's degree: 108
- Master's degree: 65
- Professional school degree: 34
- Doctorate degree: 0

Education attainment for females 25 years and older:
- No schooling: 0
- Nursery to 4th grade: 0
- 5th and 6th grade: 0
- 7th and 8th grade: 95
- 9th grade: 0
- 10th grade: 35
- 11th grade: 19
- 12th grade, no diploma: 23
- High school graduate (or equivalency): 329
- Less than 1 year of college: 14
- Some college more than 1 year, no degree: 252
- Associate degree: 73
- Bachelor's degree: 117
- Master's degree: 79
- Professional school degree: 33
- Doctorate degree: 0


Housing units in structures:
- One, detached: 1,016
- One, attached: 89
- Two: 21
- 3 or 4: 61
- 5 to 9: 18
- 10 to 19: 16
- 20 to 49: 231
- 50 or more: 18
- Mobile homes: 41
Housing units lacking complete kitchen facilities in 2022: 8.6%
House/condo owner moved in on average 14 years ago
Renter moved in on average 8 years ago

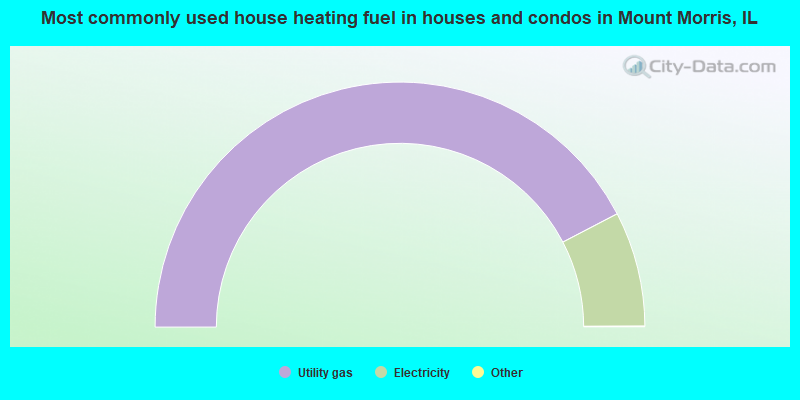
- 84.8%Utility gas
- 15.2%Electricity
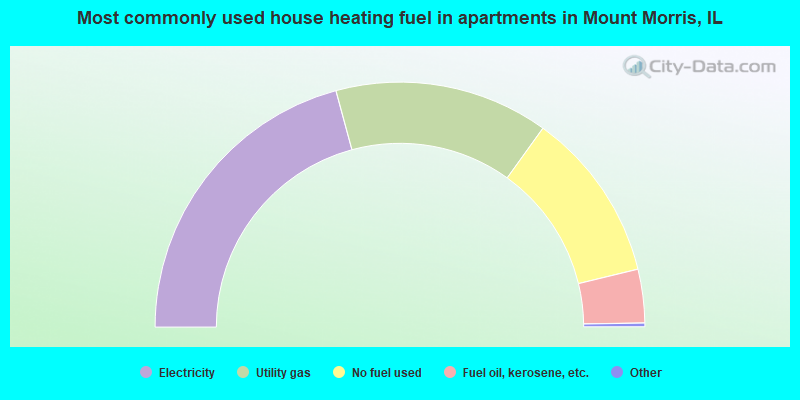
- 41.8%Electricity
- 28.4%Utility gas
- 22.7%No fuel used
- 7.1%Fuel oil, kerosene, etc.
Private vs. public school enrollment:
| Here: | 0.0% |
| Illinois: | 13.3% |
| Here: | 0.0% |
| Illinois: | 27.4% |


