Mount Pleasant, TN (Tennessee) Houses and Residents
| Mount Pleasant: | $258,786 |
| Tennessee: | $284,800 |
Total population: 4,709 (Urban population: 3,611 (all inside urban clusters), Rural population: 759 (34 farm, 725 nonfarm))
Houses: 2,361 (2,133 occupied: 1,315 owner occupied, 822 renter occupied)
| % of renters here: | 38% |
| State: | 33% |
Housing density: 214 houses/condos per square mile
Median price asked for vacant for-sale houses and condos in 2022: $602,078.
Median contract rent in 2022: $570 (lower quartile is $356, upper quartile is $720)
Median rent asked for vacant for-rent units in 2022: $1,077
Median gross rent in Mount Pleasant, TN in 2022: $694
Housing units in Mount Pleasant with a mortgage: 725 (41 second mortgage, 10 home equity loan, 31 both second mortgage and home equity loan)
Houses without a mortgage: 35
Median household income for houses/condos with a mortgage: $53,297
Median household income for apartments without a mortgage: $72,738
Median monthly housing costs: $751
Compare current foreclosures in Mount Pleasant, TN:
| Photo | Address | Area | Beds / Baths | Price | Details |
|---|---|---|---|---|---|

|
#1
Florida Ave
Mount Pleasant, TN 38474
|
- sq. feet
|
1 baths 2 beds |
show details | |

|
#2
Carpenter St
Mount Pleasant, TN 38474
|
912 sq. feet
|
1 baths - beds |
show details | |

|
#3
Railroad St
Mount Pleasant, TN 38474
|
1,342 sq. feet
|
1 baths - beds |
show details | |

|
#4
W Sheepneck Rd
Mount Pleasant, TN 38474
|
984 sq. feet
|
2 baths - beds |
show details | |

|
#5
Washington Ave
Mount Pleasant, TN 38474
|
1,514 sq. feet
|
1 baths - beds |
show details | |

|
#6
Greenwood St
Mount Pleasant, TN 38474
|
1,056 sq. feet
|
1 baths - beds |
show details | |

|
#7
Southport Rd
Mount Pleasant, TN 38474
|
1,300 sq. feet
|
1 baths - beds |
show details | |

|
#8
S Main St
Mount Pleasant, TN 38474
|
1,048 sq. feet
|
1 baths - beds |
show details | |

|
#9
Railroad St
Mount Pleasant, TN 38474
|
1,075 sq. feet
|
1 baths - beds |
show details | |

|
#10
Jackson St
Mount Pleasant, TN 38474
|
1,205 sq. feet
|
2 baths - beds |
show details |
| Photo | Address | Area | Beds / Baths | Price | Details |
|---|---|---|---|---|---|

|
#11
S Main St
Mount Pleasant, TN 38474
|
1,556 sq. feet
|
1 baths - beds |
show details | |

|
#12
Brookside Dr
Mount Pleasant, TN 38474
|
1,876 sq. feet
|
2 baths - beds |
show details | |

|
#13
Locust St
Mount Pleasant, TN 38474
|
1,490 sq. feet
|
2 baths - beds |
show details | |

|
#14
W Sheepneck Rd
Mount Pleasant, TN 38474
|
984 sq. feet
|
1 baths - beds |
show details | |

|
#15
Smith Hollow Rd
Mount Pleasant, TN 38474
|
1,008 sq. feet
|
2 baths - beds |
show details | |

|
#16
Hill St
Mount Pleasant, TN 38474
|
754 sq. feet
|
1 baths - beds |
show details | |

|
#17
Olive St
Mount Pleasant, TN 38474
|
1,056 sq. feet
|
1 baths - beds |
show details | |

|
#18
William & Earl Road
Mount Pleasant, TN 38474
|
- sq. feet
|
- baths - beds |
show details | |

|
#19
Mount Joy Rd
Mount Pleasant, TN 38474
|
- sq. feet
|
- baths - beds |
show details | |

|
#20
N High St
Mount Pleasant, TN 38474
|
- sq. feet
|
- baths - beds |
show details |
| Photo | Address | Area | Beds / Baths | Price | Details |
|---|---|---|---|---|---|

|
#21
Highway 166 N
Mount Pleasant, TN 38474
|
- sq. feet
|
- baths - beds |
show details | |

|
#22
Baptist Branch Rd
Mount Pleasant, TN 38474
|
- sq. feet
|
- baths - beds |
show details | |

|
#23
Crowley Hill Rd
Mount Pleasant, TN 38474
|
720 sq. feet
|
- baths - beds |
show details | |

|
#24
Carter St
Mount Pleasant, TN 38474
|
- sq. feet
|
- baths - beds |
show details | |

|
#25
Carpenter St
Mount Pleasant, TN 38474
|
- sq. feet
|
- baths - beds |
show details | |

|
#26
Gardenia St
Mount Pleasant, TN 38474
|
- sq. feet
|
- baths - beds |
show details | |

|
#27
Walton Cir
Mount Pleasant, TN 38474
|
- sq. feet
|
- baths - beds |
show details | |

|
#28
Birdsong Ct
Mount Pleasant, TN 38474
|
- sq. feet
|
- baths - beds |
show details | |

|
#29
N Main St
Mount Pleasant, TN 38474
|
- sq. feet
|
- baths - beds |
show details | |

|
#30
Southport Rd Apt F3
Mount Pleasant, TN 38474
|
- sq. feet
|
- baths - beds |
show details |
| Photo | Address | Area | Beds / Baths | Price | Details |
|---|---|---|---|---|---|

|
#31
Arrow Mines Rd
Mount Pleasant, TN 38474
|
- sq. feet
|
- baths - beds |
show details | |

|
#32
Dry Creek Rd
Mount Pleasant, TN 38474
|
- sq. feet
|
- baths - beds |
show details | |

|
#33
Clarke School Rd
Mount Pleasant, TN 38474
|
- sq. feet
|
- baths - beds |
show details | |

|
Check over 1 million property listings on Foreclosure.com!
|
browse all offers | |||


 | Looking for a progressive community near Knoxville or Nashville (46 replies) |
| Farragut/W Knoxville/Maryville (25 replies) |
| Brentwood, TN and Surrounding Areas (16 replies) |
| Columbia area towns? (20 replies) |
| Potential mother/daughter move to Knoxville area (7 replies) |
| Looking at a house with rental mobiles too Rental info needed (2 replies) |

Median year apartment built: 1972
Household type by relationship:
Households: 5,069- Male householders: 886 (326 living alone), Female householders: 1,233 (430 living alone)
749 spouses (749 opposite-sex spouses), 91 unmarried partners, (91 opposite-sex unmarried partners), 1,412 children (1,224 natural, 121 adopted, 65 stepchildren), 290 grandchildren, 37 brothers or sisters, 34 parents, 0 foster children, 90 other relatives, 166 non-relatives
- In group quarters: 77
Size of family households: 518 2-persons, 386 3-persons, 167 4-persons, 98 5-persons, 11 6-persons, 36 7-or-more-persons.
Size of nonfamily households: 820 1-person, 161 2-persons, 11 3-persons.
386 married couples with children.
310 single-parent households (89 men, 221 women).
99.0% of residents of Mount Pleasant speak English at home.
0.5% of residents speak Spanish at home (100% don't speak English at all).
Foreign born population: 34 (0.7%)
(26.5% of them are naturalized citizens)
| Here: | 6.5 |
| State: | 6.5 |
| Here: | 3.5 |
| State: | 4.4 |

- Bedrooms in owner-occupied houses and condos in Mount Pleasant, Tennessee
- 19no bedroom
- 111 bedroom
- 1412 bedrooms
- 8773 bedrooms
- 2414 bedrooms
- 275+ bedrooms

- Bedrooms in renter-occupied apartments in Mount Pleasant, Tennessee
- 0no bedroom
- 4141 bedroom
- 2982 bedrooms
- 833 bedrooms
- 274 bedrooms
- 05+ bedrooms

- Cars and other vehicles available in Mount Pleasant in owner-occupied houses/condos
- 7no vehicle
- 2751 vehicle
- 6882 vehicles
- 2253 vehicles
- 804 vehicles
- 415+ vehicles

- Cars and other vehicles available in Mount Pleasant in renter-occupied apartments
- 63no vehicle
- 6801 vehicle
- 352 vehicles
- 183 vehicles
- 264 vehicles
- 05+ vehicles

- Rooms in owner-occupied houses in Mount Pleasant, Tennessee
- 191 room
- 02 rooms
- 113 rooms
- 2114 rooms
- 2285 rooms
- 2536 rooms
- 3297 rooms
- 1528 rooms
- 1129+ rooms

- Rooms in renter-occupied apartments in Mount Pleasant, Tennessee
- 01 room
- 1012 rooms
- 3283 rooms
- 1874 rooms
- 1295 rooms
- 606 rooms
- 07 rooms
- 178 rooms
- 09+ rooms


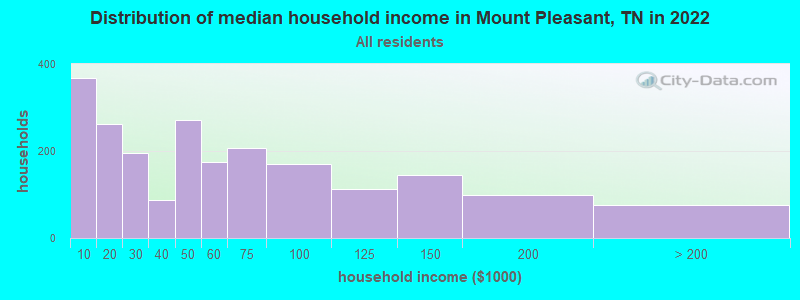
Mount Pleasant, TN household income distribution

- 367Less than $10,000
- 261$10,000 to $19,999
- 196$20,000 to $29,999
- 87$30,000 to $39,999
- 272$40,000 to $49,999
- 175$50,000 to $59,999
- 207$60,000 to $74,999
- 169$75,000 to $99,999
- 113$100,000 to $124,999
- 144$125,000 to $149,999
- 100$150,000 to $199,999
- 75$200,000 or more
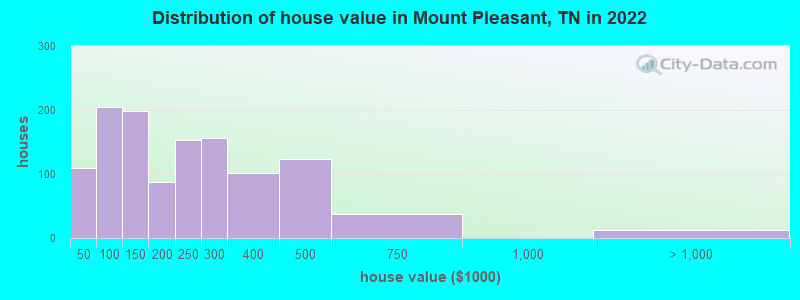
Home value of owner - occupied houses in 2022 in Mount Pleasant, TN
-
- 16Less than $10,000
- 33$30,000 to $34,999
- 58$40,000 to $49,999
- 27$50,000 to $59,999
- 24$60,000 to $69,999
- 7$70,000 to $79,999
- 44$80,000 to $89,999
- 44$90,000 to $99,999
- 26$100,000 to $124,999
- 171$125,000 to $149,999
- 2$150,000 to $174,999
- 84$175,000 to $199,999
- 152$200,000 to $249,999
- 157$250,000 to $299,999
- 100$300,000 to $399,999
- 123$400,000 to $499,999
- 37$500,000 to $749,999
- 11$1,000,000 to $1,499,999
Rent paid by renters in 2022 in Mount Pleasant, TN
-
- 63$100 to $149
- 86$250 to $299
- 40$300 to $349
- 33$350 to $399
- 64$400 to $449
- 42$450 to $499
- 35$500 to $549
- 13$550 to $599
- 92$600 to $649
- 100$650 to $699
- 27$700 to $749
- 3$750 to $799
- 7$800 to $899
- 114$1,000 to $1,249
- 25No cash rent


Percentage of workers working in this county: 83.3%
Number of people working at home: 172 (8.3% of all workers)
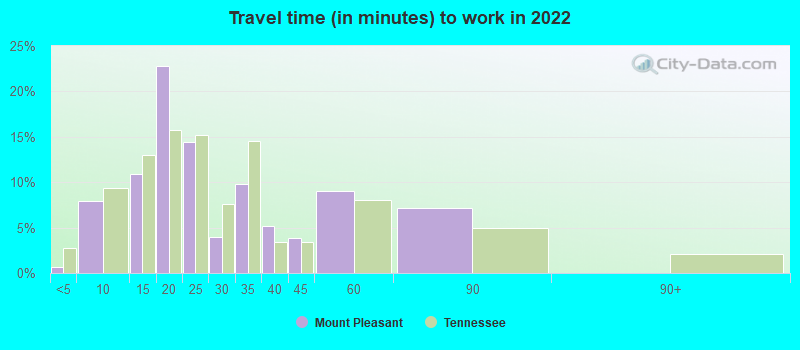
Travel time to work (commute)
- Less than 5 minutes: 23
- 5 to 9 minutes: 63
- 10 to 14 minutes: 199
- 15 to 19 minutes: 546
- 20 to 24 minutes: 172
- 25 to 29 minutes: 145
- 30 to 34 minutes: 289
- 35 to 39 minutes: 51
- 40 to 44 minutes: 114
- 45 to 59 minutes: 191
- 60 to 89 minutes: 102
- 90 or more minutes: 0
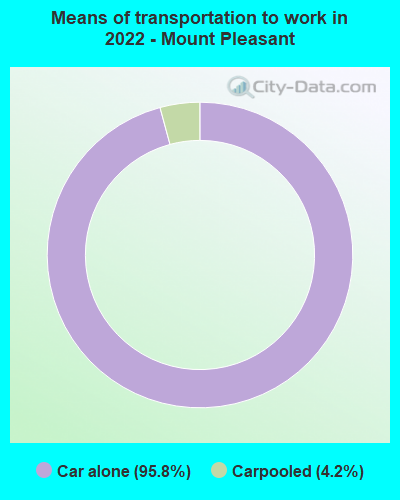
Means of transportation to work:
- Drove a car alone: 1,730 (85.6%)
- Carpooled: 80 (4.0%)
- Worked at home: 172 (8.5%)

- Unemployment by race in 2022
- Unemployment rate for White non-Hispanic residents
- 1.4%Males
- 6.6%Females
- Unemployment rate for Black residents
- 1.2%Females

First ancestries reported:
- American: 648 (24.9%)
- English: 365 (14.1%)
- African: 189 (7.3%)
- Irish: 146 (5.6%)
- German: 47 (1.8%)
- Scottish: 20 (0.8%)
- Dutch: 11 (0.4%)
- Canadian: 9 (0.3%)
- French: 8 (0.3%)
Most common places of birth for foreign-born residents (%):
| Mount Pleasant: | 64.9% (24) |
| Tennessee: | 23.0% (86,435) |
| Mount Pleasant: | 27.0% (10) |
| Tennessee: | 2.7% (10,295) |
Place of birth for U.S.-born residents:
- This state: 4,157
- Other state: 883
- Northeast: 159
- Midwest: 289
- South: 407
- West: 37
91.4% of Mount Pleasant residents lived in the same house 1 years ago.
Out of people who lived in different houses, 20.3% lived in this county.
Out of people who lived in different counties, 73.2% lived in Tennessee.
| Mount Pleasant: | 91.4% |
| State average: | 87.0% |
Education attainment for males 25 years and older:
- No schooling: 34
- Nursery to 4th grade: 0
- 5th and 6th grade: 7
- 7th and 8th grade: 0
- 9th grade: 7
- 10th grade: 35
- 11th grade: 24
- 12th grade, no diploma: 0
- High school graduate (or equivalency): 994
- Less than 1 year of college: 152
- Some college more than 1 year, no degree: 215
- Associate degree: 61
- Bachelor's degree: 67
- Master's degree: 41
- Professional school degree: 0
- Doctorate degree: 0

Education attainment for females 25 years and older:
- No schooling: 7
- Nursery to 4th grade: 0
- 5th and 6th grade: 27
- 7th and 8th grade: 14
- 9th grade: 13
- 10th grade: 45
- 11th grade: 36
- 12th grade, no diploma: 27
- High school graduate (or equivalency): 1,058
- Less than 1 year of college: 69
- Some college more than 1 year, no degree: 128
- Associate degree: 118
- Bachelor's degree: 298
- Master's degree: 96
- Professional school degree: 10
- Doctorate degree: 0


Housing units in structures:
- One, detached: 1,576
- One, attached: 19
- Two: 139
- 3 or 4: 188
- 5 to 9: 123
- 10 to 19: 62
- 20 to 49: 36
- Mobile homes: 202
- Boats, RVs, vans, etc.: 10
House/condo owner moved in on average 13 years ago
Renter moved in on average 3 years ago

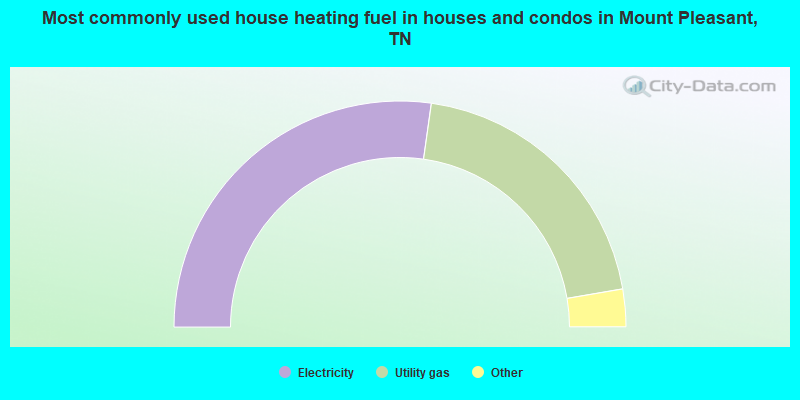
- 54.5%Electricity
- 40.2%Utility gas
- 2.4%Fuel oil, kerosene, etc.
- 1.5%Bottled, tank, or LP gas
- 1.5%Wood
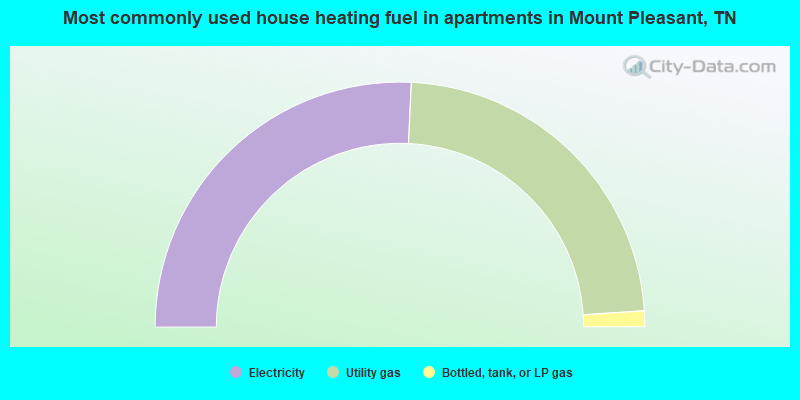
- 51.5%Electricity
- 46.4%Utility gas
- 2.1%Bottled, tank, or LP gas
Private vs. public school enrollment:
| Here: | 0.0% |
| Tennessee: | 15.0% |
| Here: | 0.0% |
| Tennessee: | 16.2% |
| Here: | 16.0% |
| Tennessee: | 23.5% |


