Mount Pocono, PA (Pennsylvania) Houses and Residents
| Mount Pocono: | $236,165 |
| Pennsylvania: | $245,500 |
Mean price in 2022:
Detached houses: $227,471
Here: $227,471 State: $317,202 Townhouses or other attached units: $180,044
Here: $180,044 State: $254,369 In 5-or-more-unit structures: $126,887
Here: $126,887 State: $320,068
Total population: 3,077 (Urban population: 2,565 (all inside urban clusters), Rural population: 177 (all nonfarm))
Houses: 1,179 (1,128 occupied: 717 owner occupied, 385 renter occupied)
| % of renters here: | 35% |
| State: | 31% |
Housing density: 341 houses/condos per square mile
Median price asked for vacant for-sale houses and condos in 2022 in this county: $412,877.
Median contract rent in 2022: $878 (lower quartile is $675, upper quartile is $1,198)
Median rent asked for vacant for-rent units in 2022: $745
Median gross rent in Mount Pocono, PA in 2022: $-608,187,133
Housing units in Mount Pocono with a mortgage: 396 (13 second mortgage, 0 home equity loan, 11 both second mortgage and home equity loan)
Houses without a mortgage: 0
Median household income for houses/condos with a mortgage: $124,100
Median household income for apartments without a mortgage: $93,129
Median monthly housing costs: $1,342
Compare current foreclosures near Mount Pocono, PA:
| Photo | Address | Area | Beds / Baths | Price | Details |
|---|---|---|---|---|---|

|
#1
Winona Rd
Mount Pocono, PA 18344
|
1,440 sq. feet
|
2 baths 3 beds |
show details | |

|
#2
Manor View Ave
Mount Pocono, PA 18344
|
2,002 sq. feet
|
2 baths 4 beds |
show details | |

|
#3
Winona Rd
Mount Pocono, PA 18344
|
1,936 sq. feet
|
2 baths 2 beds |
show details | |

|
#4
Candlewood Ln
Mount Pocono, PA 18344
|
2,132 sq. feet
|
2 baths 4 beds |
show details | |

|
#5
Park Ave
Mount Pocono, PA 18344
|
1,504 sq. feet
|
1 baths 3 beds |
show details | |

|
#6
Knob Rd Apt 311
Mount Pocono, PA 18344
|
- sq. feet
|
- baths - beds |
show details | |

|
#7
Foxfire Dr
Mount Pocono, PA 18344
|
- sq. feet
|
- baths - beds |
show details | |

|
#8
Kinney Ave
Mount Pocono, PA 18344
|
- sq. feet
|
- baths - beds |
show details | |

|
#9
Stonegate Ct
Mount Pocono, PA 18344
|
- sq. feet
|
- baths - beds |
show details | |

|
#10
Bell Ter
Stroudsburg, PA 18360
|
1,400 sq. feet
|
1 baths 5 beds |
$362,500
|
show details |
| Photo | Address | Area | Beds / Baths | Price | Details |
|---|---|---|---|---|---|

|
#11
Hickory St
Cresco, PA 18326
|
1,152 sq. feet
|
1 baths 3 beds |
$286,500
|
show details |

|
#12
Allegheny Dr
Blakeslee, PA 18610
|
2,095 sq. feet
|
2 baths 4 beds |
$314,900
|
show details |

|
#13
Mountain Rd
Albrightsville, PA 18210
|
1,421 sq. feet
|
1 baths 3 beds |
$299,500
|
show details |

|
#14
Lilac Dr
East Stroudsburg, PA 18301
|
2,272 sq. feet
|
2 baths 5 beds |
$345,000
|
show details |

|
#15
Pleasant Ridge Rd
East Stroudsburg, PA 18302
|
3,467 sq. feet
|
5 baths 4 beds |
$541,500
|
show details |

|
#16
Meadowlark Dr # G517
Tobyhanna, PA 18466
|
1,764 sq. feet
|
2 baths 3 beds |
$65,470
|
show details |

|
#17
Matz Pass
Lake Harmony, PA 18624
|
2,035 sq. feet
|
2 baths 3 beds |
show details | |

|
#18
Olde Mill Run
Stroudsburg, PA 18360
|
3,628 sq. feet
|
3 baths 4 beds |
show details | |

|
#19
Wyndham Dr
Cresco, PA 18326
|
3,050 sq. feet
|
2 baths 4 beds |
show details | |

|
#20
Maple Cir
Greentown, PA 18426
|
1,248 sq. feet
|
2 baths 3 beds |
show details |
| Photo | Address | Area | Beds / Baths | Price | Details |
|---|---|---|---|---|---|

|
#21
Little Billy Ln
Tobyhanna, PA 18466
|
- sq. feet
|
1 baths 2 beds |
show details | |

|
#22
Woodland Dr
Tobyhanna, PA 18466
|
1,792 sq. feet
|
3 baths 4 beds |
show details | |

|
#23
Country Place Dr
Tobyhanna, PA 18466
|
- sq. feet
|
2 baths 4 beds |
show details | |

|
#24
Squirrel Ln
Cresco, PA 18326
|
934 sq. feet
|
1 baths 2 beds |
show details | |

|
#25
Twin Oak Ter
Tannersville, PA 18372
|
1,184 sq. feet
|
1 baths 2 beds |
show details | |

|
#26
Fairhaven Dr
Tobyhanna, PA 18466
|
1,881 sq. feet
|
1 baths 3 beds |
show details | |

|
#27
Rosemarie Lane, Aka 427 Rose Marie Lane
East Stroudsburg, PA 18302
|
1,350 sq. feet
|
2 baths 3 beds |
show details | |

|
#28
Darcy Dr
Saylorsburg, PA 18353
|
1,264 sq. feet
|
1 baths 2 beds |
show details | |

|
#29
Snapdragon Pt
East Stroudsburg, PA 18301
|
3,073 sq. feet
|
2 baths 4 beds |
show details | |

|
#30
Upper Ridge Dr
Effort, PA 18330
|
1,236 sq. feet
|
1 baths 3 beds |
show details |
| Photo | Address | Area | Beds / Baths | Price | Details |
|---|---|---|---|---|---|

|
#31
Scenic Dr
Albrightsville, PA 18210
|
2,604 sq. feet
|
3 baths 8 beds |
show details | |

|
#32
Tamarack Court
East Stroudsburg, PA 18301
|
1,649 sq. feet
|
2 baths 3 beds |
show details | |

|
#33
Juno Dr
Effort, PA 18330
|
1,928 sq. feet
|
2 baths 3 beds |
show details | |

|
#34
High Hill Rd
Effort, PA 18330
|
1,232 sq. feet
|
2 baths 3 beds |
show details | |

|
#35
Broad Street
Stroudsburg, PA 18360
|
- sq. feet
|
2 baths 5 beds |
show details | |

|
#36
Truman Rd
East Stroudsburg, PA 18301
|
- sq. feet
|
2 baths 3 beds |
show details | |

|
#37
Skye Drive
Lake Harmony, PA 18624
|
2,250 sq. feet
|
3 baths 4 beds |
show details | |

|
#38
Main St
Newfoundland, PA 18445
|
2,485 sq. feet
|
4 baths 4 beds |
show details | |

|
#39
Spyglass Ct
Marshalls Creek, PA 18335
|
- sq. feet
|
2 baths 4 beds |
show details | |

|
#40
Robin Ln
East Stroudsburg, PA 18302
|
- sq. feet
|
2 baths 3 beds |
show details |
| Photo | Address | Area | Beds / Baths | Price | Details |
|---|---|---|---|---|---|

|
#41
Beech Ln
Albrightsville, PA 18210
|
960 sq. feet
|
1 baths 3 beds |
show details | |

|
#42
Laurel View Ln
Tobyhanna, PA 18466
|
1,560 sq. feet
|
2 baths 3 beds |
show details | |

|
#43
Sabol Rd
Stroudsburg, PA 18360
|
1,330 sq. feet
|
1 baths 3 beds |
show details | |

|
#44
Breezy View Ln
Stroudsburg, PA 18360
|
- sq. feet
|
2 baths 4 beds |
show details | |

|
#45
Caddo Ter
Albrightsville, PA 18210
|
1,056 sq. feet
|
1 baths 3 beds |
show details | |

|
#46
Lakeside Lane
Albrightsville, PA 18210
|
768 sq. feet
|
1 baths 2 beds |
show details | |

|
#47
Kimberly Road
Delaware Water Gap, PA 18327
|
1,076 sq. feet
|
2 baths 4 beds |
show details | |

|
#48
Vista Drive
Cresco, PA 18326
|
- sq. feet
|
1 baths 2 beds |
show details | |

|
#49
Creekview Dr W
Gouldsboro, PA 18424
|
816 sq. feet
|
1 baths 3 beds |
show details | |

|
Check over 1 million property listings on Foreclosure.com!
|
browse all offers | |||


 | Offered a job in Swiftwater, housing holding us back (17 replies) |
| Apartments near Mount Pocono (21 replies) |
| Poconos retirement 2023 (105 replies) |
| Where do you see Philly in 5 years? (59 replies) |
| Potentially moving to the Poconos (30 replies) |
| Home Value keeps going down . Why ? (27 replies) |

Median year apartment built: 1979
Household type by relationship:
Households: 3,080- Male householders: 516 (162 living alone), Female householders: 601 (277 living alone)
430 spouses (430 opposite-sex spouses), 140 unmarried partners, (140 opposite-sex unmarried partners), 1,099 children (1,046 natural, 0 adopted, 53 stepchildren), 130 grandchildren, 36 brothers or sisters, 32 parents, 0 foster children, 15 other relatives, 50 non-relatives
- In group quarters: 25
Size of family households: 217 2-persons, 88 3-persons, 68 4-persons, 100 5-persons, 119 6-persons, 9 7-or-more-persons.
Size of nonfamily households: 470 1-person, 49 2-persons.
385 married couples with children.
122 single-parent households (122 men, 0 women).
60.3% of residents of Mount Pocono speak English at home.
30.1% of residents speak Spanish at home (36% speak English very well, 41% speak English well, 23% don't speak English at all).
10.1% of residents speak other Indo-European language at home (74% speak English very well, 12% speak English well, 14% speak English not well).
1.5% of residents speak Asian or Pacific Island language at home (37% speak English very well, 63% speak English not well).
Foreign born population: 754 (24.5%)
(80.5% of them are naturalized citizens)
| Here: | 5.9 |
| State: | 6.8 |
| Here: | 3.3 |
| State: | 4.3 |

- Bedrooms in owner-occupied houses and condos in Mount Pocono, Pennsylvania
- 0no bedroom
- 221 bedroom
- 1712 bedrooms
- 3033 bedrooms
- 2034 bedrooms
- 195+ bedrooms

- Bedrooms in renter-occupied apartments in Mount Pocono, Pennsylvania
- 38no bedroom
- 1941 bedroom
- 292 bedrooms
- 1113 bedrooms
- 04 bedrooms
- 135+ bedrooms

- Cars and other vehicles available in Mount Pocono in owner-occupied houses/condos
- 29no vehicle
- 1901 vehicle
- 2822 vehicles
- 1723 vehicles
- 344 vehicles
- 105+ vehicles

- Cars and other vehicles available in Mount Pocono in renter-occupied apartments
- 151no vehicle
- 1751 vehicle
- 602 vehicles
- 03 vehicles
- 04 vehicles
- 05+ vehicles

- Rooms in owner-occupied houses in Mount Pocono, Pennsylvania
- 01 room
- 02 rooms
- 03 rooms
- 1244 rooms
- 1605 rooms
- 1646 rooms
- 397 rooms
- 1458 rooms
- 859+ rooms

- Rooms in renter-occupied apartments in Mount Pocono, Pennsylvania
- 381 room
- 02 rooms
- 1553 rooms
- 654 rooms
- 995 rooms
- 06 rooms
- 167 rooms
- 08 rooms
- 139+ rooms


Mount Pocono, PA household income distribution

- 68Less than $10,000
- 110$10,000 to $19,999
- 92$20,000 to $29,999
- 118$30,000 to $39,999
- 25$40,000 to $49,999
- 69$50,000 to $59,999
- 59$60,000 to $74,999
- 198$75,000 to $99,999
- 134$100,000 to $124,999
- 70$125,000 to $149,999
- 60$150,000 to $199,999
- 120$200,000 or more
Home value of owner - occupied houses in 2022 in Mount Pocono, PA
-
- 11Less than $10,000
- 7$70,000 to $79,999
- 12$80,000 to $89,999
- 11$90,000 to $99,999
- 61$100,000 to $124,999
- 99$125,000 to $149,999
- 13$150,000 to $174,999
- 128$200,000 to $249,999
- 64$250,000 to $299,999
- 238$300,000 to $399,999
- 41$750,000 to $999,999
Rent paid by renters in 2022 in Mount Pocono, PA
-
- 33$100 to $149
- 26$600 to $649
- 23$650 to $699
- 88$700 to $749
- 26$900 to $999
- 85$1,000 to $1,249
- 110$1,500 to $1,999


Percentage of workers working in this county: 67.7%
Number of people working at home: 161 (10.3% of all workers)
Travel time to work (commute)
- Less than 5 minutes: 0
- 5 to 9 minutes: 229
- 10 to 14 minutes: 44
- 15 to 19 minutes: 362
- 20 to 24 minutes: 77
- 25 to 29 minutes: 0
- 30 to 34 minutes: 157
- 35 to 39 minutes: 0
- 40 to 44 minutes: 30
- 45 to 59 minutes: 57
- 60 to 89 minutes: 43
- 90 or more minutes: 293
Means of transportation to work:
- Drove a car alone: 1,521 (72.7%)
- Carpooled: 345 (16.5%)
- Bus: 20 (1.0%)
- Taxi: 9 (0.4%)
- Worked at home: 161 (7.7%)

- Unemployment by race in 2022
- Unemployment rate for Black residents
- 14.8%Males
- Unemployment rate for Hispanic or Latino residents
- 39.2%Females

- Year of entry for the foreign-born population in Mount Pocono, Pennsylvania
- 1012010 or later
- 1272000 to 2009
- 1161990 to 1999
- 361980 to 1989
- 301970 to 1979
- 62Before 1970

First ancestries reported:
- German: 275 (17.9%)
- American: 110 (7.1%)
- European: 96 (6.2%)
- Irish: 93 (6.0%)
- Italian: 47 (3.1%)
- Haitian: 42 (2.7%)
- Greek: 29 (1.9%)
- Polish: 29 (1.9%)
- Lebanese: 23 (1.5%)
- Afghan: 20 (1.3%)
- Welsh: 14 (0.9%)
- Scandinavian: 10 (0.6%)
- Northern European: 9 (0.6%)
- Slovak: 9 (0.6%)
- African: 9 (0.6%)
Most common places of birth for foreign-born residents (%):
| Mount Pocono: | 29.4% (184) |
| Pennsylvania: | 9.2% (86,544) |
| Mount Pocono: | 14.1% (88) |
| Pennsylvania: | 1.9% (18,065) |
| Mount Pocono: | 7.7% (48) |
| Pennsylvania: | 0.2% (1,902) |
| Mount Pocono: | 6.5% (41) |
| Pennsylvania: | 2.2% (21,039) |
| Mount Pocono: | 6.2% (39) |
| Pennsylvania: | 10.7% (100,596) |
| Mount Pocono: | 4.8% (30) |
| Pennsylvania: | 1.6% (15,224) |
| Mount Pocono: | 4.6% (29) |
| Pennsylvania: | 1.3% (12,172) |
| Mount Pocono: | 4.0% (25) |
| Pennsylvania: | 0.5% (4,519) |
| Mount Pocono: | 3.8% (24) |
| Pennsylvania: | 1.0% (9,205) |
| Mount Pocono: | 3.4% (21) |
| Pennsylvania: | 0.2% (1,467) |
| Mount Pocono: | 2.1% (13) |
| Pennsylvania: | 0.1% (1,139) |
| Mount Pocono: | 1.9% (12) |
| Pennsylvania: | 0.5% (5,121) |
| Mount Pocono: | 1.9% (12) |
| Pennsylvania: | 1.8% (17,032) |
| Mount Pocono: | 1.6% (10) |
| Pennsylvania: | 1.6% (15,272) |
Place of birth for U.S.-born residents:
- This state: 600
- Other state: 1,331
- Northeast: 1,037
- Midwest: 17
- South: 225
- West: 25
83.0% of Mount Pocono residents lived in the same house 1 years ago.
Out of people who lived in different houses, 13.6% lived in this county.
Out of people who lived in different counties, 4.9% lived in Pennsylvania.
| Mount Pocono: | 83.0% |
| State average: | 89.3% |
Education attainment for males 25 years and older:
- No schooling: 59
- Nursery to 4th grade: 0
- 5th and 6th grade: 0
- 7th and 8th grade: 0
- 9th grade: 15
- 10th grade: 0
- 11th grade: 32
- 12th grade, no diploma: 38
- High school graduate (or equivalency): 494
- Less than 1 year of college: 46
- Some college more than 1 year, no degree: 26
- Associate degree: 39
- Bachelor's degree: 292
- Master's degree: 17
- Professional school degree: 0
- Doctorate degree: 0

Education attainment for females 25 years and older:
- No schooling: 88
- Nursery to 4th grade: 0
- 5th and 6th grade: 0
- 7th and 8th grade: 19
- 9th grade: 0
- 10th grade: 35
- 11th grade: 0
- 12th grade, no diploma: 34
- High school graduate (or equivalency): 560
- Less than 1 year of college: 54
- Some college more than 1 year, no degree: 58
- Associate degree: 84
- Bachelor's degree: 97
- Master's degree: 152
- Professional school degree: 0
- Doctorate degree: 0


Housing units in structures:
- One, detached: 812
- One, attached: 35
- 3 or 4: 77
- 10 to 19: 15
- 20 to 49: 160
- 50 or more: 78
Housing units lacking complete kitchen facilities in 2022: 3.3%
House/condo owner moved in on average 16 years ago
Renter moved in on average 6 years ago

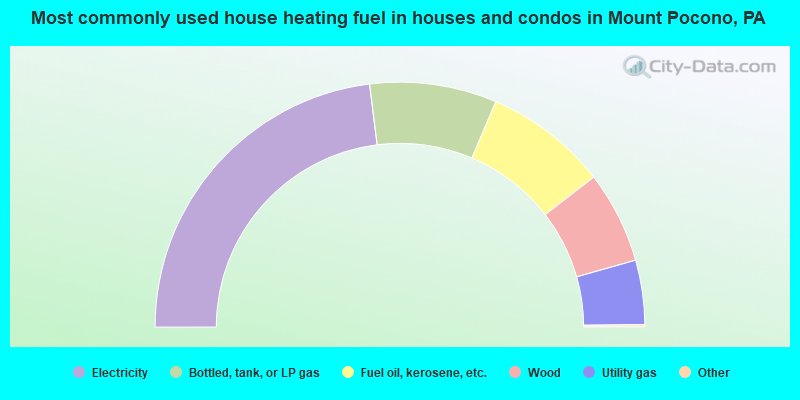
- 46.2%Electricity
- 16.8%Bottled, tank, or LP gas
- 16.3%Fuel oil, kerosene, etc.
- 12.2%Wood
- 8.5%Utility gas
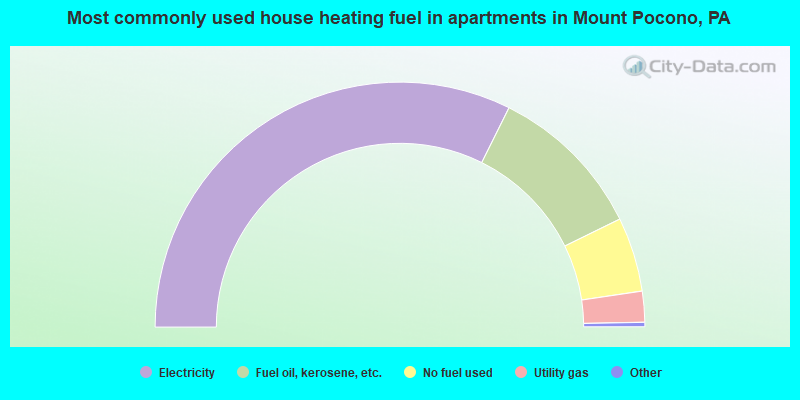
- 65.1%Electricity
- 20.9%Fuel oil, kerosene, etc.
- 9.9%No fuel used
- 4.1%Utility gas
Private vs. public school enrollment:
| Here: | 0.0% |
| Pennsylvania: | 15.7% |
| Here: | 0.0% |
| Pennsylvania: | 13.4% |
| Here: | 100.0% |
| Pennsylvania: | 39.8% |


