Mount Pulaski, IL (Illinois) Houses and Residents
| Mount Pulaski: | $118,066 |
| Illinois: | $251,600 |
Total population: 1,528 (Urban population: 0, Rural population: 1,700 (all nonfarm))
Houses: 709 (674 occupied: 578 owner occupied, 104 renter occupied)
| % of renters here: | 15% |
| State: | 33% |
Housing density: 623 houses/condos per square mile
Median price asked for vacant for-sale houses and condos in 2022 in this county: $70,031.
Median contract rent in 2022: $491 (lower quartile is $366, upper quartile is $657)
Median rent asked for vacant for-rent units in 2022: $588
Median gross rent in Mount Pulaski, IL in 2022: $709
Housing units in Mount Pulaski with a mortgage: 372 (17 second mortgage, 0 home equity loan, 17 both second mortgage and home equity loan)
Houses without a mortgage: 9
Median household income for houses/condos with a mortgage: $69,763
Median household income for apartments without a mortgage: $49,946
Median monthly housing costs: $940
Compare current foreclosures near Mount Pulaski, IL:
| Photo | Address | Area | Beds / Baths | Price | Details |
|---|---|---|---|---|---|

|
#1
1450th Ave
Mount Pulaski, IL 62548
|
- sq. feet
|
- baths - beds |
show details | |

|
#2
S Spring St # C
Mount Pulaski, IL 62548
|
- sq. feet
|
- baths - beds |
show details | |

|
#3
N Main St
Lincoln, IL 62656
|
784 sq. feet
|
1 baths 2 beds |
$117,900
|
show details |

|
#4
E Flora Ave
Mount Pulaski, IL 62548
|
- sq. feet
|
- baths - beds |
show details | |

|
#5
W Jefferson St
Mount Pulaski, IL 62548
|
- sq. feet
|
- baths - beds |
show details | |

|
#6
N Ottawa St
Lincoln, IL 62656
|
- sq. feet
|
1 baths 3 beds |
$55,000
|
show details |

|
#7
Redlick Ct
Warrensburg, IL 62573
|
1,320 sq. feet
|
2 baths 3 beds |
show details | |

|
#8
Bullard Rd
Buffalo, IL 62515
|
- sq. feet
|
- baths - beds |
show details | |

|
#9
Buffalo Mech Rd
Dawson, IL 62520
|
- sq. feet
|
- baths - beds |
show details | |

|
#10
Jones St
Williamsville, IL 62693
|
- sq. feet
|
- baths - beds |
show details |
| Photo | Address | Area | Beds / Baths | Price | Details |
|---|---|---|---|---|---|

|
#11
S Walnut St
Buffalo, IL 62515
|
- sq. feet
|
- baths - beds |
show details | |

|
#12
W Elm St
Buffalo, IL 62515
|
- sq. feet
|
- baths - beds |
show details | |

|
#13
E Howard St
Kenney, IL 61749
|
- sq. feet
|
- baths - beds |
show details | |

|
#14
N Alexander St
Kenney, IL 61749
|
- sq. feet
|
- baths - beds |
show details | |

|
#15
Old Route 36
Buffalo, IL 62515
|
- sq. feet
|
- baths - beds |
show details | |

|
#16
8th St
Lincoln, IL 62656
|
- sq. feet
|
- baths - beds |
show details | |

|
#17
1500th St
Lincoln, IL 62656
|
- sq. feet
|
- baths - beds |
show details | |

|
#18
Railroad St
Mechanicsburg, IL 62545
|
- sq. feet
|
- baths - beds |
show details | |

|
#19
N Logan St
Lincoln, IL 62656
|
- sq. feet
|
- baths - beds |
show details | |

|
#20
Wichita Ave
Lincoln, IL 62656
|
- sq. feet
|
- baths - beds |
show details |
| Photo | Address | Area | Beds / Baths | Price | Details |
|---|---|---|---|---|---|

|
#21
4th Cross St
Mechanicsburg, IL 62545
|
- sq. feet
|
- baths - beds |
show details | |

|
#22
S Hamilton St
Lincoln, IL 62656
|
- sq. feet
|
- baths - beds |
show details | |

|
#23
W Cantrell St
Decatur, IL 62522
|
- sq. feet
|
- baths - beds |
show details | |

|
#24
N Maple St
Chestnut, IL 62518
|
- sq. feet
|
- baths - beds |
show details | |

|
#25
E North St Apt 15
Warrensburg, IL 62573
|
- sq. feet
|
- baths - beds |
show details | |

|
#26
Main St
Williamsville, IL 62693
|
- sq. feet
|
- baths - beds |
show details | |

|
#27
S 4th St
Mechanicsburg, IL 62545
|
- sq. feet
|
- baths - beds |
show details | |

|
#28
Mckinley Rd
Decatur, IL 62526
|
- sq. feet
|
- baths - beds |
show details | |

|
#29
E Raylots St
Riverton, IL 62561
|
- sq. feet
|
- baths - beds |
show details | |

|
#30
S Main St
Riverton, IL 62561
|
- sq. feet
|
- baths - beds |
show details |
| Photo | Address | Area | Beds / Baths | Price | Details |
|---|---|---|---|---|---|

|
#31
Romulis Rd
Niantic, IL 62551
|
- sq. feet
|
- baths - beds |
show details | |

|
#32
Redlick Ct
Warrensburg, IL 62573
|
- sq. feet
|
- baths - beds |
show details | |

|
#33
W Charles St
Buffalo, IL 62515
|
- sq. feet
|
- baths - beds |
show details | |

|
#34
E North St
Warrensburg, IL 62573
|
- sq. feet
|
- baths - beds |
show details | |

|
#35
N Kankakee St
Lincoln, IL 62656
|
- sq. feet
|
- baths - beds |
show details | |

|
#36
Southgate St
Lincoln, IL 62656
|
- sq. feet
|
- baths - beds |
show details | |

|
#37
N Mclean St
Lincoln, IL 62656
|
- sq. feet
|
- baths - beds |
show details | |

|
#38
Omaha Ave
Lincoln, IL 62656
|
- sq. feet
|
- baths - beds |
show details | |

|
#39
N Mclean St
Lincoln, IL 62656
|
- sq. feet
|
- baths - beds |
show details | |

|
#40
S Elm St
Lincoln, IL 62656
|
- sq. feet
|
- baths - beds |
show details |
| Photo | Address | Area | Beds / Baths | Price | Details |
|---|---|---|---|---|---|

|
#41
Decatur St
Lincoln, IL 62656
|
- sq. feet
|
- baths - beds |
show details | |

|
#42
Pekin St
Lincoln, IL 62656
|
- sq. feet
|
- baths - beds |
show details | |

|
#43
E Oak St
Elkhart, IL 62634
|
- sq. feet
|
- baths - beds |
show details | |

|
#44
Schneider Pl
Riverton, IL 62561
|
- sq. feet
|
- baths - beds |
show details | |

|
Check over 1 million property listings on Foreclosure.com!
|
browse all offers | |||


Median year apartment built: 1972
Household type by relationship:
Households: 1,613- Male householders: 327 (64 living alone), Female householders: 334 (141 living alone)
294 spouses (294 opposite-sex spouses), 65 unmarried partners, (59 opposite-sex unmarried partners), 493 children (473 natural, 5 adopted, 13 stepchildren), 2 grandchildren, 6 brothers or sisters, 4 parents, 0 foster children, 8 other relatives, 6 non-relatives
- In group quarters: 68
Size of family households: 197 2-persons, 53 3-persons, 144 4-persons, 31 5-persons, 3 7-or-more-persons.
Size of nonfamily households: 216 1-person, 31 2-persons, 6 3-persons.
191 married couples with children.
232 single-parent households (10 men, 222 women).
96.5% of residents of Mount Pulaski speak English at home.
2.3% of residents speak Spanish at home (74% speak English very well, 26% speak English well).
0.6% of residents speak other Indo-European language at home (100% speak English very well).
Foreign born population: 9 (0.6%)
(100.0% of them are naturalized citizens)
| Here: | 6.9 |
| State: | 6.4 |
| Here: | 4.2 |
| State: | 4.1 |

- Bedrooms in owner-occupied houses and condos in Mount Pulaski, Illinois
- 0no bedroom
- 41 bedroom
- 1302 bedrooms
- 2433 bedrooms
- 1694 bedrooms
- 325+ bedrooms

- Bedrooms in renter-occupied apartments in Mount Pulaski, Illinois
- 3no bedroom
- 251 bedroom
- 512 bedrooms
- 123 bedrooms
- 134 bedrooms
- 05+ bedrooms

- Cars and other vehicles available in Mount Pulaski in owner-occupied houses/condos
- 14no vehicle
- 2211 vehicle
- 2162 vehicles
- 903 vehicles
- 314 vehicles
- 75+ vehicles

- Cars and other vehicles available in Mount Pulaski in renter-occupied apartments
- 1no vehicle
- 601 vehicle
- 252 vehicles
- 183 vehicles
- 04 vehicles
- 05+ vehicles

- Rooms in owner-occupied houses in Mount Pulaski, Illinois
- 01 room
- 12 rooms
- 03 rooms
- 324 rooms
- 865 rooms
- 1256 rooms
- 1067 rooms
- 968 rooms
- 1329+ rooms

- Rooms in renter-occupied apartments in Mount Pulaski, Illinois
- 31 room
- 02 rooms
- 133 rooms
- 434 rooms
- 185 rooms
- 66 rooms
- 47 rooms
- 68 rooms
- 119+ rooms


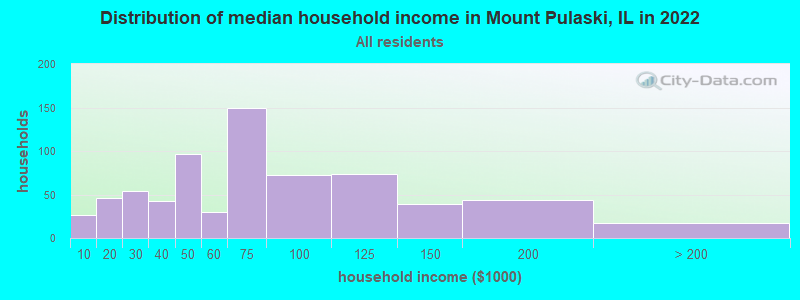
Mount Pulaski, IL household income distribution

- 26Less than $10,000
- 46$10,000 to $19,999
- 54$20,000 to $29,999
- 43$30,000 to $39,999
- 96$40,000 to $49,999
- 30$50,000 to $59,999
- 149$60,000 to $74,999
- 72$75,000 to $99,999
- 74$100,000 to $124,999
- 39$125,000 to $149,999
- 44$150,000 to $199,999
- 17$200,000 or more
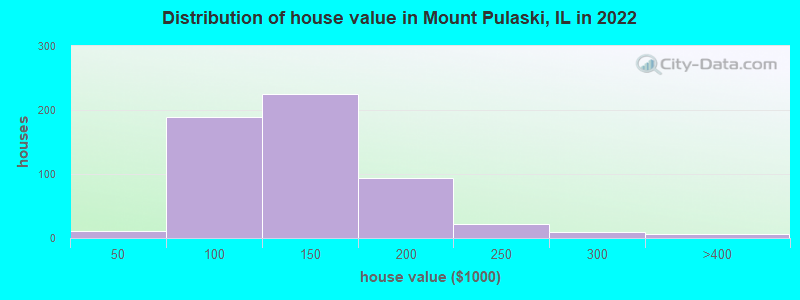
Home value of owner - occupied houses in 2022 in Mount Pulaski, IL
-
- 4$30,000 to $34,999
- 6$40,000 to $49,999
- 10$50,000 to $59,999
- 50$60,000 to $69,999
- 26$70,000 to $79,999
- 48$80,000 to $89,999
- 46$90,000 to $99,999
- 166$100,000 to $124,999
- 58$125,000 to $149,999
- 60$150,000 to $174,999
- 32$175,000 to $199,999
- 22$200,000 to $249,999
- 8$250,000 to $299,999
- 5$300,000 to $399,999
Rent paid by renters in 2022 in Mount Pulaski, IL
-
- 2$100 to $149
- 13$250 to $299
- 7$350 to $399
- 15$450 to $499
- 13$500 to $549
- 3$550 to $599
- 2$600 to $649
- 9$650 to $699
- 6$750 to $799
- 5$900 to $999
- 2$1,000 to $1,249
- 20No cash rent


Percentage of workers working in this county: 56.7%
Number of people working at home: 70 (10.1% of all workers)
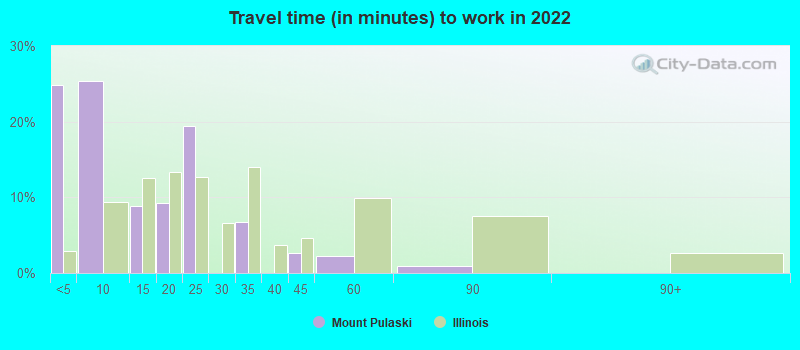
Travel time to work (commute)
- Less than 5 minutes: 65
- 5 to 9 minutes: 65
- 10 to 14 minutes: 51
- 15 to 19 minutes: 122
- 20 to 24 minutes: 67
- 25 to 29 minutes: 58
- 30 to 34 minutes: 53
- 35 to 39 minutes: 41
- 40 to 44 minutes: 24
- 45 to 59 minutes: 32
- 60 to 89 minutes: 24
- 90 or more minutes: 5
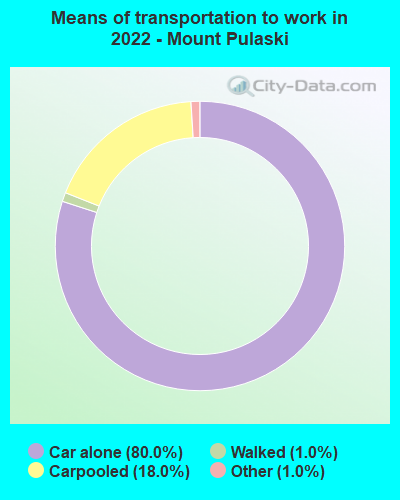
Means of transportation to work:
- Drove a car alone: 228 (65.1%)
- Carpooled: 54 (15.4%)
- Taxi: 3 (0.9%)
- Walked: 2 (0.6%)
- Worked at home: 70 (20.0%)

- Unemployment by race in 2022
- Unemployment rate for White non-Hispanic residents
- 5.0%Males
- 5.2%Females

- Year of entry for the foreign-born population in Mount Pulaski, Illinois
- 02010 or later
- 82000 to 2009
- 01990 to 1999
- 01980 to 1989
- 01970 to 1979
- 2Before 1970

First ancestries reported:
- German: 221 (40.0%)
- American: 98 (17.7%)
- English: 54 (9.8%)
- Irish: 37 (6.7%)
- European: 20 (3.6%)
- Polish: 12 (2.2%)
- Dutch: 6 (1.1%)
- Scotch-Irish: 6 (1.1%)
- French Canadian: 5 (0.9%)
- French: 4 (0.7%)
- Northern European: 3 (0.5%)
- Scottish: 3 (0.5%)
- Czechoslovakian: 2 (0.4%)
- British: 1 (0.2%)
Most common places of birth for foreign-born residents (%):
| Mount Pulaski: | 88.9% (8) |
| Illinois: | 34.7% (626,958) |
Place of birth for U.S.-born residents:
- This state: 1,456
- Other state: 139
- Northeast: 27
- Midwest: 50
- South: 52
- West: 9
93.8% of Mount Pulaski residents lived in the same house 1 years ago.
Out of people who lived in different houses, 29.1% lived in this county.
Out of people who lived in different counties, 47.5% lived in Illinois.
| Mount Pulaski: | 93.8% |
| State average: | 88.3% |
Education attainment for males 25 years and older:
- No schooling: 0
- Nursery to 4th grade: 0
- 5th and 6th grade: 0
- 7th and 8th grade: 2
- 9th grade: 0
- 10th grade: 4
- 11th grade: 5
- 12th grade, no diploma: 5
- High school graduate (or equivalency): 186
- Less than 1 year of college: 37
- Some college more than 1 year, no degree: 70
- Associate degree: 36
- Bachelor's degree: 62
- Master's degree: 24
- Professional school degree: 7
- Doctorate degree: 0

Education attainment for females 25 years and older:
- No schooling: 1
- Nursery to 4th grade: 0
- 5th and 6th grade: 0
- 7th and 8th grade: 13
- 9th grade: 2
- 10th grade: 0
- 11th grade: 2
- 12th grade, no diploma: 6
- High school graduate (or equivalency): 244
- Less than 1 year of college: 37
- Some college more than 1 year, no degree: 83
- Associate degree: 58
- Bachelor's degree: 155
- Master's degree: 22
- Professional school degree: 6
- Doctorate degree: 3


Housing units in structures:
- One, detached: 646
- One, attached: 2
- Two: 25
- 3 or 4: 28
- Mobile homes: 7
House/condo owner moved in on average 15 years ago
Renter moved in on average 6 years ago

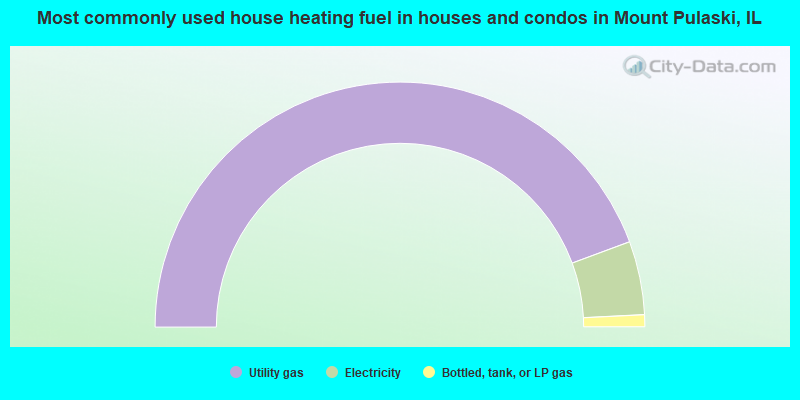
- 88.7%Utility gas
- 9.7%Electricity
- 1.6%Bottled, tank, or LP gas
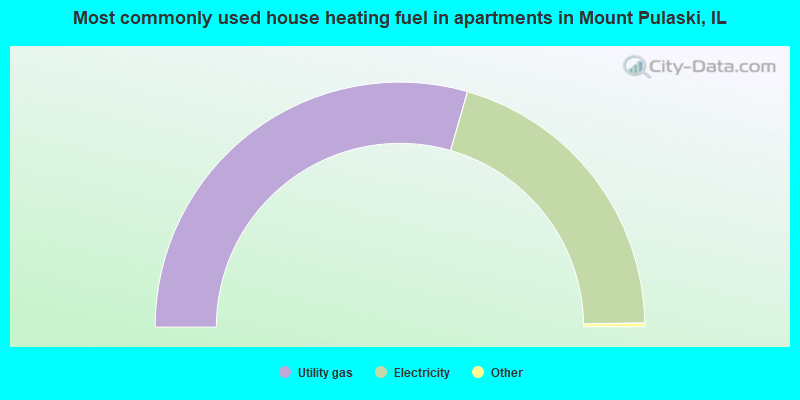
- 59.2%Utility gas
- 40.8%Electricity
Private vs. public school enrollment:
| Here: | 10.1% |
| Illinois: | 13.3% |
| Here: | 0.0% |
| Illinois: | 9.9% |
| Here: | 0.0% |
| Illinois: | 27.4% |


