Mount Selman, TX (Texas) Houses and Residents
| Mount Selman: | $183,248 |
| Texas: | $275,400 |
Total population: 4,300 (Urban population: 0, Rural population: 4,175 (207 farm, 3,968 nonfarm))
Houses: 1,791 (1,571 occupied: 1,426 owner occupied, 145 renter occupied)
| % of renters here: | 9% |
| State: | 38% |
Housing density: 19 houses/condos per square mile
Median price asked for vacant for-sale houses and condos in 2022 in this county: $220,866.
Median contract rent in 2022: $720 (lower quartile is $360, upper quartile is $935)
Median rent asked for vacant for-rent units in 2022: $776
Median gross rent in Mount Selman, TX in 2022: $1,027
Housing units in Mount Selman with a mortgage: 307 (6 second mortgage, 26 home equity loan, 0 both second mortgage and home equity loan)
Houses without a mortgage: 306
Compare current foreclosures near Mount Selman, TX:
| Photo | Address | Area | Beds / Baths | Price | Details |
|---|---|---|---|---|---|

|
#1
County 1197 Rd
Flint, TX 75762
|
- sq. feet
|
2 baths 3 beds |
show details | |

|
#2
E Devine St
Tyler, TX 75701
|
1,073 sq. feet
|
1 baths 3 beds |
show details | |

|
#3
County Road 4220
Jacksonville, TX 75766
|
- sq. feet
|
2 baths 4 beds |
show details | |

|
#4
San Saba St
Bullard, TX 75757
|
- sq. feet
|
1 baths 2 beds |
show details | |

|
#5
Moorehill Dr
Tyler, TX 75701
|
1,632 sq. feet
|
2 baths - beds |
show details | |

|
#6
Melody Ln
Tyler, TX 75701
|
1,508 sq. feet
|
2 baths - beds |
show details | |

|
#7
Quail Ln
Whitehouse, TX 75791
|
1,422 sq. feet
|
2 baths - beds |
show details | |

|
#8
Lakeview Cir
Flint, TX 75762
|
1,860 sq. feet
|
2 baths - beds |
show details | |

|
#9
White Deer Trl
Tyler, TX 75703
|
1,653 sq. feet
|
2 baths - beds |
show details | |

|
#10
County Road 122
Tyler, TX 75703
|
3,160 sq. feet
|
4 baths - beds |
show details |
| Photo | Address | Area | Beds / Baths | Price | Details |
|---|---|---|---|---|---|

|
#11
Altuda Ln
Flint, TX 75762
|
1,814 sq. feet
|
2 baths - beds |
show details | |

|
#12
W 8th St
Tyler, TX 75701
|
1,838 sq. feet
|
2 baths - beds |
show details | |

|
#13
Ruby Cv
Whitehouse, TX 75791
|
2,127 sq. feet
|
2 baths - beds |
show details | |

|
#14
S Robertson Ave
Tyler, TX 75701
|
2,592 sq. feet
|
2 baths - beds |
show details | |

|
#15
Vanderbilt
Tyler, TX 75703
|
4,532 sq. feet
|
3 baths - beds |
show details | |

|
#16
W 6th St
Tyler, TX 75701
|
1,476 sq. feet
|
1 baths - beds |
show details | |

|
#17
Baylor Dr
Tyler, TX 75703
|
2,617 sq. feet
|
2 baths - beds |
show details | |

|
#18
Trenton Dr
Tyler, TX 75703
|
2,405 sq. feet
|
2 baths - beds |
show details | |

|
#19
Hagan Rd
Whitehouse, TX 75791
|
1,646 sq. feet
|
2 baths - beds |
show details | |

|
#20
Seton St
Flint, TX 75762
|
1,494 sq. feet
|
2 baths - beds |
show details |
| Photo | Address | Area | Beds / Baths | Price | Details |
|---|---|---|---|---|---|

|
#21
County Road 2278
Tyler, TX 75707
|
1,272 sq. feet
|
2 baths - beds |
show details | |

|
#22
County Road 133
Flint, TX 75762
|
1,817 sq. feet
|
2 baths - beds |
show details | |

|
#23
Brigadoon St
Tyler, TX 75703
|
2,156 sq. feet
|
2 baths - beds |
show details | |

|
#24
Autumn Trl
Whitehouse, TX 75791
|
2,071 sq. feet
|
2 baths - beds |
show details | |

|
#25
Indian Dr
Tyler, TX 75709
|
1,580 sq. feet
|
1 baths - beds |
show details | |

|
#26
Woodland Hills Dr
Tyler, TX 75701
|
1,476 sq. feet
|
1 baths - beds |
show details | |

|
#27
Arlington Ave
Tyler, TX 75701
|
2,925 sq. feet
|
2 baths - beds |
show details | |

|
#28
Landon St
Whitehouse, TX 75791
|
2,187 sq. feet
|
2 baths - beds |
show details | |

|
#29
Woodhaven Dr
Whitehouse, TX 75791
|
2,091 sq. feet
|
2 baths - beds |
show details | |

|
#30
S Keaton Ave
Tyler, TX 75701
|
1,934 sq. feet
|
2 baths - beds |
show details |
| Photo | Address | Area | Beds / Baths | Price | Details |
|---|---|---|---|---|---|

|
#31
Bain Pl
Tyler, TX 75701
|
2,156 sq. feet
|
2 baths - beds |
show details | |

|
#32
County Road 2337
Tyler, TX 75707
|
2,063 sq. feet
|
2 baths - beds |
show details | |

|
#33
Milam Dr
Tyler, TX 75701
|
1,272 sq. feet
|
2 baths - beds |
show details | |

|
#34
E Amherst Dr
Tyler, TX 75701
|
1,170 sq. feet
|
2 baths - beds |
show details | |

|
#35
Senter Ave
Whitehouse, TX 75791
|
1,501 sq. feet
|
2 baths - beds |
show details | |

|
#36
Belmont Dr
Tyler, TX 75701
|
1,226 sq. feet
|
2 baths - beds |
show details | |

|
#37
Santa Rosa Dr
Tyler, TX 75701
|
2,477 sq. feet
|
3 baths - beds |
show details | |

|
#38
Ruggles Ct W
Flint, TX 75762
|
1,877 sq. feet
|
2 baths - beds |
show details | |

|
#39
Cross Creek Cir
Tyler, TX 75703
|
1,727 sq. feet
|
2 baths - beds |
show details | |

|
#40
Hickory Ln
Bullard, TX 75757
|
1,477 sq. feet
|
2 baths - beds |
show details |
| Photo | Address | Area | Beds / Baths | Price | Details |
|---|---|---|---|---|---|

|
#41
Ashwood Dr
Tyler, TX 75703
|
3,090 sq. feet
|
3 baths - beds |
show details | |

|
#42
E Plainview St
Tyler, TX 75701
|
2,133 sq. feet
|
2 baths - beds |
show details | |

|
#43
Us Highway 69 S
Tyler, TX 75703
|
1,248 sq. feet
|
1 baths - beds |
show details | |

|
#44
County Road 2254
Tyler, TX 75707
|
1,114 sq. feet
|
1 baths - beds |
show details | |

|
#45
Cass Cir
Flint, TX 75762
|
2,087 sq. feet
|
2 baths - beds |
show details | |

|
#46
Cass Cir
Flint, TX 75762
|
1,811 sq. feet
|
2 baths - beds |
show details | |

|
#47
Westridge St
Tyler, TX 75709
|
2,000 sq. feet
|
2 baths - beds |
show details | |

|
#48
Preakness Dr
Flint, TX 75762
|
1,467 sq. feet
|
2 baths - beds |
show details | |

|
#49
Timber Creek Dr
Tyler, TX 75703
|
2,091 sq. feet
|
2 baths - beds |
show details | |

|
Check over 1 million property listings on Foreclosure.com!
|
browse all offers | |||

Household type by relationship:
Households: 47,994- In family households: 42,122 (8,842 male householders, 4,065 female householders)
9,501 spouses, 14,846 children (13,572 natural, 363 adopted, 911 stepchildren), 1,727 grandchildren, 521 brothers or sisters, 408 parents, foster children, 845 other relatives, 1,018 non-relatives
- In nonfamily households: 5,872 (2,312 male householders (1,891 living alone)), 2,675 female householders (2,416 living alone)), 885 nonrelatives
- In group quarters: 2,851 (2,354 institutionalized population)
7,878 married couples with children.
2,874 single-parent households (570 men, 2,304 women).
96.1% of residents of Mount Selman speak English at home.
2.7% of residents speak Spanish at home (85% speak English very well, 11% speak English well, 5% speak English not well).
0.6% of residents speak other Indo-European language at home (100% speak English very well).
0.6% of residents speak Asian or Pacific Island language at home (100% speak English very well).
0.1% of residents speak other language at home (100% speak English very well).
Foreign born population: 160 (2.8%)
(67.5% of them are naturalized citizens)
| Here: | 6.0 |
| State: | 6.3 |
| Here: | 4.8 |
| State: | 4.0 |

- Bedrooms in owner-occupied houses and condos in Mount Selman, Texas
- 7no bedroom
- 341 bedroom
- 3502 bedrooms
- 9163 bedrooms
- 984 bedrooms
- 215+ bedrooms

- Bedrooms in renter-occupied apartments in Mount Selman, Texas
- 0no bedroom
- 281 bedroom
- 732 bedrooms
- 373 bedrooms
- 74 bedrooms
- 05+ bedrooms

- Cars and other vehicles available in Mount Selman in owner-occupied houses/condos
- 39no vehicle
- 3111 vehicle
- 7012 vehicles
- 3143 vehicles
- 484 vehicles
- 135+ vehicles

- Cars and other vehicles available in Mount Selman in renter-occupied apartments
- 11no vehicle
- 821 vehicle
- 422 vehicles
- 103 vehicles
- 04 vehicles
- 05+ vehicles

- Rooms in owner-occupied houses in Mount Selman, Texas
- 71 room
- 202 rooms
- 723 rooms
- 1644 rooms
- 4035 rooms
- 3996 rooms
- 1757 rooms
- 1278 rooms
- 599+ rooms

- Rooms in renter-occupied apartments in Mount Selman, Texas
- 01 room
- 232 rooms
- 173 rooms
- 504 rooms
- 315 rooms
- 236 rooms
- 17 rooms
- 08 rooms
- 09+ rooms


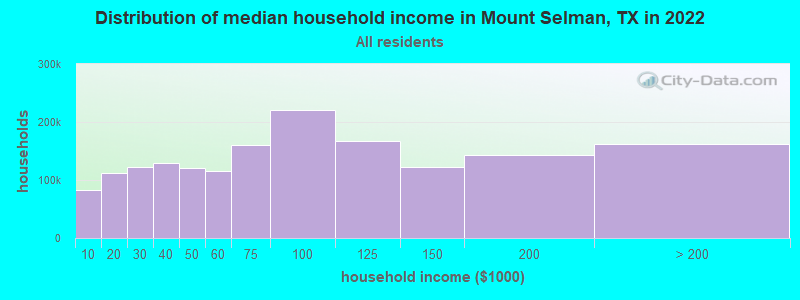
Mount Selman, TX household income distribution

- 81,090Less than $10,000
- 110,243$10,000 to $19,999
- 119,932$20,000 to $29,999
- 126,320$30,000 to $39,999
- 119,177$40,000 to $49,999
- 114,378$50,000 to $59,999
- 158,334$60,000 to $74,999
- 216,795$75,000 to $99,999
- 164,343$100,000 to $124,999
- 121,161$125,000 to $149,999
- 140,897$150,000 to $199,999
- 158,374$200,000 or more
Percentage of workers working in this county: 35.2%
Number of people working at home: 295 (11.1% of all workers)
Travel time to work (commute)
- Less than 5 minutes: 75
- 5 to 9 minutes: 68
- 10 to 14 minutes: 84
- 15 to 19 minutes: 194
- 20 to 24 minutes: 282
- 25 to 29 minutes: 163
- 30 to 34 minutes: 418
- 35 to 39 minutes: 61
- 40 to 44 minutes: 176
- 45 to 59 minutes: 252
- 60 to 89 minutes: 78
- 90 or more minutes: 45
Means of transportation to work:
- Drove a car alone: 1,478 (76.1%)
- Carpooled: 361 (18.6%)
- Bus or trolley bus: 6 (0.3%)
- Walked: 44 (2.3%)
- Other means: 7 (0.4%)
- Worked at home: 47 (2.4%)


- Year of entry for the foreign-born population in Mount Selman, Texas
- 01995 to March 2000
- 41990 to 1994
- 131985 to 1989
- 21980 to 1984
- 101975 to 1979
- 141970 to 1974
- 51965 to 1969
- 23Before 1965
Most common places of birth for foreign-born residents (%):
| Mount Selman: | 23.9% (17) |
| Texas: | 0.2% (5,590) |
| Mount Selman: | 18.3% (13) |
| Texas: | 1.4% (39,249) |
| Mount Selman: | 18.3% (13) |
| Texas: | 0.5% (13,070) |
| Mount Selman: | 15.5% (11) |
| Texas: | 64.8% (1,879,369) |
| Mount Selman: | 14.1% (10) |
| Texas: | 0.2% (6,793) |
| Mount Selman: | 7.0% (5) |
| Texas: | 1.2% (36,176) |
| Mount Selman: | 2.8% (2) |
| Texas: | 0.0% (1,353) |
Place of birth for U.S.-born residents:
- This state: 3,414
- Other state: 668
- Northeast: 49
- Midwest: 173
- South: 308
- West: 138
56% of Mount Selman residents lived in the same house 5 years ago.
Out of people who lived in different houses, 36% lived in this county.
Out of people who lived in different counties, 86% lived in Texas.
Education attainment for males 25 years and older:
- No schooling: 19
- Nursery to 4th grade: 15
- 5th and 6th grade: 20
- 7th and 8th grade: 44
- 9th grade: 46
- 10th grade: 75
- 11th grade: 74
- 12th grade, no diploma: 63
- High school graduate (or equivalency): 371
- Less than 1 year of college: 130
- Some college more than 1 year, no degree: 226
- Associate degree: 77
- Bachelor's degree: 121
- Master's degree: 29
- Professional school degree: 12
- Doctorate degree: 0

Education attainment for females 25 years and older:
- No schooling: 0
- Nursery to 4th grade: 0
- 5th and 6th grade: 20
- 7th and 8th grade: 29
- 9th grade: 83
- 10th grade: 50
- 11th grade: 47
- 12th grade, no diploma: 113
- High school graduate (or equivalency): 506
- Less than 1 year of college: 126
- Some college more than 1 year, no degree: 216
- Associate degree: 107
- Bachelor's degree: 80
- Master's degree: 52
- Professional school degree: 0
- Doctorate degree: 0


Housing units in structures:
- One, detached: 1,033
- One, attached: 18
- Mobile homes: 737
- Boats, RVs, vans, etc.: 3
Median worth of mobile homes: $90,224
Housing units lacking complete kitchen facilities: 1.8%

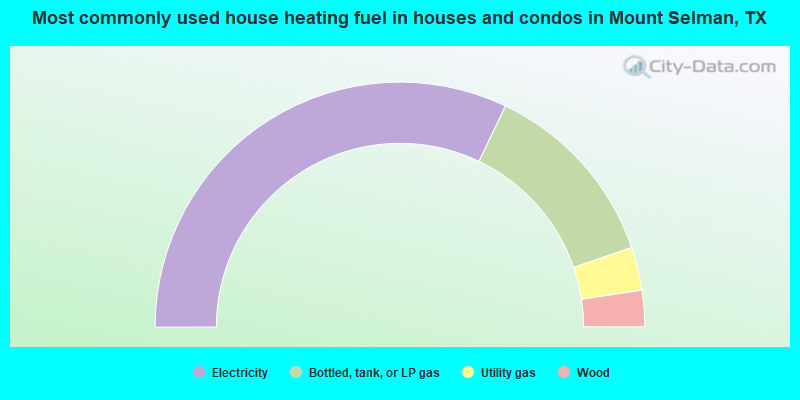
- 64.2%Electricity
- 25.3%Bottled, tank, or LP gas
- 5.7%Utility gas
- 4.8%Wood
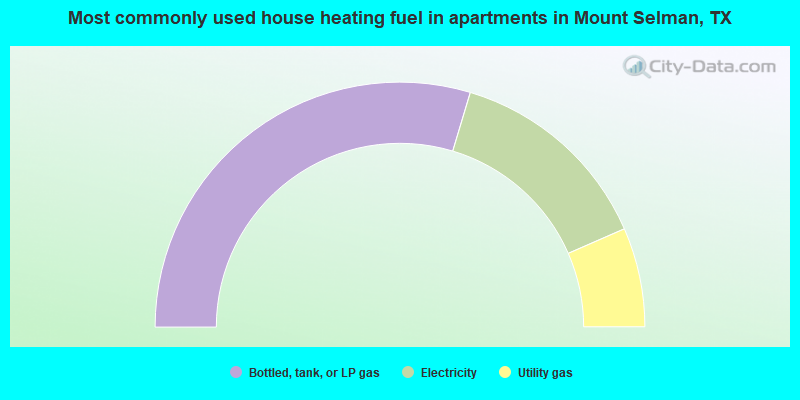
- 59.3%Bottled, tank, or LP gas
- 27.6%Electricity
- 13.1%Utility gas
Private vs. public school enrollment:
| Here: | 4.4% |
| Texas: | 6.8% |
| Here: | 17.5% |
| Texas: | 6.2% |
| Here: | 19.7% |
| Texas: | 15.4% |


