Mount Sinai, NY (New York) Houses and Residents
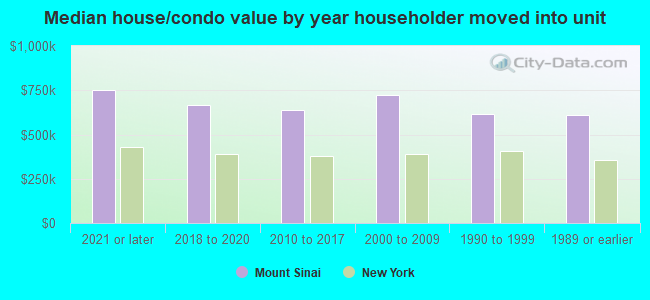
| Mount Sinai: | $662,000 |
| New York: | $400,400 |
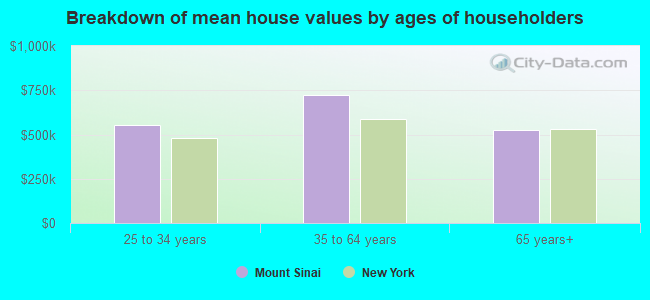
Mean price in 2022:
Detached houses: $680,775
Here: $680,775 State: $476,719 Townhouses or other attached units: $410,178
Here: $410,178 State: $699,270 In 2-unit structures: $370,330
Here: $370,330 State: $713,077 In 3-to-4-unit structures: $345,366
Here: $345,366 State: $764,568 In 5-or-more-unit structures: $358,532
Here: $358,532 State: $912,009
Total population: 12,118 (Urban population: 8,623, Rural population: 0)
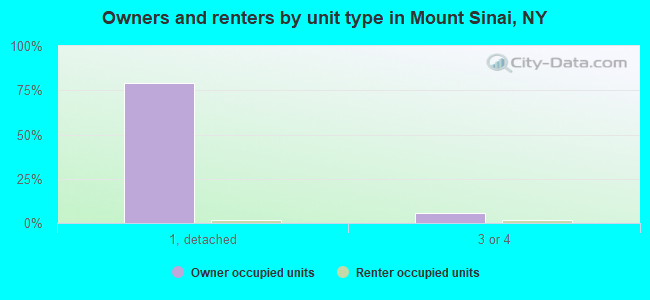
Houses: 4,029 (3,871 occupied: 3,748 owner occupied, 121 renter occupied)
| % of renters here: | 3% |
| State: | 46% |
Housing density: 765 houses/condos per square mile
Median price asked for vacant for-sale houses and condos in 2022: $922,641.
Median contract rent in 2022: over $2,000
Median rent asked for vacant for-rent units in 2022: $1,450
Median gross rent in Mount Sinai, NY in 2022: over $2,000
Housing units in Mount Sinai with a mortgage: 2,219 (217 second mortgage, 0 home equity loan, 190 both second mortgage and home equity loan)
Houses without a mortgage: 124
Median household income for houses/condos with a mortgage: $172,605
Median household income for apartments without a mortgage: $115,353
Median monthly housing costs: $2,510
Compare current foreclosures near Mount Sinai, NY:
| Photo | Address | Area | Beds / Baths | Price | Details |
|---|---|---|---|---|---|

|
#1
Avolet Ct
Mount Sinai, NY 11766
|
3,220 sq. feet
|
4 baths 5 beds |
show details | |

|
#2
Domino Way
Mount Sinai, NY 11766
|
2,675 sq. feet
|
3 baths 5 beds |
show details | |

|
#3
B Shore Rd
Mount Sinai, NY 11766
|
3,598 sq. feet
|
3 baths 4 beds |
show details | |

|
#4
Vale Ct
Mount Sinai, NY 11766
|
2,070 sq. feet
|
2 baths 4 beds |
show details | |

|
#5
Coram Rd Mt
Mount Sinai, NY 11766
|
- sq. feet
|
- baths - beds |
show details | |

|
#6
Sutton Ct
Mount Sinai, NY 11766
|
- sq. feet
|
- baths - beds |
show details | |

|
#7
Autumn Dr
Mount Sinai, NY 11766
|
- sq. feet
|
- baths - beds |
show details | |

|
#8
Miller Place Middle Island Rd
Mount Sinai, NY 11766
|
- sq. feet
|
- baths - beds |
show details | |

|
#9
Bayview Ave
Patchogue, NY 11772
|
1,488 sq. feet
|
1 baths 4 beds |
$585,000
|
show details |

|
#10
Laurel Ln
Shirley, NY 11967
|
1,032 sq. feet
|
1 baths 3 beds |
$479,900
|
show details |
| Photo | Address | Area | Beds / Baths | Price | Details |
|---|---|---|---|---|---|

|
#11
Greg Ln
Brentwood, NY 11717
|
1,425 sq. feet
|
2 baths 3 beds |
$519,900
|
show details |

|
#12
Silverleaf Ln
Islandia, NY 11749
|
1,932 sq. feet
|
3 baths 3 beds |
$667,900
|
show details |

|
#13
Houston Ct
Coram, NY 11727
|
650 sq. feet
|
1 baths 1 beds |
$219,900
|
show details |

|
#14
Rocky Point Yaphank Rd
Rocky Point, NY 11778
|
1,000 sq. feet
|
1 baths 2 beds |
$189,900
|
show details |

|
#15
Rocky Point Yaphank Rd
Rocky Point, NY 11778
|
850 sq. feet
|
1 baths 1 beds |
$192,900
|
show details |

|
#16
Albright Rd
Coram, NY 11727
|
15,246 sq. feet
|
2 baths 4 beds |
$549,900
|
show details |

|
#17
Jillit Dr
Smithtown, NY 11787
|
1,480 sq. feet
|
1 baths 3 beds |
$775,000
|
show details |

|
#18
Lorring St
Patchogue, NY 11772
|
1,230 sq. feet
|
2 baths 3 beds |
$342,400
|
show details |

|
#19
Timber Ridge Dr
Commack, NY 11725
|
2,564 sq. feet
|
2 baths 4 beds |
$884,000
|
show details |

|
#20
Salisbury Run
Mount Sinai, NY 11766
|
- sq. feet
|
- baths - beds |
show details |
| Photo | Address | Area | Beds / Baths | Price | Details |
|---|---|---|---|---|---|

|
#21
Casey Ln
Mount Sinai, NY 11766
|
- sq. feet
|
- baths - beds |
show details | |

|
#22
Plymouth Ave
Mount Sinai, NY 11766
|
- sq. feet
|
- baths - beds |
show details | |

|
#23
Jesse Way
Mount Sinai, NY 11766
|
- sq. feet
|
- baths - beds |
show details | |

|
#24
Biscayne Dr
Mount Sinai, NY 11766
|
- sq. feet
|
- baths - beds |
show details | |

|
#25
Avolet Ct
Mount Sinai, NY 11766
|
- sq. feet
|
- baths - beds |
show details | |

|
#26
Chestnut St
Mount Sinai, NY 11766
|
- sq. feet
|
- baths - beds |
show details | |

|
#27
Wheat Path Rd W
Mount Sinai, NY 11766
|
- sq. feet
|
- baths - beds |
show details | |

|
#28
Mill Dr
Mastic Beach, NY 11951
|
- sq. feet
|
1 baths 3 beds |
$244,900
|
show details |

|
#29
Superior St
Port Jefferson Station, NY 11776
|
- sq. feet
|
1 baths 3 beds |
$265,200
|
show details |

|
#30
Monet Ct
Middle Island, NY 11953
|
- sq. feet
|
1 baths 1 beds |
$189,900
|
show details |
| Photo | Address | Area | Beds / Baths | Price | Details |
|---|---|---|---|---|---|

|
#31
Brentwood Pkwy
Brentwood, NY 11717
|
- sq. feet
|
4 baths 5 beds |
$468,000
|
show details |

|
#32
Leaf Ave
Central Islip, NY 11722
|
- sq. feet
|
3 baths 5 beds |
$420,000
|
show details |

|
#33
Falcon Ave
Medford, NY 11763
|
- sq. feet
|
1 baths 3 beds |
$409,900
|
show details |

|
#34
Rocky Point Yaphank Rd Apt 146
Rocky Point, NY 11778
|
- sq. feet
|
1 baths 1 beds |
$199,900
|
show details |

|
#35
Hayfield Ct
Commack, NY 11725
|
- sq. feet
|
1 baths 3 beds |
$603,250
|
show details |

|
#36
Kirby Ln
Central Islip, NY 11722
|
- sq. feet
|
1 baths 3 beds |
$395,200
|
show details |

|
#37
Meadowbrook Dr
Sound Beach, NY 11789
|
- sq. feet
|
1 baths 3 beds |
$249,900
|
show details |

|
#38
Clark St
Patchogue, NY 11772
|
2,929 sq. feet
|
2 baths 5 beds |
show details | |

|
#39
Silas Carter Rd
Manorville, NY 11949
|
- sq. feet
|
- baths - beds |
$310,000
|
show details |

|
#40
Balsam Dr
Medford, NY 11763
|
1,382 sq. feet
|
2 baths 3 beds |
show details |
| Photo | Address | Area | Beds / Baths | Price | Details |
|---|---|---|---|---|---|

|
#41
Norfleet Ln
Coram, NY 11727
|
1,092 sq. feet
|
1 baths 3 beds |
show details | |

|
#42
Canterbury Dr
Wading River, NY 11792
|
4,248 sq. feet
|
5 baths 5 beds |
show details | |

|
#43
Gates Ave
Central Islip, NY 11722
|
988 sq. feet
|
1 baths 3 beds |
show details | |

|
#44
S Snedecor Ave
Bayport, NY 11705
|
3,100 sq. feet
|
3 baths 5 beds |
show details | |

|
#45
Morris Ave
Patchogue, NY 11772
|
1,207 sq. feet
|
1 baths 3 beds |
show details | |

|
#46
Boxwood Dr
Shirley, NY 11967
|
1,544 sq. feet
|
2 baths 3 beds |
show details | |

|
#47
Pulaski Rd
Kings Park, NY 11754
|
3,224 sq. feet
|
3 baths 4 beds |
show details | |

|
#48
Oak St
Centereach, NY 11720
|
2,224 sq. feet
|
2 baths 4 beds |
show details | |

|
#49
Alfred Ave
Calverton, NY 11933
|
3,063 sq. feet
|
3 baths 4 beds |
show details | |

|
Check over 1 million property listings on Foreclosure.com!
|
browse all offers | |||


 | Searching for homes in LI (51 replies) |
| Where to buy starter home in Nassau County? (29 replies) |
| Anyone you know get Covid recently? (478 replies) |
| Which north shore school district? (24 replies) |
| Town suggestions in Suffolk for first home purchase (27 replies) |
| real estate taxes (22 replies) |

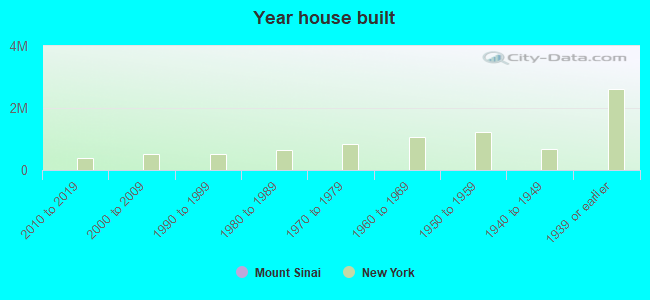
Median year apartment built: 2005
Household type by relationship:
Households: 11,648- Male householders: 1,844 (200 living alone), Female householders: 2,018 (371 living alone)
2,991 spouses (2,979 opposite-sex spouses), 72 unmarried partners, (57 opposite-sex unmarried partners), 3,941 children (3,782 natural, 25 adopted, 134 stepchildren), 378 grandchildren, 0 brothers or sisters, 155 parents, 0 foster children, 158 other relatives, 40 non-relatives
- In group quarters: 49
Size of family households: 1,538 2-persons, 487 3-persons, 821 4-persons, 192 5-persons, 169 6-persons, 57 7-or-more-persons.
Size of nonfamily households: 575 1-person, 49 2-persons, 2 3-persons.
2,046 married couples with children.
152 single-parent households (76 men, 76 women).
89.7% of residents of Mount Sinai speak English at home.
3.1% of residents speak Spanish at home (79% speak English very well, 21% speak English well).
4.5% of residents speak other Indo-European language at home (79% speak English very well, 17% speak English well, 5% speak English not well).
1.4% of residents speak Asian or Pacific Island language at home (65% speak English very well, 23% speak English well, 8% speak English not well, 3% don't speak English at all).
Foreign born population: 903 (7.8%)
(84.5% of them are naturalized citizens)
| Here: | 7.5 |
| State: | 6.3 |
| Here: | 4.2 |
| State: | 3.8 |
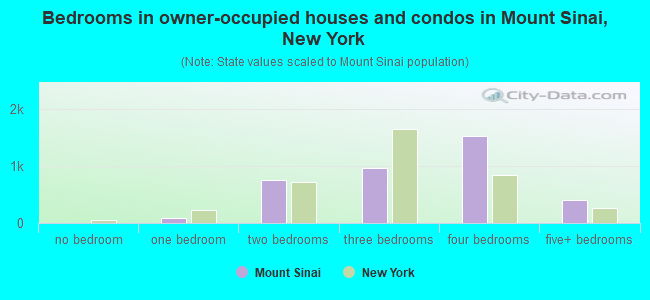
- Bedrooms in owner-occupied houses and condos in Mount Sinai, New York
- 0no bedroom
- 861 bedroom
- 7592 bedrooms
- 9723 bedrooms
- 1,5224 bedrooms
- 4095+ bedrooms
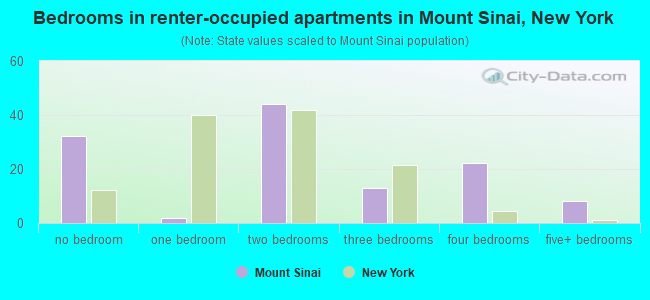
- Bedrooms in renter-occupied apartments in Mount Sinai, New York
- 32no bedroom
- 21 bedroom
- 442 bedrooms
- 133 bedrooms
- 224 bedrooms
- 85+ bedrooms
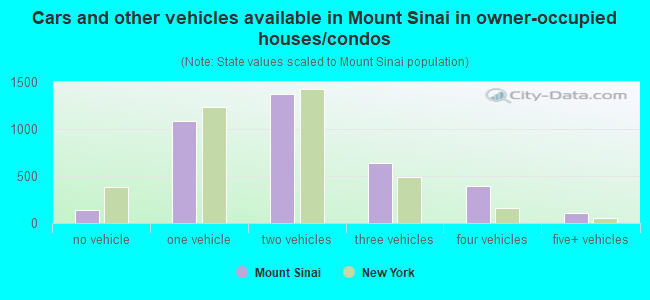
- Cars and other vehicles available in Mount Sinai in owner-occupied houses/condos
- 137no vehicle
- 1,0881 vehicle
- 1,3772 vehicles
- 6403 vehicles
- 3954 vehicles
- 1115+ vehicles
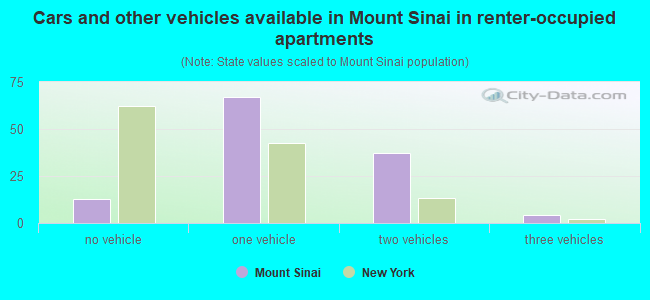
- Cars and other vehicles available in Mount Sinai in renter-occupied apartments
- 13no vehicle
- 671 vehicle
- 372 vehicles
- 43 vehicles
- 04 vehicles
- 05+ vehicles
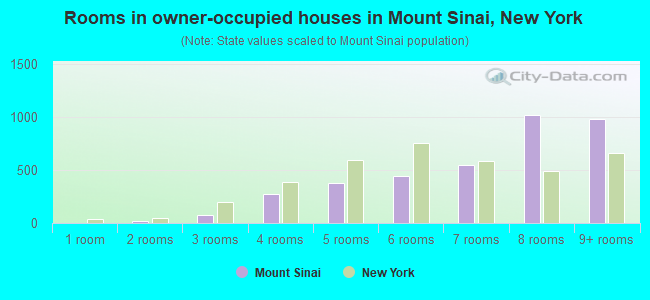
- Rooms in owner-occupied houses in Mount Sinai, New York
- 01 room
- 192 rooms
- 783 rooms
- 2764 rooms
- 3775 rooms
- 4466 rooms
- 5517 rooms
- 1,0208 rooms
- 9819+ rooms
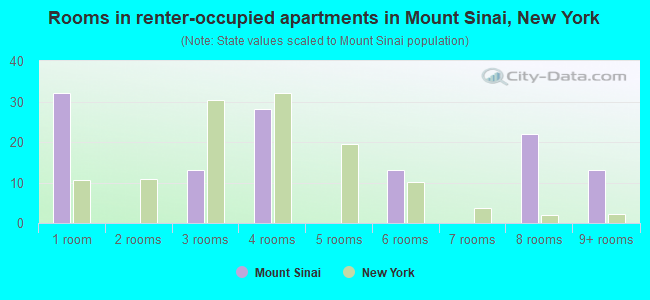
- Rooms in renter-occupied apartments in Mount Sinai, New York
- 321 room
- 02 rooms
- 133 rooms
- 284 rooms
- 05 rooms
- 136 rooms
- 07 rooms
- 228 rooms
- 139+ rooms
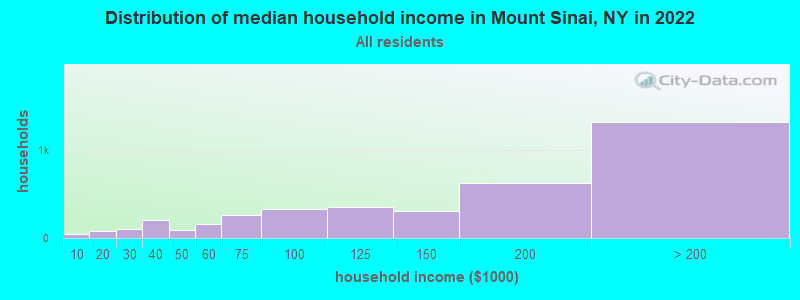
Mount Sinai, NY household income distribution

- 44Less than $10,000
- 75$10,000 to $19,999
- 105$20,000 to $29,999
- 207$30,000 to $39,999
- 89$40,000 to $49,999
- 154$50,000 to $59,999
- 257$60,000 to $74,999
- 326$75,000 to $99,999
- 357$100,000 to $124,999
- 303$125,000 to $149,999
- 624$150,000 to $199,999
- 1,323$200,000 or more
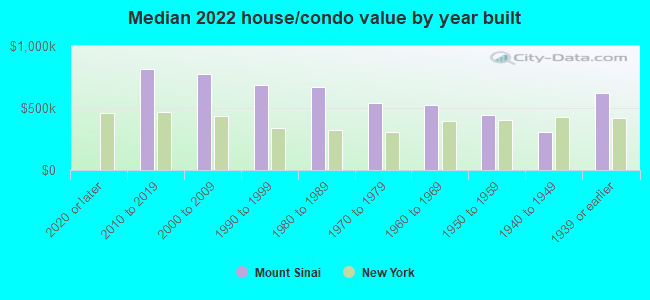
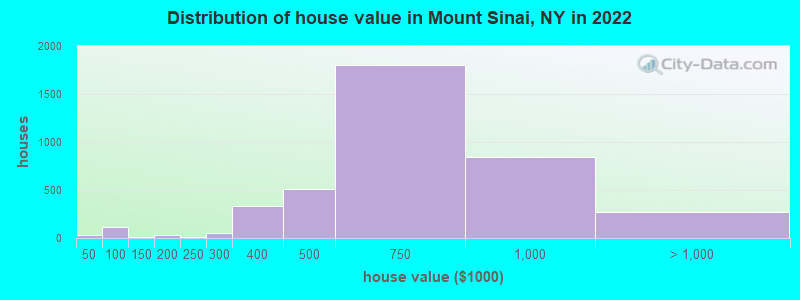
Home value of owner - occupied houses in 2022 in Mount Sinai, NY
-
- 20Less than $10,000
- 14$30,000 to $34,999
- 33$50,000 to $59,999
- 36$60,000 to $69,999
- 34$70,000 to $79,999
- 4$80,000 to $89,999
- 9$125,000 to $149,999
- 36$150,000 to $174,999
- 11$200,000 to $249,999
- 56$250,000 to $299,999
- 338$300,000 to $399,999
- 506$400,000 to $499,999
- 1,801$500,000 to $749,999
- 845$750,000 to $999,999
- 162$1,000,000 to $1,499,999
- 113$2,000,000 or more
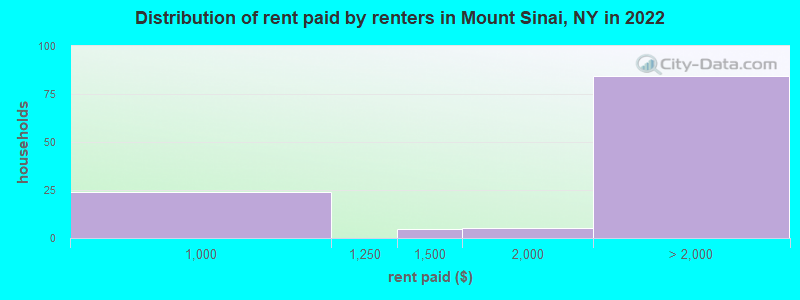
Rent paid by renters in 2022 in Mount Sinai, NY
-
- 24$900 to $999
- 4$1,250 to $1,499
- 5$1,500 to $1,999
- 22$2,000 to $2,499
- 9$3,000 to $3,499
- 36$3,500 or more
- 14No cash rent
Percentage of workers working in this county: 88.8%
Number of people working at home: 865 (16.4% of all workers)
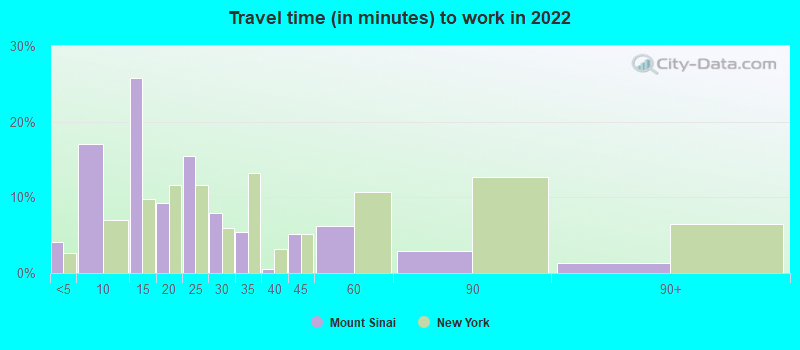
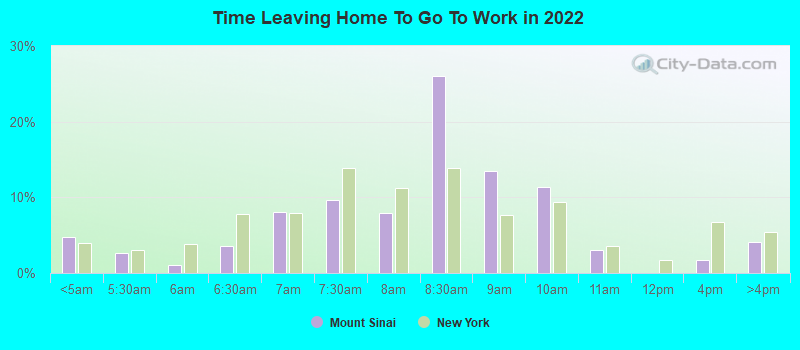
Travel time to work (commute)
- Less than 5 minutes: 148
- 5 to 9 minutes: 641
- 10 to 14 minutes: 400
- 15 to 19 minutes: 379
- 20 to 24 minutes: 645
- 25 to 29 minutes: 335
- 30 to 34 minutes: 508
- 35 to 39 minutes: 68
- 40 to 44 minutes: 158
- 45 to 59 minutes: 561
- 60 to 89 minutes: 326
- 90 or more minutes: 305
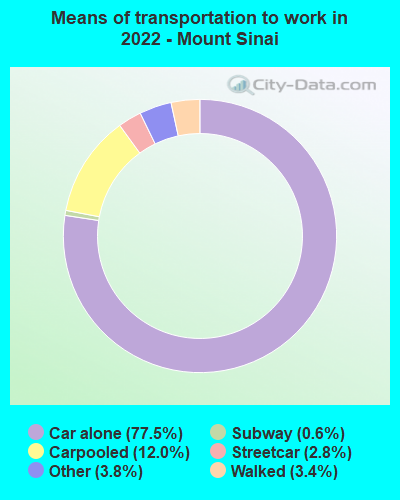
Means of transportation to work:
- Drove a car alone: 1,444 (55.1%)
- Carpooled: 255 (9.7%)
- Subway or elevated rail: 55 (2.1%)
- Long-distance train or commuter rail: 12 (0.5%)
- Taxi: 87 (3.3%)
- Walked: 67 (2.6%)
- Worked at home: 865 (33.0%)
- Unemployment by race in 2022
- Unemployment rate for White non-Hispanic residents
- 6.6%Males
- 3.2%Females
- Unemployment rate for Black residents
- 13.2%Males
- Unemployment rate for Asian residents
- 4.7%Males
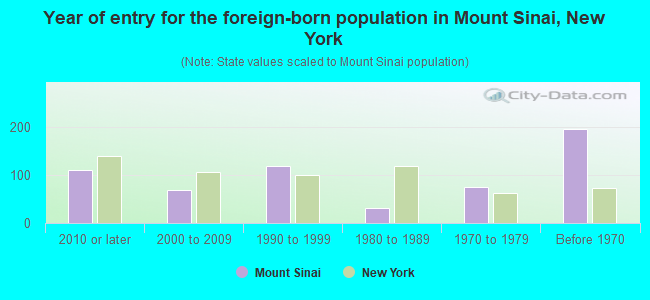
- Year of entry for the foreign-born population in Mount Sinai, New York
- 1112010 or later
- 692000 to 2009
- 1181990 to 1999
- 311980 to 1989
- 761970 to 1979
- 196Before 1970
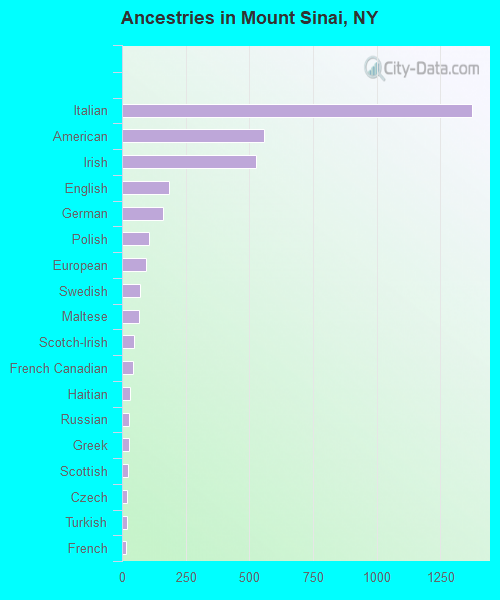
First ancestries reported:
- Italian: 1,373 (31.8%)
- American: 556 (12.9%)
- Irish: 525 (12.2%)
- English: 186 (4.3%)
- German: 162 (3.8%)
- Polish: 108 (2.5%)
- European: 95 (2.2%)
- Swedish: 69 (1.6%)
- Maltese: 67 (1.6%)
- Scotch-Irish: 47 (1.1%)
- French Canadian: 43 (1.0%)
- Haitian: 32 (0.7%)
- Russian: 29 (0.7%)
- Greek: 28 (0.6%)
- Scottish: 24 (0.6%)
- Czech: 19 (0.4%)
- Turkish: 18 (0.4%)
- French: 14 (0.3%)
- Slovak: 11 (0.3%)
- Austrian: 10 (0.2%)
- Iranian: 8 (0.2%)
- Eastern European: 7 (0.2%)
- West Indian: 5 (0.1%)
- Welsh: 4 (0.09%)
- Armenian: 3 (0.07%)
- Croatian: 3 (0.07%)
Most common places of birth for foreign-born residents (%):
| Mount Sinai: | 12.7% (106) |
| New York: | 1.8% (81,374) |
| Mount Sinai: | 10.4% (87) |
| New York: | 4.8% (214,559) |
| Mount Sinai: | 5.4% (45) |
| New York: | 3.5% (158,432) |
| Mount Sinai: | 5.3% (44) |
| New York: | 0.0% (1,655) |
| Mount Sinai: | 5.2% (43) |
| New York: | 1.8% (82,786) |
| Mount Sinai: | 5.2% (43) |
| New York: | 2.6% (117,288) |
| Mount Sinai: | 4.8% (40) |
| New York: | 0.9% (38,713) |
| Mount Sinai: | 4.0% (33) |
| New York: | 0.5% (23,058) |
| Mount Sinai: | 3.7% (31) |
| New York: | 2.0% (91,070) |
| Mount Sinai: | 3.7% (31) |
| New York: | 1.4% (65,102) |
| Mount Sinai: | 3.5% (29) |
| New York: | 1.2% (54,759) |
| Mount Sinai: | 3.2% (27) |
| New York: | 2.8% (126,936) |
| Mount Sinai: | 3.0% (25) |
| New York: | 0.7% (30,619) |
| Mount Sinai: | 2.9% (24) |
| New York: | 1.4% (62,442) |
| Mount Sinai: | 2.2% (18) |
| New York: | 9.1% (410,910) |
| Mount Sinai: | 2.0% (17) |
| New York: | 0.5% (21,009) |
| Mount Sinai: | 2.0% (17) |
| New York: | 2.5% (111,920) |
| Mount Sinai: | 1.9% (16) |
| New York: | 0.4% (18,218) |
| Mount Sinai: | 1.7% (14) |
| New York: | 0.6% (26,772) |
| Mount Sinai: | 1.7% (14) |
| New York: | 0.1% (4,732) |
| Mount Sinai: | 1.6% (13) |
| New York: | 0.8% (33,869) |
Place of birth for U.S.-born residents:
- This state: 9,632
- Other state: 971
- Northeast: 471
- Midwest: 51
- South: 283
- West: 137
90.8% of Mount Sinai residents lived in the same house 1 years ago.
Out of people who lived in different houses, 39.8% lived in this county.
Out of people who lived in different counties, 44.5% lived in New York.
| Mount Sinai: | 90.8% |
| State average: | 89.6% |
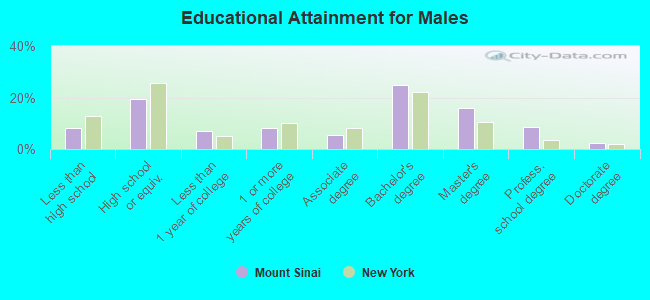
Education attainment for males 25 years and older:
- No schooling: 117
- Nursery to 4th grade: 0
- 5th and 6th grade: 19
- 7th and 8th grade: 10
- 9th grade: 51
- 10th grade: 26
- 11th grade: 25
- 12th grade, no diploma: 84
- High school graduate (or equivalency): 802
- Less than 1 year of college: 296
- Some college more than 1 year, no degree: 335
- Associate degree: 223
- Bachelor's degree: 1,023
- Master's degree: 657
- Professional school degree: 359
- Doctorate degree: 102
Education attainment for females 25 years and older:
- No schooling: 3
- Nursery to 4th grade: 0
- 5th and 6th grade: 0
- 7th and 8th grade: 19
- 9th grade: 0
- 10th grade: 33
- 11th grade: 31
- 12th grade, no diploma: 110
- High school graduate (or equivalency): 885
- Less than 1 year of college: 231
- Some college more than 1 year, no degree: 243
- Associate degree: 381
- Bachelor's degree: 1,091
- Master's degree: 868
- Professional school degree: 113
- Doctorate degree: 85


Housing units in structures:
- One, detached: 3,247
- One, attached: 491
- Two: 35
- 3 or 4: 206
- 5 to 9: 31
- 20 to 49: 4
- 50 or more: 14
Housing units lacking complete kitchen facilities in 2022: 0.5%
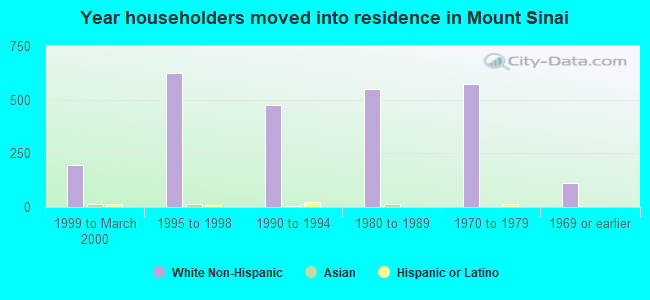
House/condo owner moved in on average 12 years ago
Renter moved in on average 0 years ago
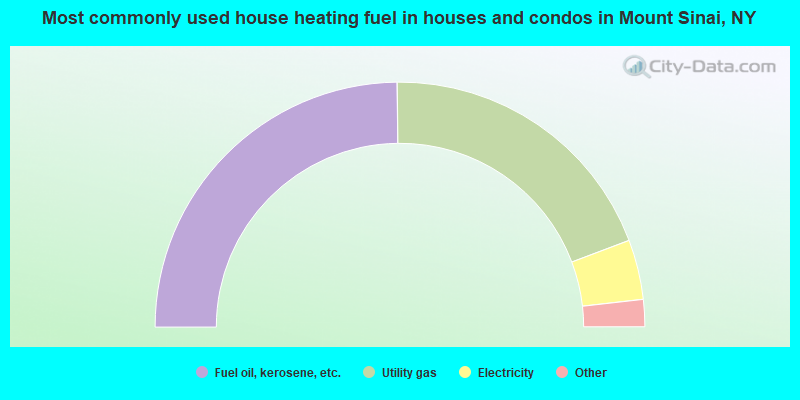
- 49.7%Fuel oil, kerosene, etc.
- 38.9%Utility gas
- 7.9%Electricity
- 2.4%Bottled, tank, or LP gas
- 0.9%Wood
- 0.1%Coal or coke
- 0.1%Solar energy
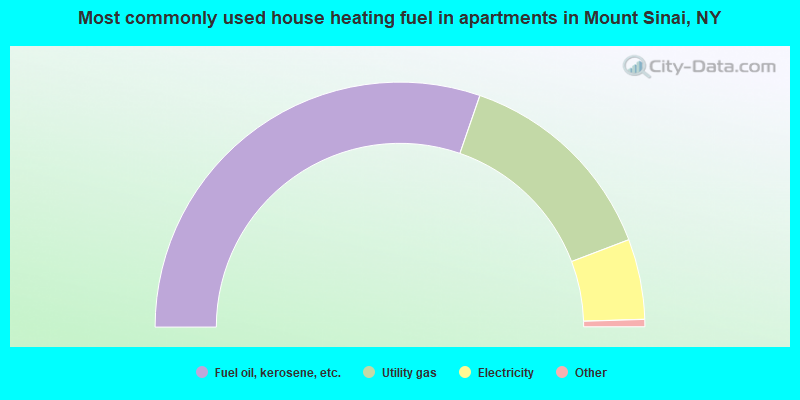
- 61.2%Fuel oil, kerosene, etc.
- 28.1%Utility gas
- 10.7%Electricity
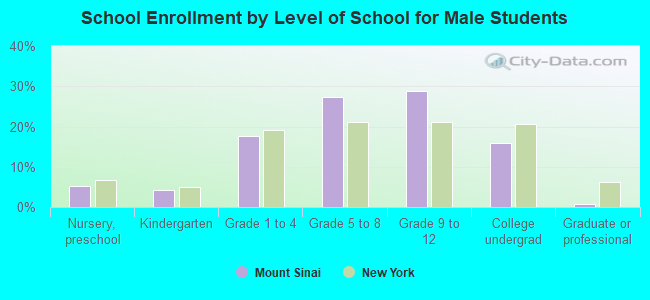
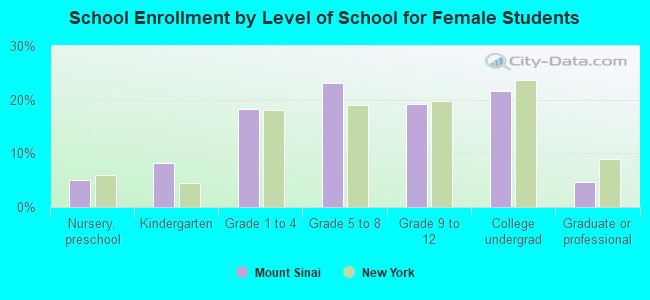
Private vs. public school enrollment:
| Here: | 2.1% |
| New York: | 15.6% |
| Here: | 3.0% |
| New York: | 15.0% |
| Here: | 9.9% |
| New York: | 39.2% |