Mount Vernon, MO (Missouri) Houses and Residents
| Mount Vernon: | $158,412 |
| Missouri: | $221,200 |
Mean price in 2022:
Detached houses: $244,544
Here: $244,544 State: $278,068
Total population: 4,504 (Urban population: 3,733 (all inside urban clusters), Rural population: 224 (all nonfarm))
Houses: 2,104 (1,792 occupied: 962 owner occupied, 856 renter occupied)
| % of renters here: | 47% |
| State: | 32% |
Housing density: 615 houses/condos per square mile
Median price asked for vacant for-sale houses and condos in 2022: $692,535.
Median contract rent in 2022: $400 (lower quartile is $337, upper quartile is $670)
Median rent asked for vacant for-rent units in 2022: $477
Median gross rent in Mount Vernon, MO in 2022: $634
Housing units in Mount Vernon with a mortgage: 526 (3 second mortgage, 0 home equity loan, 3 both second mortgage and home equity loan)
Houses without a mortgage: 0
Median household income for houses/condos with a mortgage: $69,195
Median monthly housing costs: $634
Compare current foreclosures near Mount Vernon, MO:
| Photo | Address | Area | Beds / Baths | Price | Details |
|---|---|---|---|---|---|

|
#1
S West St
Mount Vernon, MO 65712
|
1,288 sq. feet
|
1 baths 2 beds |
show details | |

|
#2
S Market St
Mount Vernon, MO 65712
|
2,104 sq. feet
|
2 baths 3 beds |
show details | |

|
#3
Wood St
Mount Vernon, MO 65712
|
1,324 sq. feet
|
2 baths 3 beds |
show details | |

|
#4
Lawrence 1112
Mount Vernon, MO 65712
|
1,500 sq. feet
|
2 baths 3 beds |
show details | |

|
#5
Fillmore St
Mount Vernon, MO 65712
|
1,040 sq. feet
|
1 baths 3 beds |
show details | |

|
#6
S Mccanse St
Mount Vernon, MO 65712
|
1,172 sq. feet
|
1 baths - beds |
show details | |

|
#7
Gibbs Ave Apt 3
Mount Vernon, MO 65712
|
- sq. feet
|
- baths - beds |
show details | |

|
#8
E Industrial Rd
Mount Vernon, MO 65712
|
- sq. feet
|
- baths - beds |
show details | |

|
#9
Mcvey St
Mount Vernon, MO 65712
|
- sq. feet
|
- baths - beds |
show details | |

|
#10
Kevin Dr
Mount Vernon, MO 65712
|
- sq. feet
|
- baths - beds |
show details |
| Photo | Address | Area | Beds / Baths | Price | Details |
|---|---|---|---|---|---|

|
#11
Oak Ln
Mount Vernon, MO 65712
|
- sq. feet
|
- baths - beds |
show details | |

|
#12
Barnett Rd
Marionville, MO 65705
|
1,683 sq. feet
|
2 baths 4 beds |
show details | |

|
#13
Highway K
Billings, MO 65610
|
2,676 sq. feet
|
2 baths 3 beds |
show details | |

|
#14
S Lincoln Ave
Aurora, MO 65605
|
800 sq. feet
|
1 baths 2 beds |
show details | |

|
#15
N Eisenhower St
Monett, MO 65708
|
1,620 sq. feet
|
2 baths 3 beds |
show details | |

|
#16
W State Route 266
Bois D Arc, MO 65612
|
1,044 sq. feet
|
1 baths 3 beds |
show details | |

|
#17
N Central Ave
Monett, MO 65708
|
1,900 sq. feet
|
1 baths 3 beds |
show details | |

|
#18
Brookside Cir
Monett, MO 65708
|
1,018 sq. feet
|
3 baths 3 beds |
show details | |

|
#19
W Odell
Marionville, MO 65705
|
1,472 sq. feet
|
1 baths 1 beds |
show details | |

|
#20
N Central Ave
Marionville, MO 65705
|
1,659 sq. feet
|
1 baths 3 beds |
show details |
| Photo | Address | Area | Beds / Baths | Price | Details |
|---|---|---|---|---|---|

|
#21
N Melody Ln
Marionville, MO 65705
|
1,062 sq. feet
|
1 baths 3 beds |
show details | |

|
#22
S Griffith Ave
Aurora, MO 65605
|
1,224 sq. feet
|
1 baths 3 beds |
show details | |

|
#23
Highway Vv
Wentworth, MO 64873
|
1,422 sq. feet
|
1 baths 2 beds |
show details | |

|
#24
W Plumb St
Aurora, MO 65605
|
1,456 sq. feet
|
1 baths 3 beds |
show details | |

|
#25
W 2nd St
Freistatt, MO 65654
|
1,212 sq. feet
|
1 baths 3 beds |
show details | |

|
#26
S Carnation Dr
Aurora, MO 65605
|
1,348 sq. feet
|
1 baths 2 beds |
show details | |

|
#27
Lawrence 2194
Monett, MO 65708
|
768 sq. feet
|
2 baths 3 beds |
show details | |

|
#28
Lawrence 2185
Marionville, MO 65705
|
1,372 sq. feet
|
1 baths - beds |
show details | |

|
#29
Lawrence 2210
Pierce City, MO 65723
|
1,352 sq. feet
|
1 baths - beds |
show details | |

|
#30
S Bridle Ln Apt A
Monett, MO 65708
|
- sq. feet
|
- baths - beds |
show details |
| Photo | Address | Area | Beds / Baths | Price | Details |
|---|---|---|---|---|---|

|
#31
E Hamilton Way Apt K2
Republic, MO 65738
|
- sq. feet
|
- baths - beds |
show details | |

|
#32
S Farm Road 25
Bois D Arc, MO 65612
|
- sq. feet
|
- baths - beds |
show details | |

|
#33
NE Main St
Billings, MO 65610
|
- sq. feet
|
- baths - beds |
show details | |

|
#34
W State Route 266
Bois D Arc, MO 65612
|
- sq. feet
|
- baths - beds |
show details | |

|
#35
Charles Rd
Billings, MO 65610
|
- sq. feet
|
- baths - beds |
show details | |

|
#36
Farm Road 2035
Monett, MO 65708
|
- sq. feet
|
- baths - beds |
show details | |

|
#37
N Pine St
Pierce City, MO 65723
|
- sq. feet
|
- baths - beds |
show details | |

|
#38
Fairway Dr
Monett, MO 65708
|
- sq. feet
|
- baths - beds |
show details | |

|
#39
Highway H Trlr 4
Monett, MO 65708
|
- sq. feet
|
- baths - beds |
show details | |

|
#40
Mark St
Billings, MO 65610
|
- sq. feet
|
- baths - beds |
show details |
| Photo | Address | Area | Beds / Baths | Price | Details |
|---|---|---|---|---|---|

|
#41
Oak Grove Ave
Monett, MO 65708
|
- sq. feet
|
- baths - beds |
show details | |

|
#42
Linden Ave # 8
Monett, MO 65708
|
- sq. feet
|
- baths - beds |
show details | |

|
#43
S Apple Ln
Marionville, MO 65705
|
- sq. feet
|
- baths - beds |
show details | |

|
#44
Vixen Rd
Sarcoxie, MO 64862
|
- sq. feet
|
- baths - beds |
show details | |

|
#45
Brittany Ct
Aurora, MO 65605
|
- sq. feet
|
- baths - beds |
show details | |

|
#46
Lawrence 1180
Aurora, MO 65605
|
- sq. feet
|
- baths - beds |
show details | |

|
#47
W Pleasant St
Aurora, MO 65605
|
- sq. feet
|
- baths - beds |
show details | |

|
#48
Fogle Dr Apt G
Aurora, MO 65605
|
- sq. feet
|
- baths - beds |
show details | |

|
#49
Birchwood Dr
Aurora, MO 65605
|
- sq. feet
|
- baths - beds |
show details | |

|
Check over 1 million property listings on Foreclosure.com!
|
browse all offers | |||


Median year apartment built: 1984
Household type by relationship:
Households: 4,528- Male householders: 834 (298 living alone), Female householders: 945 (404 living alone)
716 spouses (716 opposite-sex spouses), 183 unmarried partners, (183 opposite-sex unmarried partners), 1,124 children (884 natural, 0 adopted, 239 stepchildren), 210 grandchildren, 58 brothers or sisters, 17 parents, 0 foster children, 8 other relatives, 19 non-relatives
- In group quarters: 410
Size of family households: 357 2-persons, 175 3-persons, 242 4-persons, 92 5-persons, 43 6-persons.
Size of nonfamily households: 727 1-person, 180 2-persons.
668 married couples with children.
199 single-parent households (163 men, 36 women).
99.2% of residents of Mount Vernon speak English at home.
0.6% of residents speak Spanish at home (100% speak English very well).
0.4% of residents speak other Indo-European language at home (100% speak English well).
Foreign born population: 50 (1.1%)
(102.0% of them are naturalized citizens)
| Here: | 6.1 |
| State: | 6.4 |
| Here: | 4.7 |
| State: | 4.4 |

- Bedrooms in owner-occupied houses and condos in Mount Vernon, Missouri
- 0no bedroom
- 151 bedroom
- 1672 bedrooms
- 5813 bedrooms
- 1754 bedrooms
- 245+ bedrooms

- Bedrooms in renter-occupied apartments in Mount Vernon, Missouri
- 88no bedroom
- 1111 bedroom
- 3552 bedrooms
- 2653 bedrooms
- 04 bedrooms
- 385+ bedrooms

- Cars and other vehicles available in Mount Vernon in owner-occupied houses/condos
- 50no vehicle
- 3871 vehicle
- 4412 vehicles
- 723 vehicles
- 54 vehicles
- 75+ vehicles

- Cars and other vehicles available in Mount Vernon in renter-occupied apartments
- 162no vehicle
- 2911 vehicle
- 3192 vehicles
- 153 vehicles
- 694 vehicles
- 05+ vehicles

- Rooms in owner-occupied houses in Mount Vernon, Missouri
- 01 room
- 02 rooms
- 03 rooms
- 1194 rooms
- 1835 rooms
- 2666 rooms
- 1897 rooms
- 248 rooms
- 1839+ rooms

- Rooms in renter-occupied apartments in Mount Vernon, Missouri
- 881 room
- 132 rooms
- 553 rooms
- 2314 rooms
- 2315 rooms
- 896 rooms
- 547 rooms
- 568 rooms
- 389+ rooms


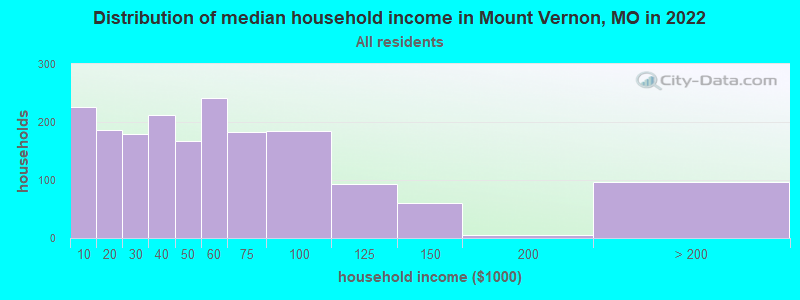
Mount Vernon, MO household income distribution

- 226Less than $10,000
- 187$10,000 to $19,999
- 180$20,000 to $29,999
- 212$30,000 to $39,999
- 167$40,000 to $49,999
- 241$50,000 to $59,999
- 182$60,000 to $74,999
- 185$75,000 to $99,999
- 93$100,000 to $124,999
- 60$125,000 to $149,999
- 5$150,000 to $199,999
- 96$200,000 or more
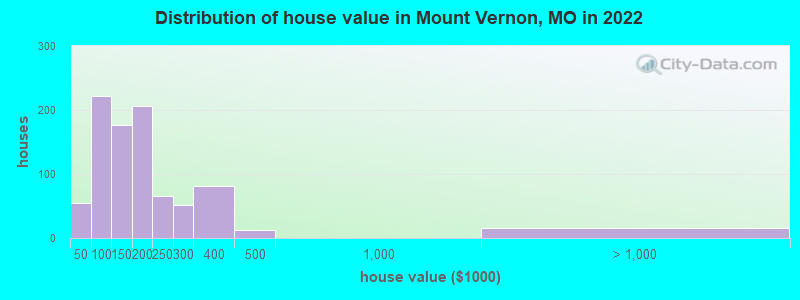
Home value of owner - occupied houses in 2022 in Mount Vernon, MO
-
- 11Less than $10,000
- 38$10,000 to $14,999
- 5$20,000 to $24,999
- 90$50,000 to $59,999
- 54$60,000 to $69,999
- 48$70,000 to $79,999
- 15$80,000 to $89,999
- 12$90,000 to $99,999
- 51$100,000 to $124,999
- 125$125,000 to $149,999
- 57$150,000 to $174,999
- 149$175,000 to $199,999
- 65$200,000 to $249,999
- 52$250,000 to $299,999
- 81$300,000 to $399,999
- 13$400,000 to $499,999
- 15$2,000,000 or more
Rent paid by renters in 2022 in Mount Vernon, MO
-
- 15$100 to $149
- 9$200 to $249
- 66$250 to $299
- 130$300 to $349
- 234$350 to $399
- 39$400 to $449
- 5$450 to $499
- 28$500 to $549
- 15$550 to $599
- 159$600 to $649
- 17$650 to $699
- 6$700 to $749
- 0$750 to $799
- 123$800 to $899
- 7$1,250 to $1,499
- 12No cash rent


Percentage of workers working in this county: 57.4%
Number of people working at home: 235 (12.7% of all workers)
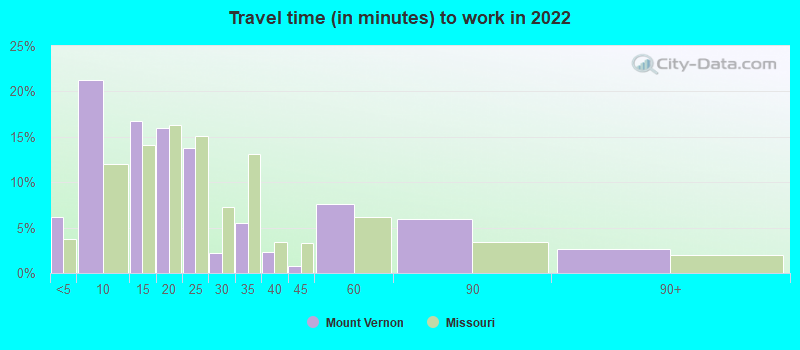
Travel time to work (commute)
- Less than 5 minutes: 122
- 5 to 9 minutes: 247
- 10 to 14 minutes: 260
- 15 to 19 minutes: 239
- 20 to 24 minutes: 90
- 25 to 29 minutes: 68
- 30 to 34 minutes: 130
- 35 to 39 minutes: 31
- 40 to 44 minutes: 78
- 45 to 59 minutes: 154
- 60 to 89 minutes: 168
- 90 or more minutes: 21
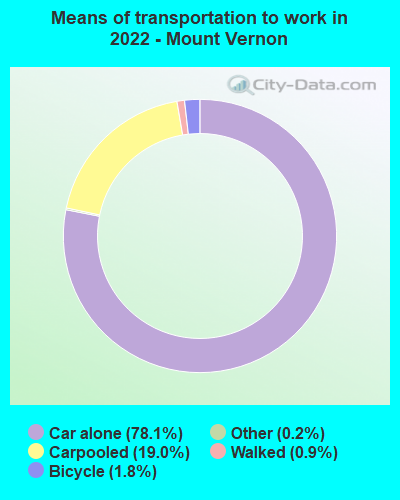
Means of transportation to work:
- Drove a car alone: 1,884 (70.5%)
- Carpooled: 465 (17.4%)
- Taxi: 4 (0.1%)
- Bicycle: 45 (1.7%)
- Walked: 21 (0.8%)
- Worked at home: 235 (8.8%)

- Unemployment by race in 2022
- Unemployment rate for White non-Hispanic residents
- 2.8%Males

- Year of entry for the foreign-born population in Mount Vernon, Missouri
- 02010 or later
- 142000 to 2009
- 01990 to 1999
- 01980 to 1989
- 01970 to 1979
- 4Before 1970

First ancestries reported:
- German: 495 (25.7%)
- American: 445 (23.1%)
- English: 183 (9.5%)
- Irish: 179 (9.3%)
- Polish: 93 (4.8%)
- Italian: 63 (3.3%)
- Scottish: 38 (2.0%)
- British: 20 (1.0%)
- Dutch: 18 (0.9%)
- French: 15 (0.8%)
- European: 13 (0.7%)
- Scotch-Irish: 11 (0.6%)
Most common places of birth for foreign-born residents (%):
| Mount Vernon: | 36.0% (18) |
| Missouri: | 0.3% (826) |
| Mount Vernon: | 30.0% (15) |
| Missouri: | 3.0% (7,803) |
| Mount Vernon: | 18.0% (9) |
| Missouri: | 1.5% (3,767) |
Place of birth for U.S.-born residents:
- This state: 3,258
- Other state: 1,116
- Northeast: 212
- Midwest: 341
- South: 348
- West: 216
81.3% of Mount Vernon residents lived in the same house 1 years ago.
Out of people who lived in different houses, 29.8% lived in this county.
Out of people who lived in different counties, 76.9% lived in Missouri.
| Mount Vernon: | 81.3% |
| State average: | 87.1% |
Education attainment for males 25 years and older:
- No schooling: 27
- Nursery to 4th grade: 0
- 5th and 6th grade: 0
- 7th and 8th grade: 19
- 9th grade: 0
- 10th grade: 32
- 11th grade: 54
- 12th grade, no diploma: 5
- High school graduate (or equivalency): 700
- Less than 1 year of college: 94
- Some college more than 1 year, no degree: 328
- Associate degree: 34
- Bachelor's degree: 172
- Master's degree: 26
- Professional school degree: 8
- Doctorate degree: 0

Education attainment for females 25 years and older:
- No schooling: 21
- Nursery to 4th grade: 0
- 5th and 6th grade: 0
- 7th and 8th grade: 95
- 9th grade: 34
- 10th grade: 38
- 11th grade: 38
- 12th grade, no diploma: 68
- High school graduate (or equivalency): 618
- Less than 1 year of college: 103
- Some college more than 1 year, no degree: 115
- Associate degree: 222
- Bachelor's degree: 228
- Master's degree: 6
- Professional school degree: 102
- Doctorate degree: 0


Housing units in structures:
- One, detached: 1,723
- One, attached: 73
- Two: 55
- 3 or 4: 75
- 10 to 19: 99
- 20 to 49: 15
- Mobile homes: 61
Housing units lacking complete kitchen facilities in 2022: 4.9%
House/condo owner moved in on average 10 years ago
Renter moved in on average 2 years ago

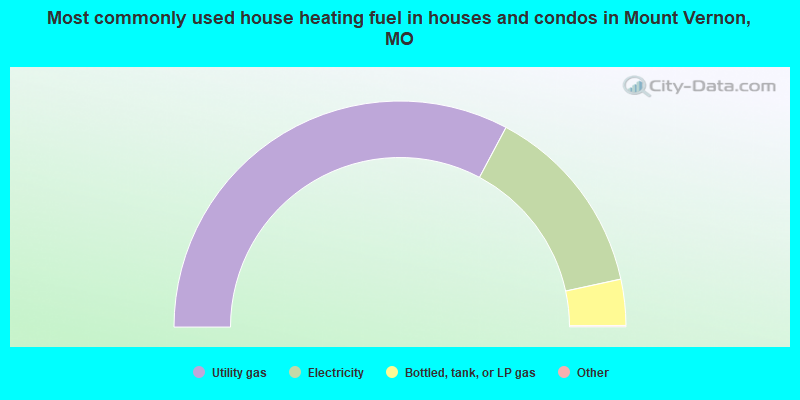
- 65.7%Utility gas
- 27.7%Electricity
- 6.6%Bottled, tank, or LP gas
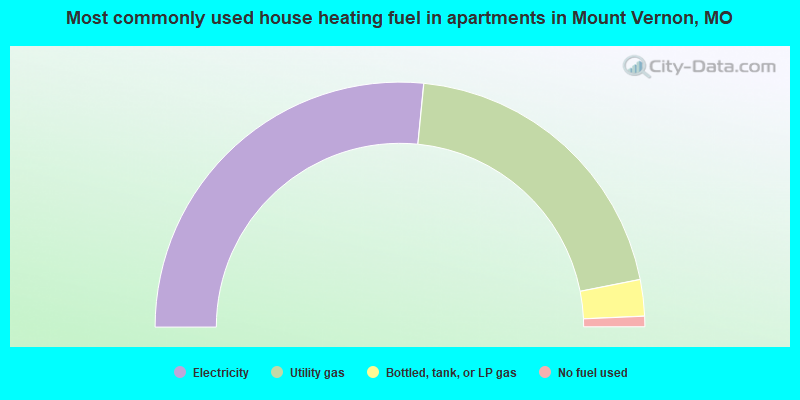
- 53.1%Electricity
- 40.7%Utility gas
- 4.8%Bottled, tank, or LP gas
- 1.4%No fuel used
Private vs. public school enrollment:
| Here: | 9.2% |
| Missouri: | 15.4% |
| Here: | 25.1% |
| Missouri: | 13.9% |
| Here: | 36.8% |
| Missouri: | 22.6% |


