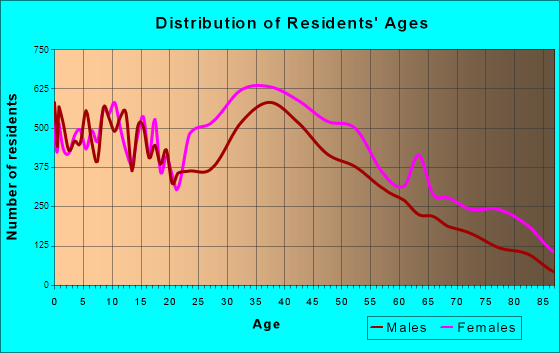
Mount Vernon, NY (New York) Houses and Residents
Estimated median house or condo value in 2022: $382,000 (it was $224,300 in 2000 )
Mount Vernon:
$382,000New York:
$400,400
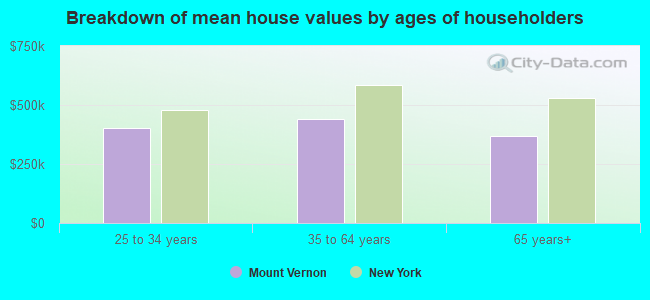
Lower value quartile - upper value quartile: $255,800 - $609,900Mean price in 2022: Detached houses: $533,816 Here:
$533,816State:
$476,719
Townhouses or other attached units: $378,360 Here:
$378,360State:
$699,270
In 2-unit structures: $417,160 Here:
$417,160State:
$713,077
In 3-to-4-unit structures: $449,189 Here:
$449,189State:
$764,568
In 5-or-more-unit structures: $228,264 Here:
$228,264State:
$912,009
Total population: 68,458 (Urban population: 68,381, Rural population: 0)
Houses: 30,642 (28,869 occupied: 11,080 owner occupied, 17,789 renter occupied )
% of renters here:
62%State:
46%
Housing density: 7,030 houses/condos per square mile
Median price asked for vacant for-sale houses and condos in 2022: $244,324.
Median contract rent in 2022: $1,341 (lower quartile is $960, upper quartile is $1,791)
Median rent asked for vacant for-rent units in 2022: $2,748
Median gross rent in Mount Vernon, NY in 2022: $1,472
Housing units in Mount Vernon with a mortgage: 7,244 (864 second mortgage, 55 home equity loan, 621 both second mortgage and home equity loan )Houses without a mortgage: 79
Median household income for houses/condos with a mortgage: $129,022
Median household income for apartments without a mortgage: $142,027
Median monthly housing costs: $1,613
Data:
Median house or condo value ($)
Median house or condo value ($ change since 2000)
Median house or condo value ($) - White
Median house or condo value ($) - Black or African American
Median house or condo value ($) - Asian
Median house or condo value ($) - Hispanic or Latino
Median house or condo value ($) - American Indian and Alaska Native
Median house or condo value ($) - Multirace
Median house or condo value ($) - Other Race
Median price asked for mobile homes ($)
Household density (households per square mile)
Mean house or condo value by units in structure - 1, detached ($)
Mean house or condo value by units in structure - 1, attached ($)
Mean house or condo value by units in structure - 2 ($)
Mean house or condo value by units in structure by units in structure - 3 or 4 ($)
Mean house or condo value by units in structure - 5 or more ($)
Mean house or condo value by units in structure - Boat, RV, van, etc. ($)
Mean house or condo value by units in structure - Mobile home ($)
Median contract rent ($)
Median contract rent - Lower quartile ($)
Median contract rent - Upper quartile ($)
Median gross rent ($)
Urban houses (%)
Rural houses (%)
Houses occupied (%)
Houses occupied (% change since 2000)
Houses owner occupied (%)
Houses owner occupied (% change since 2000)
Houses renter occupied (%)
Houses renter occupied (% change since 2000)
Vacant housing units - For rent (%)
Vacant housing units - For rent (% change since 2000)
Vacant housing units - For sale only (%)
Vacant housing units - For sale only (% change since 2000)
Vacant housing units - Rented or sold, not occupied (%)
Vacant housing units - Rented or sold, not occupied (% change since 2000)
Vacant housing units - For seasonal, recreational, or occasional use (%)
Vacant housing units - For seasonal, recreational, or occasional use (% change since 2000)
Vacant housing units - For migrant workers (%)
Vacant housing units - For migrant workers (% change since 2000)
Vacant housing units - Other vacant (%)
Vacant housing units - Other vacant (% change since 2000)
Median monthly housing costs ($)
Median household income for houses/condos with a mortgage ($)
Median household income for houses/condos without a mortgage ($)
Median household income ($)
Median household income ($) - White
Median household income ($) - Black or African American
Median household income ($) - Asian
Median household income ($) - Hispanic or Latino
Median household income ($) - American Indian and Alaska Native
Median household income ($) - Multirace
Median household income ($) - Other Race
Mortgage status - with mortgage (%)
Mortgage status - with second mortgage (%)
Mortgage status - with home equity loan (%)
Mortgage status - with both second mortgage and home equity loan (%)
Mortgage status - without a mortgage (%)
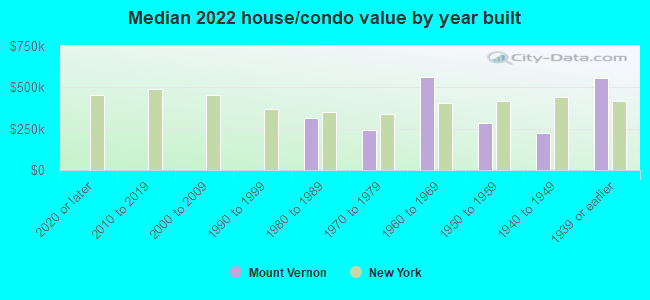
Median year house/condo built
Median year apartment built
Household type by relationship - Male householder living alone (%)
Household type by relationship - Male householder not living alone (%)
Household type by relationship - Female householder living alone (%)
Household type by relationship - Female householder not living alone (%)
Household type by relationship - Opposite-Sex spouse (%)
Household type by relationship - Same-Sex spouse (%)
Household type by relationship - Opposite-Sex unmarried partner (%)
Household type by relationship - Same-Sex unmarried partner (%)
Household type by relationship - In group quarters (%)
Size of family households - 2-person household (%)
Size of family households - 3-person household (%)
Size of family households - 4-person household (%)
Size of family households - 5-person household (%)
Size of family households - 6-person household (%)
Size of family households - 7-or-more-person household (%)
Size of nonfamily households - 1-person household (%)
Size of nonfamily households - 2-person household (%)
Size of nonfamily households - 3-person household (%)
Size of nonfamily households - 4-person household (%)
Size of nonfamily households - 5-person household (%)
Size of nonfamily households - 6-person household (%)
Size of nonfamily households - 7-or-moreperson household (%)
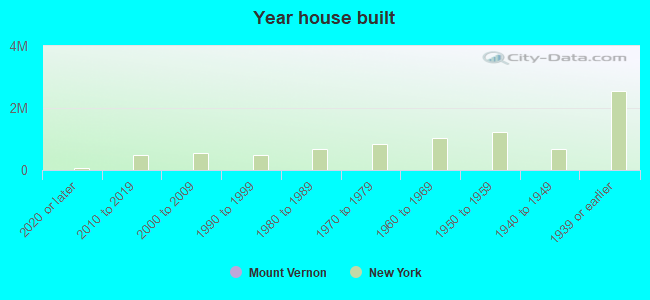
Year house built - Built 2010 or later (%)
Year house built - Built 2000 to 2009 (%)
Year house built - Built 1990 to 1999 (%)
Year house built - Built 1980 to 1989 (%)
Year house built - Built 1970 to 1979 (%)
Year house built - Built 1960 to 1969 (%)
Year house built - Built 1950 to 1959 (%)
Year house built - Built 1940 to 1949 (%)
Year house built - Built 1939 or earlier (%)
Median number of rooms in houses and condos
Median number of rooms in apartments
Median number of bedrooms in owner occupied houses
Mean number of bedrooms in owner occupied houses
Median number of bedrooms in renter occupied houses
Mean number of bedrooms in renter occupied houses
Median number of vehichles in owner occupied houses
Mean number of vehichles in owner occupied houses
Median number of vehichles in renter occupied houses
Mean number of vehichles in renter occupied houses
Rooms in owner-occupied houses - 1 room (%)
Rooms in owner-occupied houses - 2 rooms (%)
Rooms in owner-occupied houses - 3 rooms (%)
Rooms in owner-occupied houses - 4 rooms (%)
Rooms in owner-occupied houses - 5 rooms (%)
Rooms in owner-occupied houses - 6 rooms (%)
Rooms in owner-occupied houses - 7 rooms (%)
Rooms in owner-occupied houses - 8 rooms (%)
Rooms in owner-occupied houses - 9+ rooms (%)
Rooms in renter-occupied houses - 1 room (%)
Rooms in renter-occupied houses - 2 rooms (%)
Rooms in renter-occupied houses - 3 rooms (%)
Rooms in renter-occupied houses - 4 rooms (%)
Rooms in renter-occupied houses - 5 rooms (%)
Rooms in renter-occupied houses - 6 rooms (%)
Rooms in renter-occupied houses - 7 rooms (%)
Rooms in renter-occupied houses - 8 rooms (%)
Rooms in renter-occupied houses - 9+ rooms (%)
Bedrooms in owner-occupied houses - no bedrooms (%)
Bedrooms in owner-occupied houses - 1 bedroom (%)
Bedrooms in owner-occupied houses - 2 bedrooms (%)
Bedrooms in owner-occupied houses - 3 bedrooms (%)
Bedrooms in owner-occupied houses - 4 bedrooms (%)
Bedrooms in owner-occupied houses - 5+ bedrooms (%)
Bedrooms in renter-occupied houses - no bedrooms (%)
Bedrooms in renter-occupied houses - 1 bedroom (%)
Bedrooms in renter-occupied houses - 2 bedrooms (%)
Bedrooms in renter-occupied houses - 3 bedrooms (%)
Bedrooms in renter-occupied houses - 4 bedrooms (%)
Bedrooms in renter-occupied houses - 5+ bedrooms (%)
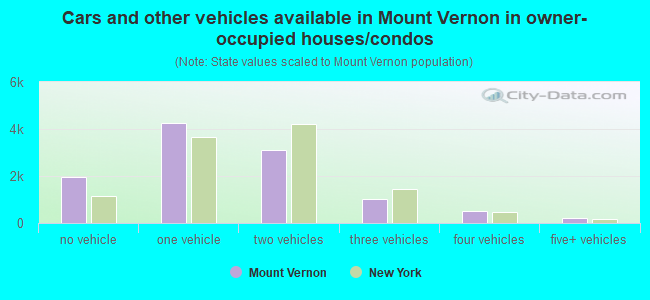
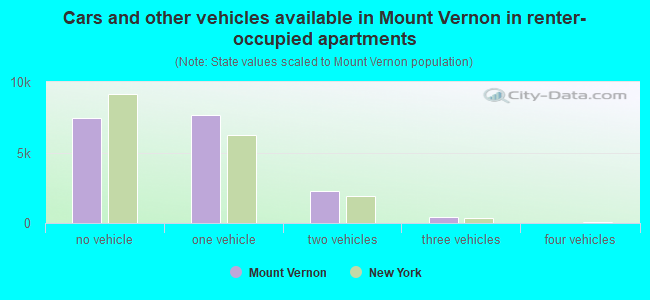
Vehicles available in owner-occupied houses - no vehicle available (%)
Vehicles available in owner-occupied houses - 1 vehicle available(%)
Vehicles available in owner-occupied houses - 2 Vehicles available (%)
Vehicles available in owner-occupied houses - 3 Vehicles available (%)
Vehicles available in owner-occupied houses - 4 Vehicles available (%)
Vehicles available in owner-occupied houses - 5+ Vehicles available (%)
Vehicles available in renter-occupied houses - no vehicle available (%)
Vehicles available in renter-occupied houses - 1 vehicle available (%)
Vehicles available in renter-occupied houses - 2 Vehicles available (%)
Vehicles available in renter-occupied houses - 3 Vehicles available (%)
Vehicles available in renter-occupied houses - 4 Vehicles available (%)
Vehicles available in renter-occupied houses - 5+ Vehicles available (%)
Housing units in structures - 1, detached (%)
Housing units in structures - 1, attached (%)
Housing units in structures - 2 (%)
Housing units in structures - 3 or 4 (%)
Housing units in structures - 5 to 9 (%)
Housing units in structures - 10 to 19 (%)
Housing units in structures - 20 to 49 (%)
Housing units in structures - 50 or more (%)
Housing units in structures - Mobile home (%)
Housing units in structures - Boat, RV, van, etc. (%)
Housing units in structures - Owners - 1, detached (%)
Housing units in structures - Owners - 1, attached (%)
Housing units in structures - Owners - 2 (%)
Housing units in structures - Owners - 3 or 4 (%)
Housing units in structures - Owners - 5 to 9 (%)
Housing units in structures - Owners - 10 to 19 (%)
Housing units in structures - Owners - 20 to 49 (%)
Housing units in structures - Owners - 50 or more (%)
Housing units in structures - Owners - Mobile home (%)
Housing units in structures - Owners - Boat, RV, van, etc. (%)
Housing units in structures - Renters - 1, detached (%)
Housing units in structures - Renters - 1, attached (%)
Housing units in structures - Renters - 2 (%)
Housing units in structures - Renters - 3 or 4 (%)
Housing units in structures - Renters - 5 to 9 (%)
Housing units in structures - Renters - 10 to 19 (%)
Housing units in structures - Renters - 20 to 49 (%)
Housing units in structures - Renters - 50 or more (%)
Housing units in structures - Renters - Mobile home (%)
Housing units in structures - Renters - Boat, RV, van, etc. (%)
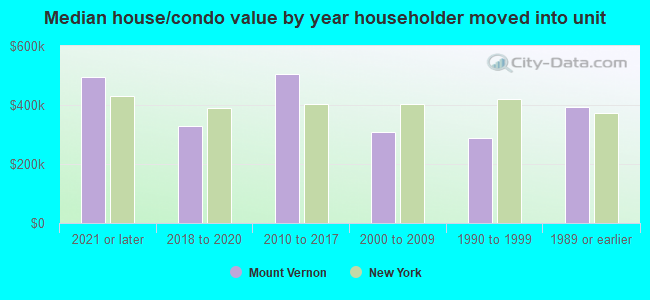
House/condo owner moved in on average (years ago)
Renter moved in on average (years ago)
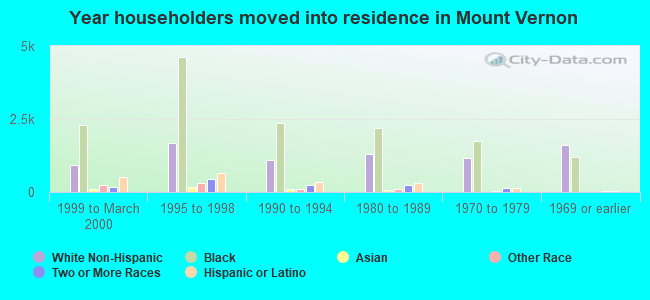
Year householder moved into unit - Moved in 1999 to March 2000 (%)
Year householder moved into unit - Moved in 1999 to March 2000 (%) - White
Year householder moved into unit - Moved in 1999 to March 2000 (%) - Black or African American
Year householder moved into unit - Moved in 1999 to March 2000 (%) - Asian
Year householder moved into unit - Moved in 1999 to March 2000 (%) - Hispanic or Latino
Year householder moved into unit - Moved in 1999 to March 2000 (%) - American Indian and Alaska Native
Year householder moved into unit - Moved in 1999 to March 2000 (%) - Multirace
Year householder moved into unit - Moved in 1999 to March 2000 (%) - Other Race
Year householder moved into unit - Moved in 1995 to 1998 (%)
Year householder moved into unit - Moved in 1995 to 1998 (%) - White
Year householder moved into unit - Moved in 1995 to 1998 (%) - Black or African American
Year householder moved into unit - Moved in 1995 to 1998 (%) - Asian
Year householder moved into unit - Moved in 1995 to 1998 (%) - Hispanic or Latino
Year householder moved into unit - Moved in 1995 to 1998 (%) - American Indian and Alaska Native
Year householder moved into unit - Moved in 1995 to 1998 (%) - Multirace
Year householder moved into unit - Moved in 1995 to 1998 (%) - Other Race
Year householder moved into unit - Moved in 1990 to 1994 (%)
Year householder moved into unit - Moved in 1990 to 1994 (%) - White
Year householder moved into unit - Moved in 1990 to 1994 (%) - Black or African American
Year householder moved into unit - Moved in 1990 to 1994 (%) - Asian
Year householder moved into unit - Moved in 1990 to 1994 (%) - Hispanic or Latino
Year householder moved into unit - Moved in 1990 to 1994 (%) - American Indian and Alaska Native
Year householder moved into unit - Moved in 1990 to 1994 (%) - Multirace
Year householder moved into unit - Moved in 1990 to 1994 (%) - Other Race
Year householder moved into unit - Moved in 1980 to 1989 (%)
Year householder moved into unit - Moved in 1980 to 1989 (%) - White
Year householder moved into unit - Moved in 1980 to 1989 (%) - Black or African American
Year householder moved into unit - Moved in 1980 to 1989 (%) - Asian
Year householder moved into unit - Moved in 1980 to 1989 (%) - Hispanic or Latino
Year householder moved into unit - Moved in 1980 to 1989 (%) - American Indian and Alaska Native
Year householder moved into unit - Moved in 1980 to 1989 (%) - Multirace
Year householder moved into unit - Moved in 1980 to 1989 (%) - Other Race
Year householder moved into unit - Moved in 1970 to 1979 (%)
Year householder moved into unit - Moved in 1970 to 1979 (%) - White
Year householder moved into unit - Moved in 1970 to 1979 (%) - Black or African American
Year householder moved into unit - Moved in 1970 to 1979 (%) - Asian
Year householder moved into unit - Moved in 1970 to 1979 (%) - Hispanic or Latino
Year householder moved into unit - Moved in 1970 to 1979 (%) - American Indian and Alaska Native
Year householder moved into unit - Moved in 1970 to 1979 (%) - Multirace
Year householder moved into unit - Moved in 1970 to 1979 (%) - Other Race
Year householder moved into unit - Moved in 1969 or earlier (%)
Year householder moved into unit - Moved in 1969 or earlier (%) - White
Year householder moved into unit - Moved in 1969 or earlier (%) - Black or African American
Year householder moved into unit - Moved in 1969 or earlier (%) - Asian
Year householder moved into unit - Moved in 1969 or earlier (%) - Hispanic or Latino
Year householder moved into unit - Moved in 1969 or earlier (%) - American Indian and Alaska Native
Year householder moved into unit - Moved in 1969 or earlier (%) - Multirace
Year householder moved into unit - Moved in 1969 or earlier (%) - Other Race
Housing units lacking complete plumbing facilities (%)
Housing units lacking complete kitchen facilities (%)
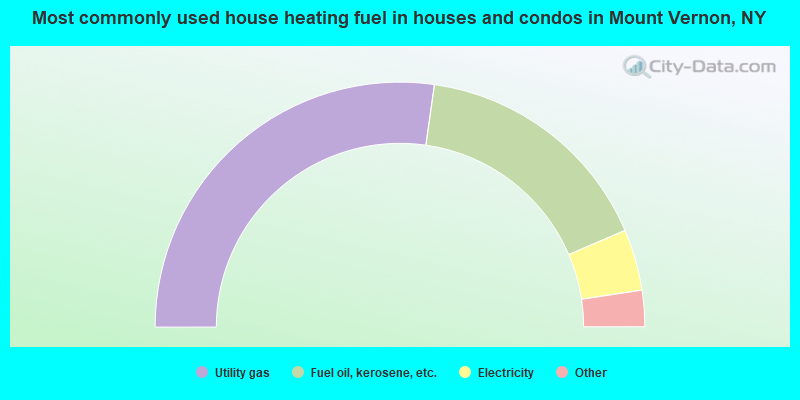
House heating fuel used in houses and condos - Utility gas (%)
House heating fuel used in houses and condos - Bottled, tank, or LP gas (%)
House heating fuel used in houses and condos - Electricity (%)
House heating fuel used in houses and condos - Fuel oil, kerosene, etc. (%)
House heating fuel used in houses and condos - Coal or coke (%)
House heating fuel used in houses and condos - Wood (%)
House heating fuel used in houses and condos - Solar energy (%)
House heating fuel used in houses and condos - Other fuel (%)
House heating fuel used in houses and condos - No fuel used (%)
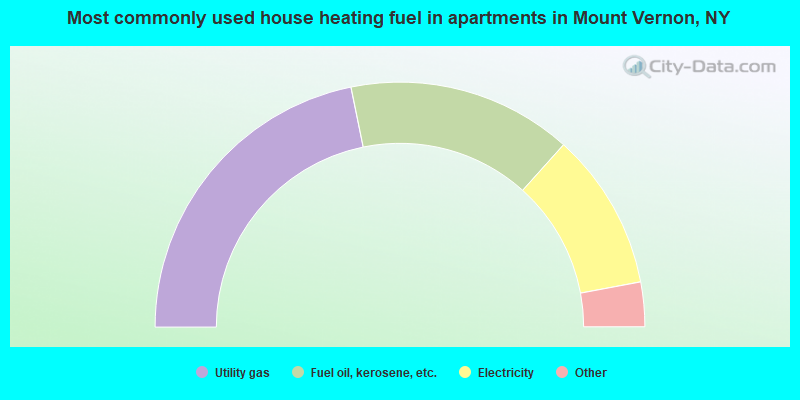
House heating fuel used in apartments - Utility gas (%)
House heating fuel used in apartments - Bottled, tank, or LP gas (%)
House heating fuel used in apartments - Electricity (%)
House heating fuel used in apartments - Fuel oil, kerosene, etc. (%)
House heating fuel used in apartments - Coal or coke (%)
House heating fuel used in apartments - Wood (%)
House heating fuel used in apartments - Solar energy (%)
House heating fuel used in apartments - Other fuel (%)
House heating fuel used in apartments - No fuel used (%)
Median year house/condo built: 1944Median year apartment built: 1960Household type by relationship:
Households: 71,717
Male householders: 13,440 (5,506 living alone ), Female householders: 15,429 (4,597 living alone )8,595 spouses (8,355 opposite-sex spouses ), 1,413 unmarried partners , (1,343 opposite-sex unmarried partners ), 19,946 children (19,664 natural , 0 adopted , 282 stepchildren ), 4,334 grandchildren , 1,735 brothers or sisters , 1,586 parents , 409 foster children , 1,638 other relatives , 2,557 non-relatives In group quarters: 635
Size of family households: 6,661 2-persons , 5,096 3-persons , 3,133 4-persons , 1,027 5-persons , 654 6-persons , 522 7-or-more-persons .
Size of nonfamily households: 10,103 1-person , 1,194 2-persons , 479 3-persons .
5,354 married couples with children. single-parent households (698 men , 3,884 women ).
75.4% of residents of Mount Vernon speak English at home. of residents speak Spanish at home (64% speak English very well , 18% speak English well , 12% speak English not well , 6% don't speak English at all ).of residents speak other Indo-European language at home (56% speak English very well , 28% speak English well , 16% speak English not well ).of residents speak Asian or Pacific Island language at home (46% speak English very well , 33% speak English well , 14% speak English not well , 6% don't speak English at all ).of residents speak other language at home (79% speak English very well , 17% speak English well , 3% speak English not well , 2% don't speak English at all ).
Foreign born population: 25,744 (35.9%)of them are naturalized citizens )
Median number of rooms in houses and condos:
Median number of rooms in apartments
Owner-occupied Renter-occupied
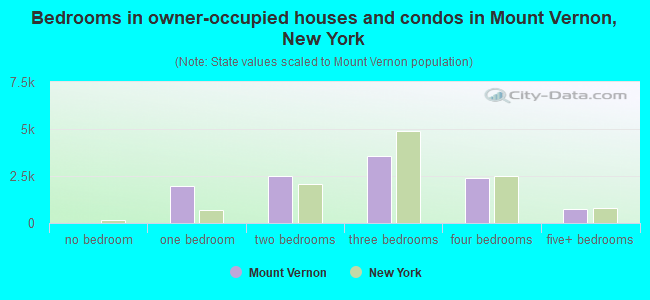
Bedrooms in owner-occupied houses and condos in Mount Vernon, New York
0 no bedroom 1,951 1 bedroom 2,478 2 bedrooms 3,542 3 bedrooms 2,369 4 bedrooms 740 5+ bedrooms
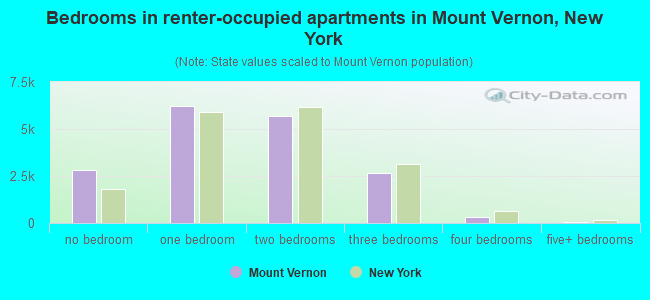
Bedrooms in renter-occupied apartments in Mount Vernon, New York
2,824 no bedroom 6,210 1 bedroom 5,689 2 bedrooms 2,675 3 bedrooms 341 4 bedrooms 50 5+ bedrooms
Owner-occupied Renter-occupied
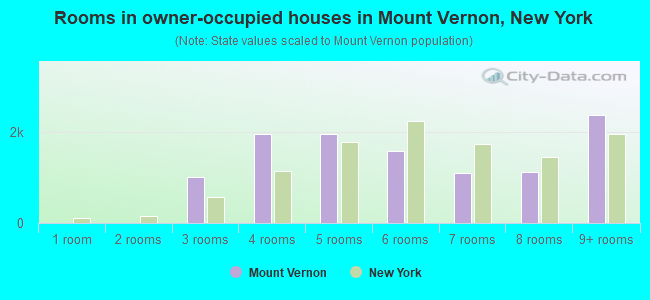
Rooms in owner-occupied houses in Mount Vernon, New York
0 1 room 0 2 rooms 1,010 3 rooms 1,956 4 rooms 1,951 5 rooms 1,583 6 rooms 1,104 7 rooms 1,109 8 rooms 2,367 9+ rooms
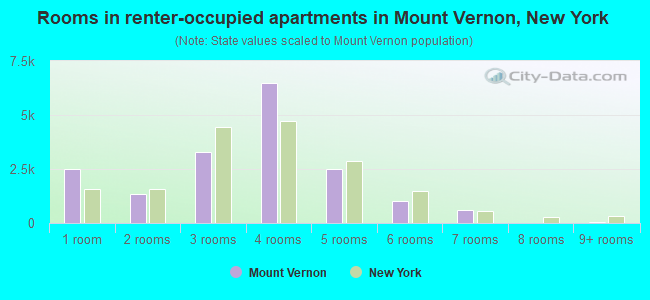
Rooms in renter-occupied apartments in Mount Vernon, New York
2,523 1 room 1,339 2 rooms 3,264 3 rooms 6,475 4 rooms 2,511 5 rooms 1,041 6 rooms 586 7 rooms 0 8 rooms 50 9+ rooms
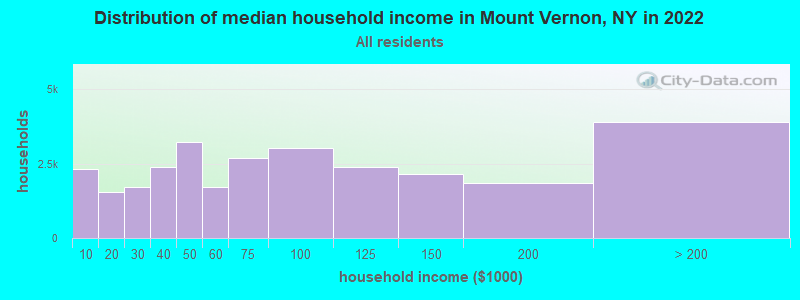
Mount Vernon, NY household income distribution 2,307 Less than $10,0001,529 $10,000 to $19,9991,722 $20,000 to $29,9992,399 $30,000 to $39,9993,221 $40,000 to $49,9991,723 $50,000 to $59,9992,686 $60,000 to $74,9993,018 $75,000 to $99,9992,370 $100,000 to $124,9992,164 $125,000 to $149,9991,835 $150,000 to $199,9993,895 $200,000 or more
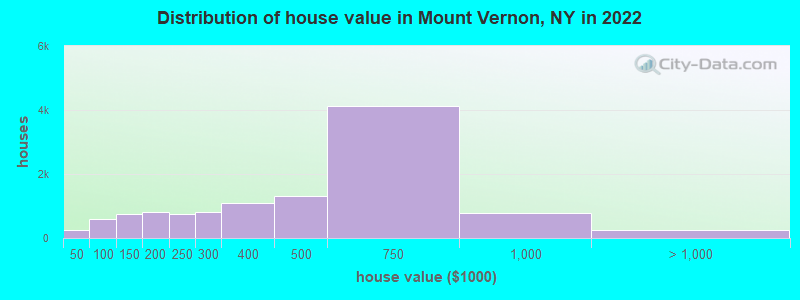
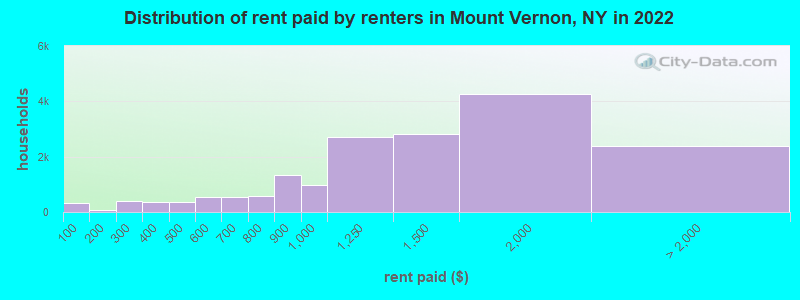
Home value of owner - occupied houses in 2022 in Mount Vernon, NY 151 Less than $10,00012 $20,000 to $24,99992 $40,000 to $49,99935 $50,000 to $59,99922 $60,000 to $69,99962 $70,000 to $79,999211 $80,000 to $89,999178 $90,000 to $99,999218 $100,000 to $124,999537 $125,000 to $149,999510 $150,000 to $174,999316 $175,000 to $199,999749 $200,000 to $249,999818 $250,000 to $299,9991,101 $300,000 to $399,9991,304 $400,000 to $499,9994,132 $500,000 to $749,999775 $750,000 to $999,999135 $1,000,000 to $1,499,99933 $1,500,000 to $1,999,99989 $2,000,000 or moreRent paid by renters in 2022 in Mount Vernon, NY 327 Less than $10013 $100 to $14951 $150 to $199276 $200 to $249127 $250 to $299156 $300 to $349222 $350 to $399256 $400 to $449119 $450 to $499431 $500 to $549122 $550 to $599230 $600 to $649309 $650 to $699303 $700 to $749266 $750 to $7991,336 $800 to $899992 $900 to $9992,708 $1,000 to $1,2492,821 $1,250 to $1,4994,246 $1,500 to $1,9991,522 $2,000 to $2,499187 $2,500 to $2,999150 $3,000 to $3,49981 $3,500 or more449 No cash rent
Percentage of workers working in this county: 61.5%Number of people working at home: 3,310 (8.8% of all workers )
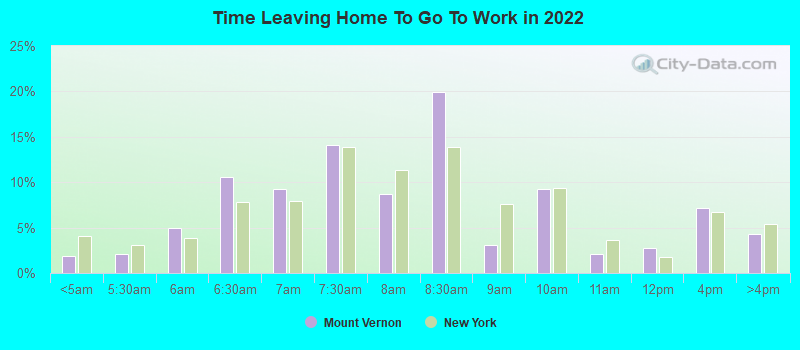
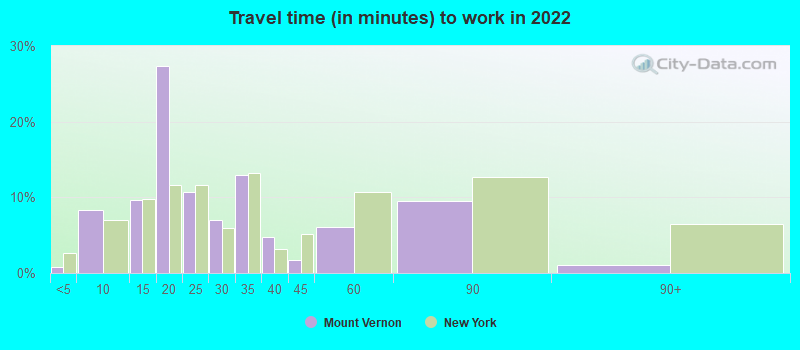
Travel time to work (commute)
Less than 5 minutes: 175 to 9 minutes: 2,46210 to 14 minutes: 2,18615 to 19 minutes: 5,20020 to 24 minutes: 3,90225 to 29 minutes: 2,75630 to 34 minutes: 5,51935 to 39 minutes: 43540 to 44 minutes: 2,43345 to 59 minutes: 3,94260 to 89 minutes: 4,85790 or more minutes: 774
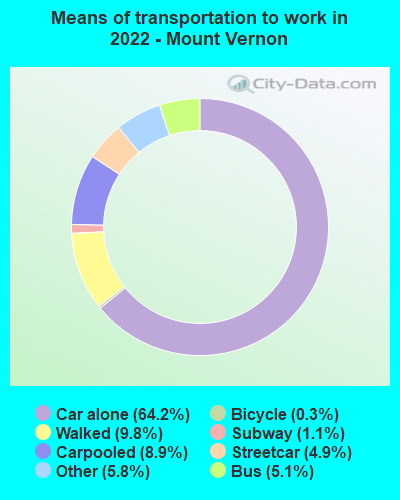
Means of transportation to work:
Drove a car alone: 14,796 (56.1%)Carpooled: 2,048 (7.8%)Bus : 1,178 (4.5%)Subway or elevated rail : 1,124 (4.3%)Long-distance train or commuter rail : 245 (0.9%)Taxi: 1,348 (5.1%)Bicycle: 62 (0.2%)Walked: 2,263 (8.6%)Worked at home: 3,310 (12.6%)
Unemployment by race in 2022
Unemployment rate for Black residents 13.0% Males6.9% FemalesUnemployment rate for Asian residents 1.8% Males5.3% FemalesUnemployment rate for other race residents 4.2% Males6.4% FemalesUnemployment rate for two or more race residents 2.9% Males14.5% FemalesUnemployment rate for Hispanic or Latino residents 7.1% Males8.7% Females
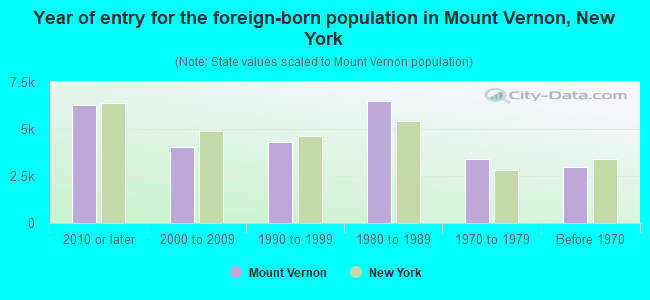
Year of entry for the foreign-born population in Mount Vernon, New York
6,292 2010 or later 4,064 2000 to 2009 4,298 1990 to 1999 6,479 1980 to 1989 3,408 1970 to 1979 2,977 Before 1970
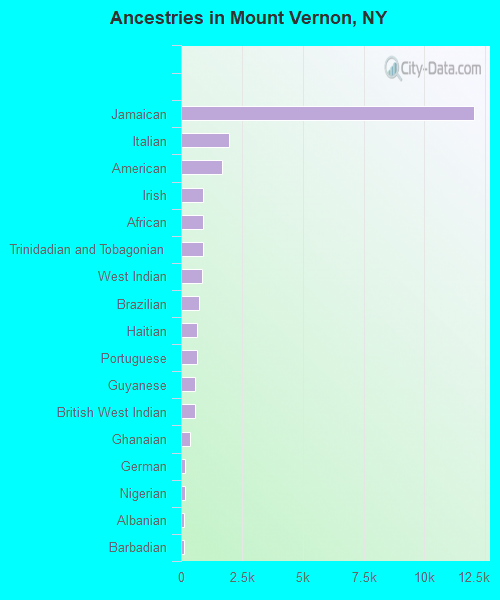
First ancestries reported:
Jamaican: 12,052 (25.5%)
Italian: 1,961 (4.1%)
American: 1,692 (3.6%)
Irish: 923 (1.9%)
African: 916 (1.9%)
Trinidadian and Tobagonian: 907 (1.9%)
West Indian: 869 (1.8%)
Brazilian: 733 (1.5%)
Haitian: 671 (1.4%)
Portuguese: 653 (1.4%)
Guyanese: 570 (1.2%)
British West Indian: 564 (1.2%)
Ghanaian: 380 (0.8%)
German: 172 (0.4%)
Nigerian: 145 (0.3%)
Albanian: 129 (0.3%)
Barbadian: 111 (0.2%)
European: 109 (0.2%)
Sierra Leonean: 105 (0.2%)
Russian: 93 (0.2%)
Polish: 88 (0.2%)
Greek: 73 (0.2%)
Eastern European: 72 (0.2%)
British: 56 (0.1%)
Afghan: 31 (0.07%)
English: 29 (0.06%)
Belizean: 29 (0.06%)
Northern European: 28 (0.06%)
Turkish: 28 (0.06%)
Israeli: 26 (0.05%)
Scotch-Irish: 24 (0.05%)
Ukrainian: 23 (0.05%)
French Canadian: 19 (0.04%)
Romanian: 15 (0.03%)
Maltese: 14 (0.03%)
Finnish: 11 (0.02%)
Norwegian: 10 (0.02%)
Moroccan: 7 (0.01%)
Arab: 6 (0.01%)
Scottish: 6 (0.01%)
French: 6 (0.01%)
Estonian: 6 (0.01%)
Swedish: 5 (0.01%) Most common places of birth for foreign-born residents (%): Jamaica Mount Vernon:
45.5% (10,634)New York:
5.0% (227,557)
Dominican Republic Mount Vernon:
7.1% (1,656)New York:
11.1% (501,040)
Brazil Mount Vernon:
6.2% (1,439)New York:
0.7% (30,658)
Mexico Mount Vernon:
2.7% (640)New York:
4.8% (214,559)
Ghana Mount Vernon:
2.7% (631)New York:
0.9% (39,058)
Trinidad and Tobago Mount Vernon:
2.6% (610)New York:
2.0% (91,428)
Guyana Mount Vernon:
2.6% (610)New York:
3.8% (172,129)
Other Caribbean Mount Vernon:
2.5% (583)New York:
0.4% (18,080)
Portugal Mount Vernon:
2.4% (557)New York:
0.2% (10,519)
Haiti Mount Vernon:
2.3% (529)New York:
2.8% (126,936)
Ecuador Mount Vernon:
2.1% (492)New York:
3.9% (177,448)
Place of birth for U.S.-born residents:
This state: 39,091Other state: 5,416Northeast: 1,607Midwest: 928South: 2,755West: 126 91.3% of Mount Vernon residents lived in the same house 1 years ago.
Out of people who lived in different houses, 36.5% lived in this county.
Out of people who lived in different counties, 81.0% lived in New York.
Mount Vernon:
91.3%State average:
89.6%
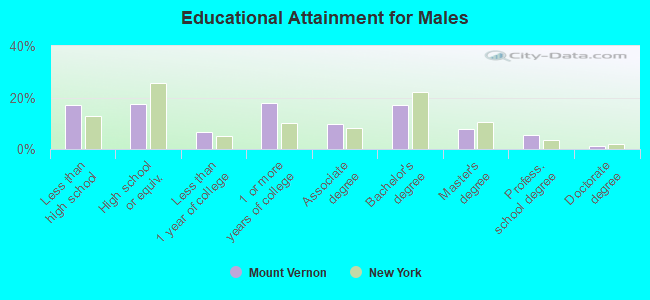
Education attainment for males 25 years and older:
No schooling: 1,188Nursery to 4th grade: 05th and 6th grade: 07th and 8th grade: 1139th grade: 53810th grade: 51811th grade: 48912th grade, no diploma: 1,211High school graduate (or equivalency): 4,178Less than 1 year of college: 1,616Some college more than 1 year, no degree: 4,267Associate degree: 2,296Bachelor's degree: 4,117Master's degree: 1,839Professional school degree: 1,325Doctorate degree: 314
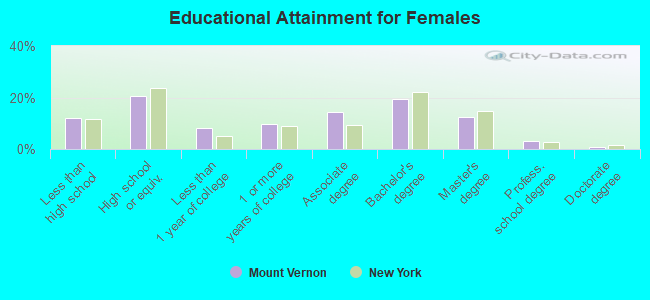
Education attainment for females 25 years and older:
No schooling: 981Nursery to 4th grade: 3365th and 6th grade: 887th and 8th grade: 2599th grade: 27210th grade: 72411th grade: 10012th grade, no diploma: 772High school graduate (or equivalency): 5,959Less than 1 year of college: 2,315Some college more than 1 year, no degree: 2,817Associate degree: 4,155Bachelor's degree: 5,591Master's degree: 3,593Professional school degree: 850Doctorate degree: 246
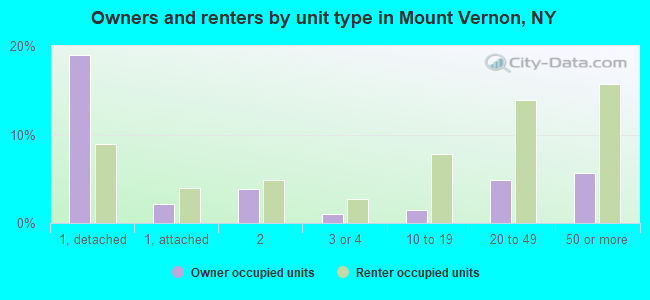
Housing units in structures:
One, detached: 8,810One, attached: 1,748Two: 2,5813 or 4: 1,1665 to 9: 1,32410 to 19: 2,82520 to 49: 5,86650 or more: 6,322Housing units lacking complete plumbing facilities in 2022: 0.3%Housing units lacking complete kitchen facilities in 2022: 2.2%House/condo owner moved in on average 18 years ago
Renter moved in on average 5 years ago
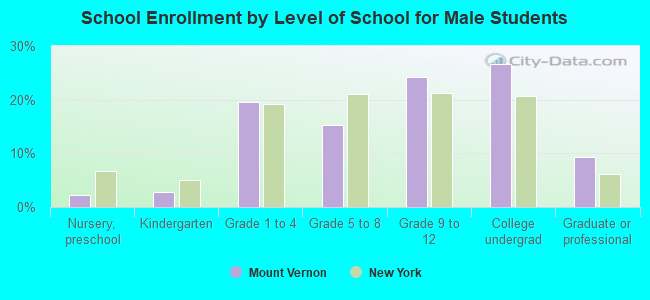
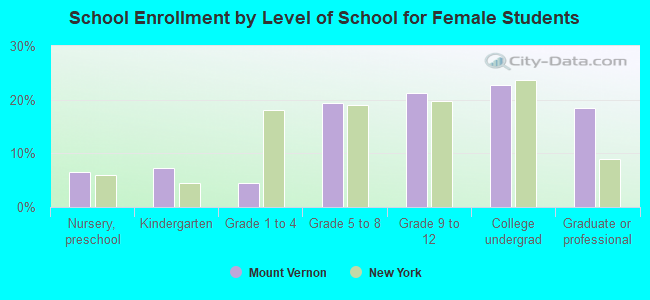
Private vs. public school enrollment:
Students in private schools in grades 1 to 8 (elementary and middle school): 1,436 Students in private schools in grades 9 to 12 (high school): 351 Students in private undergraduate colleges: 924