Mountlake Terrace, WA (Washington) Houses and Residents
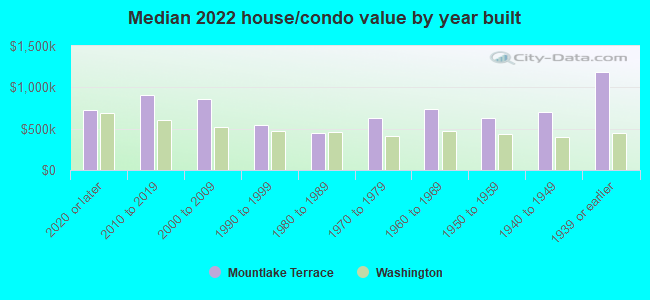
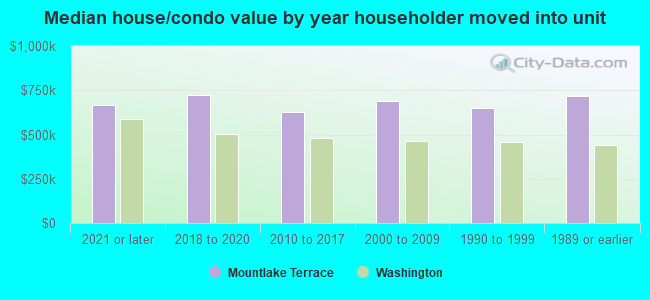
Estimated median house or condo value in 2022: $675,062 (it was $166,300 in 2000 )
Mountlake Terrace:
$675,062Washington:
$569,500
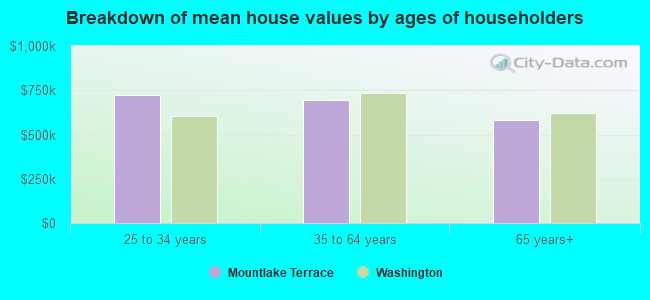
Lower value quartile - upper value quartile: $526,123 - $845,096Mean price in 2022: Detached houses: $733,166 Here:
$733,166State:
$734,307
Townhouses or other attached units: $567,459 Here:
$567,459State:
$657,697
In 2-unit structures: $567,547 Here:
$567,547State:
$534,634
In 3-to-4-unit structures: $426,032 Here:
$426,032State:
$510,239
In 5-or-more-unit structures: $383,002 Here:
$383,002State:
$503,183
Mobile homes: $102,373 Here:
$102,373State:
$218,362
Total population: 20,817 (Urban population: 20,300, Rural population: 0)
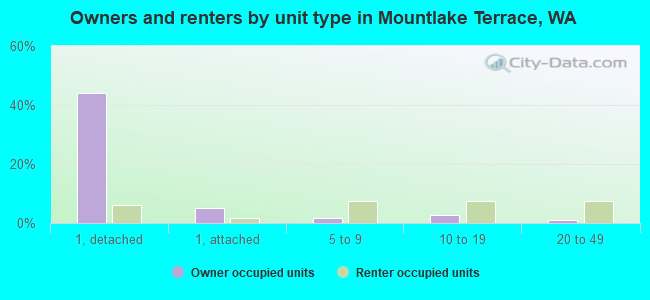
Houses: 9,610 (9,223 occupied: 5,324 owner occupied, 3,822 renter occupied )
% of renters here:
42%State:
36%
Housing density: 2,377 houses/condos per square mile
Median price asked for vacant for-sale houses and condos in 2022: $598,732.
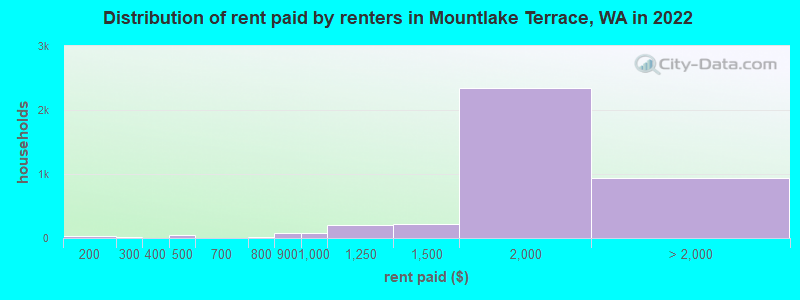
Median contract rent in 2022: $1,801 (lower quartile is $1,602, upper quartile is over $2,000)
Median rent asked for vacant for-rent units in 2022: $27,622
Median gross rent in Mountlake Terrace, WA in 2022: $1,851
Housing units in Mountlake Terrace with a mortgage: 3,724 (411 second mortgage, 0 home equity loan, 359 both second mortgage and home equity loan )Houses without a mortgage: 31
Median household income for houses/condos with a mortgage: $128,027
Median household income for apartments without a mortgage: $77,579
Median monthly housing costs: $1,828
Data:
Median house or condo value ($)
Median house or condo value ($ change since 2000)
Median house or condo value ($) - White
Median house or condo value ($) - Black or African American
Median house or condo value ($) - Asian
Median house or condo value ($) - Hispanic or Latino
Median house or condo value ($) - American Indian and Alaska Native
Median house or condo value ($) - Multirace
Median house or condo value ($) - Other Race
Median price asked for mobile homes ($)
Household density (households per square mile)
Mean house or condo value by units in structure - 1, detached ($)
Mean house or condo value by units in structure - 1, attached ($)
Mean house or condo value by units in structure - 2 ($)
Mean house or condo value by units in structure by units in structure - 3 or 4 ($)
Mean house or condo value by units in structure - 5 or more ($)
Mean house or condo value by units in structure - Boat, RV, van, etc. ($)
Mean house or condo value by units in structure - Mobile home ($)
Median contract rent ($)
Median contract rent - Lower quartile ($)
Median contract rent - Upper quartile ($)
Median gross rent ($)
Urban houses (%)
Rural houses (%)
Houses occupied (%)
Houses occupied (% change since 2000)
Houses owner occupied (%)
Houses owner occupied (% change since 2000)
Houses renter occupied (%)
Houses renter occupied (% change since 2000)
Vacant housing units - For rent (%)
Vacant housing units - For rent (% change since 2000)
Vacant housing units - For sale only (%)
Vacant housing units - For sale only (% change since 2000)
Vacant housing units - Rented or sold, not occupied (%)
Vacant housing units - Rented or sold, not occupied (% change since 2000)
Vacant housing units - For seasonal, recreational, or occasional use (%)
Vacant housing units - For seasonal, recreational, or occasional use (% change since 2000)
Vacant housing units - For migrant workers (%)
Vacant housing units - For migrant workers (% change since 2000)
Vacant housing units - Other vacant (%)
Vacant housing units - Other vacant (% change since 2000)
Median monthly housing costs ($)
Median household income for houses/condos with a mortgage ($)
Median household income for houses/condos without a mortgage ($)
Median household income ($)
Median household income ($) - White
Median household income ($) - Black or African American
Median household income ($) - Asian
Median household income ($) - Hispanic or Latino
Median household income ($) - American Indian and Alaska Native
Median household income ($) - Multirace
Median household income ($) - Other Race
Mortgage status - with mortgage (%)
Mortgage status - with second mortgage (%)
Mortgage status - with home equity loan (%)
Mortgage status - with both second mortgage and home equity loan (%)
Mortgage status - without a mortgage (%)
Median year house/condo built
Median year apartment built
Household type by relationship - Male householder living alone (%)
Household type by relationship - Male householder not living alone (%)
Household type by relationship - Female householder living alone (%)
Household type by relationship - Female householder not living alone (%)
Household type by relationship - Opposite-Sex spouse (%)
Household type by relationship - Same-Sex spouse (%)
Household type by relationship - Opposite-Sex unmarried partner (%)
Household type by relationship - Same-Sex unmarried partner (%)
Household type by relationship - In group quarters (%)
Size of family households - 2-person household (%)
Size of family households - 3-person household (%)
Size of family households - 4-person household (%)
Size of family households - 5-person household (%)
Size of family households - 6-person household (%)
Size of family households - 7-or-more-person household (%)
Size of nonfamily households - 1-person household (%)
Size of nonfamily households - 2-person household (%)
Size of nonfamily households - 3-person household (%)
Size of nonfamily households - 4-person household (%)
Size of nonfamily households - 5-person household (%)
Size of nonfamily households - 6-person household (%)
Size of nonfamily households - 7-or-moreperson household (%)
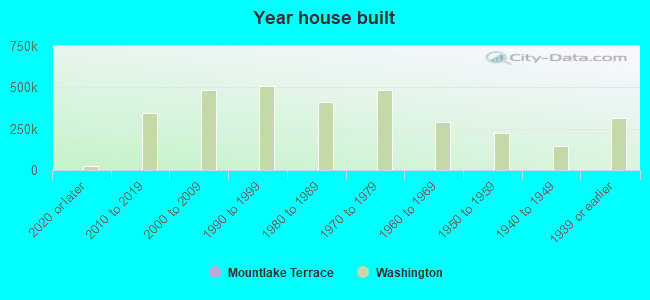
Year house built - Built 2010 or later (%)
Year house built - Built 2000 to 2009 (%)
Year house built - Built 1990 to 1999 (%)
Year house built - Built 1980 to 1989 (%)
Year house built - Built 1970 to 1979 (%)
Year house built - Built 1960 to 1969 (%)
Year house built - Built 1950 to 1959 (%)
Year house built - Built 1940 to 1949 (%)
Year house built - Built 1939 or earlier (%)
Median number of rooms in houses and condos
Median number of rooms in apartments
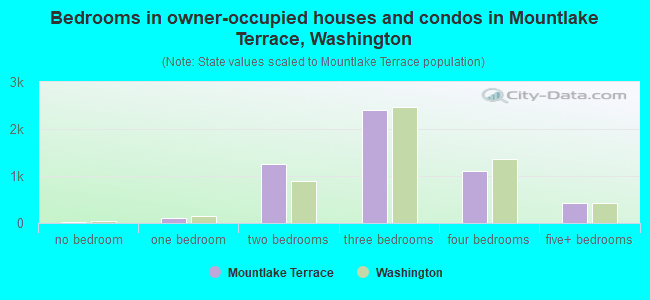
Median number of bedrooms in owner occupied houses
Mean number of bedrooms in owner occupied houses
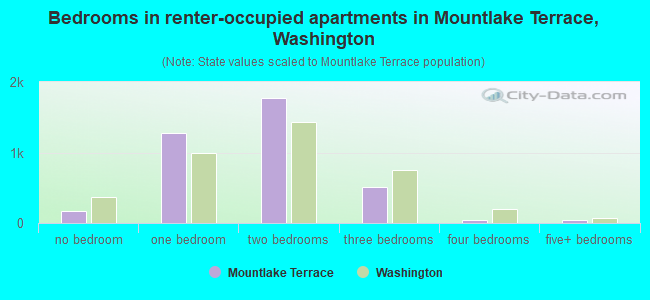
Median number of bedrooms in renter occupied houses
Mean number of bedrooms in renter occupied houses
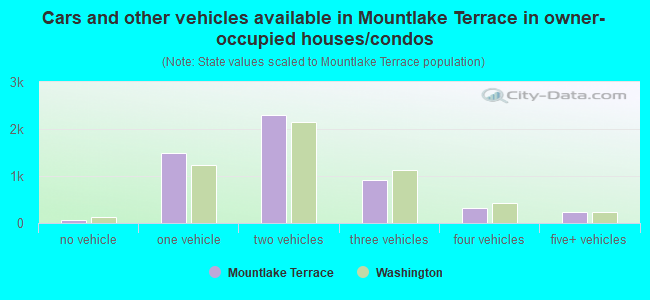
Median number of vehichles in owner occupied houses
Mean number of vehichles in owner occupied houses
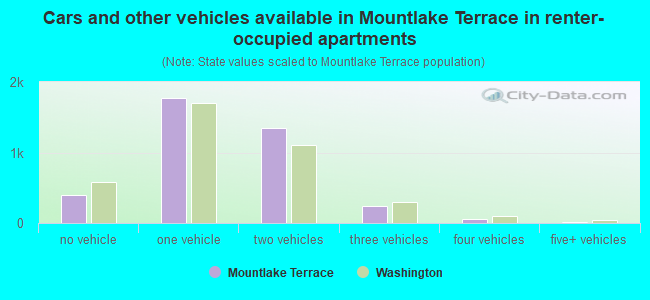
Median number of vehichles in renter occupied houses
Mean number of vehichles in renter occupied houses
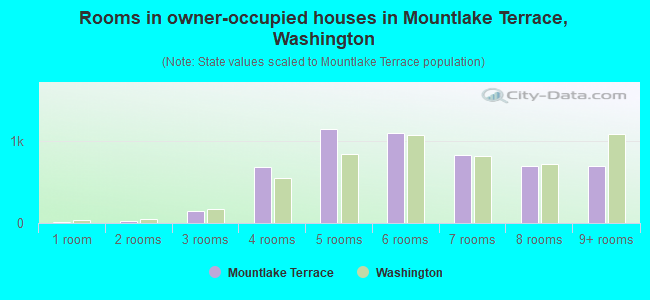
Rooms in owner-occupied houses - 1 room (%)
Rooms in owner-occupied houses - 2 rooms (%)
Rooms in owner-occupied houses - 3 rooms (%)
Rooms in owner-occupied houses - 4 rooms (%)
Rooms in owner-occupied houses - 5 rooms (%)
Rooms in owner-occupied houses - 6 rooms (%)
Rooms in owner-occupied houses - 7 rooms (%)
Rooms in owner-occupied houses - 8 rooms (%)
Rooms in owner-occupied houses - 9+ rooms (%)
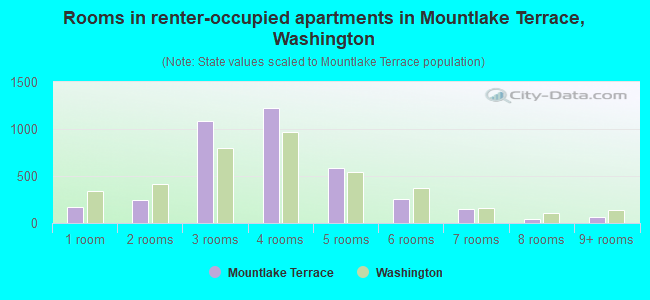
Rooms in renter-occupied houses - 1 room (%)
Rooms in renter-occupied houses - 2 rooms (%)
Rooms in renter-occupied houses - 3 rooms (%)
Rooms in renter-occupied houses - 4 rooms (%)
Rooms in renter-occupied houses - 5 rooms (%)
Rooms in renter-occupied houses - 6 rooms (%)
Rooms in renter-occupied houses - 7 rooms (%)
Rooms in renter-occupied houses - 8 rooms (%)
Rooms in renter-occupied houses - 9+ rooms (%)
Bedrooms in owner-occupied houses - no bedrooms (%)
Bedrooms in owner-occupied houses - 1 bedroom (%)
Bedrooms in owner-occupied houses - 2 bedrooms (%)
Bedrooms in owner-occupied houses - 3 bedrooms (%)
Bedrooms in owner-occupied houses - 4 bedrooms (%)
Bedrooms in owner-occupied houses - 5+ bedrooms (%)
Bedrooms in renter-occupied houses - no bedrooms (%)
Bedrooms in renter-occupied houses - 1 bedroom (%)
Bedrooms in renter-occupied houses - 2 bedrooms (%)
Bedrooms in renter-occupied houses - 3 bedrooms (%)
Bedrooms in renter-occupied houses - 4 bedrooms (%)
Bedrooms in renter-occupied houses - 5+ bedrooms (%)
Vehicles available in owner-occupied houses - no vehicle available (%)
Vehicles available in owner-occupied houses - 1 vehicle available(%)
Vehicles available in owner-occupied houses - 2 Vehicles available (%)
Vehicles available in owner-occupied houses - 3 Vehicles available (%)
Vehicles available in owner-occupied houses - 4 Vehicles available (%)
Vehicles available in owner-occupied houses - 5+ Vehicles available (%)
Vehicles available in renter-occupied houses - no vehicle available (%)
Vehicles available in renter-occupied houses - 1 vehicle available (%)
Vehicles available in renter-occupied houses - 2 Vehicles available (%)
Vehicles available in renter-occupied houses - 3 Vehicles available (%)
Vehicles available in renter-occupied houses - 4 Vehicles available (%)
Vehicles available in renter-occupied houses - 5+ Vehicles available (%)
Housing units in structures - 1, detached (%)
Housing units in structures - 1, attached (%)
Housing units in structures - 2 (%)
Housing units in structures - 3 or 4 (%)
Housing units in structures - 5 to 9 (%)
Housing units in structures - 10 to 19 (%)
Housing units in structures - 20 to 49 (%)
Housing units in structures - 50 or more (%)
Housing units in structures - Mobile home (%)
Housing units in structures - Boat, RV, van, etc. (%)
Housing units in structures - Owners - 1, detached (%)
Housing units in structures - Owners - 1, attached (%)
Housing units in structures - Owners - 2 (%)
Housing units in structures - Owners - 3 or 4 (%)
Housing units in structures - Owners - 5 to 9 (%)
Housing units in structures - Owners - 10 to 19 (%)
Housing units in structures - Owners - 20 to 49 (%)
Housing units in structures - Owners - 50 or more (%)
Housing units in structures - Owners - Mobile home (%)
Housing units in structures - Owners - Boat, RV, van, etc. (%)
Housing units in structures - Renters - 1, detached (%)
Housing units in structures - Renters - 1, attached (%)
Housing units in structures - Renters - 2 (%)
Housing units in structures - Renters - 3 or 4 (%)
Housing units in structures - Renters - 5 to 9 (%)
Housing units in structures - Renters - 10 to 19 (%)
Housing units in structures - Renters - 20 to 49 (%)
Housing units in structures - Renters - 50 or more (%)
Housing units in structures - Renters - Mobile home (%)
Housing units in structures - Renters - Boat, RV, van, etc. (%)
House/condo owner moved in on average (years ago)
Renter moved in on average (years ago)
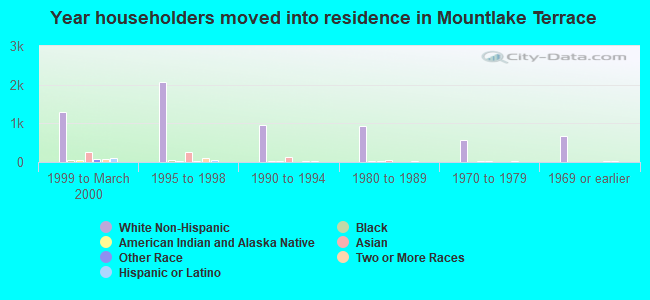
Year householder moved into unit - Moved in 1999 to March 2000 (%)
Year householder moved into unit - Moved in 1999 to March 2000 (%) - White
Year householder moved into unit - Moved in 1999 to March 2000 (%) - Black or African American
Year householder moved into unit - Moved in 1999 to March 2000 (%) - Asian
Year householder moved into unit - Moved in 1999 to March 2000 (%) - Hispanic or Latino
Year householder moved into unit - Moved in 1999 to March 2000 (%) - American Indian and Alaska Native
Year householder moved into unit - Moved in 1999 to March 2000 (%) - Multirace
Year householder moved into unit - Moved in 1999 to March 2000 (%) - Other Race
Year householder moved into unit - Moved in 1995 to 1998 (%)
Year householder moved into unit - Moved in 1995 to 1998 (%) - White
Year householder moved into unit - Moved in 1995 to 1998 (%) - Black or African American
Year householder moved into unit - Moved in 1995 to 1998 (%) - Asian
Year householder moved into unit - Moved in 1995 to 1998 (%) - Hispanic or Latino
Year householder moved into unit - Moved in 1995 to 1998 (%) - American Indian and Alaska Native
Year householder moved into unit - Moved in 1995 to 1998 (%) - Multirace
Year householder moved into unit - Moved in 1995 to 1998 (%) - Other Race
Year householder moved into unit - Moved in 1990 to 1994 (%)
Year householder moved into unit - Moved in 1990 to 1994 (%) - White
Year householder moved into unit - Moved in 1990 to 1994 (%) - Black or African American
Year householder moved into unit - Moved in 1990 to 1994 (%) - Asian
Year householder moved into unit - Moved in 1990 to 1994 (%) - Hispanic or Latino
Year householder moved into unit - Moved in 1990 to 1994 (%) - American Indian and Alaska Native
Year householder moved into unit - Moved in 1990 to 1994 (%) - Multirace
Year householder moved into unit - Moved in 1990 to 1994 (%) - Other Race
Year householder moved into unit - Moved in 1980 to 1989 (%)
Year householder moved into unit - Moved in 1980 to 1989 (%) - White
Year householder moved into unit - Moved in 1980 to 1989 (%) - Black or African American
Year householder moved into unit - Moved in 1980 to 1989 (%) - Asian
Year householder moved into unit - Moved in 1980 to 1989 (%) - Hispanic or Latino
Year householder moved into unit - Moved in 1980 to 1989 (%) - American Indian and Alaska Native
Year householder moved into unit - Moved in 1980 to 1989 (%) - Multirace
Year householder moved into unit - Moved in 1980 to 1989 (%) - Other Race
Year householder moved into unit - Moved in 1970 to 1979 (%)
Year householder moved into unit - Moved in 1970 to 1979 (%) - White
Year householder moved into unit - Moved in 1970 to 1979 (%) - Black or African American
Year householder moved into unit - Moved in 1970 to 1979 (%) - Asian
Year householder moved into unit - Moved in 1970 to 1979 (%) - Hispanic or Latino
Year householder moved into unit - Moved in 1970 to 1979 (%) - American Indian and Alaska Native
Year householder moved into unit - Moved in 1970 to 1979 (%) - Multirace
Year householder moved into unit - Moved in 1970 to 1979 (%) - Other Race
Year householder moved into unit - Moved in 1969 or earlier (%)
Year householder moved into unit - Moved in 1969 or earlier (%) - White
Year householder moved into unit - Moved in 1969 or earlier (%) - Black or African American
Year householder moved into unit - Moved in 1969 or earlier (%) - Asian
Year householder moved into unit - Moved in 1969 or earlier (%) - Hispanic or Latino
Year householder moved into unit - Moved in 1969 or earlier (%) - American Indian and Alaska Native
Year householder moved into unit - Moved in 1969 or earlier (%) - Multirace
Year householder moved into unit - Moved in 1969 or earlier (%) - Other Race
Housing units lacking complete plumbing facilities (%)
Housing units lacking complete kitchen facilities (%)
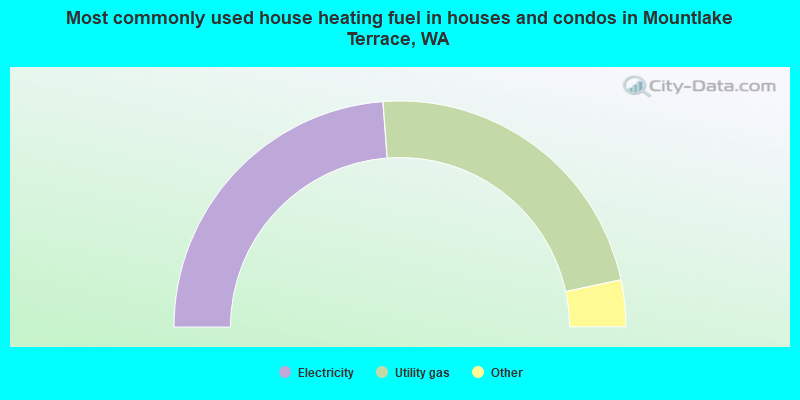
House heating fuel used in houses and condos - Utility gas (%)
House heating fuel used in houses and condos - Bottled, tank, or LP gas (%)
House heating fuel used in houses and condos - Electricity (%)
House heating fuel used in houses and condos - Fuel oil, kerosene, etc. (%)
House heating fuel used in houses and condos - Coal or coke (%)
House heating fuel used in houses and condos - Wood (%)
House heating fuel used in houses and condos - Solar energy (%)
House heating fuel used in houses and condos - Other fuel (%)
House heating fuel used in houses and condos - No fuel used (%)
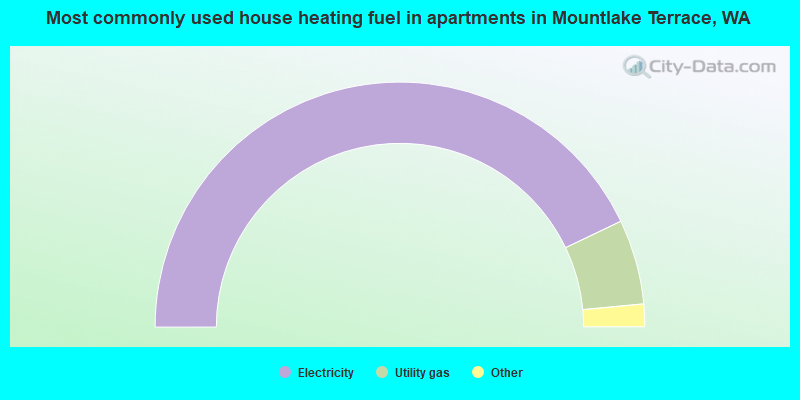
House heating fuel used in apartments - Utility gas (%)
House heating fuel used in apartments - Bottled, tank, or LP gas (%)
House heating fuel used in apartments - Electricity (%)
House heating fuel used in apartments - Fuel oil, kerosene, etc. (%)
House heating fuel used in apartments - Coal or coke (%)
House heating fuel used in apartments - Wood (%)
House heating fuel used in apartments - Solar energy (%)
House heating fuel used in apartments - Other fuel (%)
House heating fuel used in apartments - No fuel used (%)
Median year house/condo built: 1965Median year apartment built: 1980Household type by relationship:
Households: 21,652
Male householders: 4,414 (1,038 living alone ), Female householders: 4,648 (1,570 living alone )3,965 spouses (3,919 opposite-sex spouses ), 688 unmarried partners , (571 opposite-sex unmarried partners ), 5,131 children (4,828 natural , 52 adopted , 250 stepchildren ), 186 grandchildren , 445 brothers or sisters , 361 parents , 8 foster children , 477 other relatives , 1,117 non-relatives In group quarters: 206
Size of family households: 2,728 2-persons , 1,246 3-persons , 912 4-persons , 407 5-persons , 112 6-persons , 61 7-or-more-persons .
Size of nonfamily households: 2,780 1-person , 861 2-persons , 67 3-persons , 11 4-persons , 9 5-persons , 24 6-persons .
2,529 married couples with children. single-parent households (317 men , 782 women ).
76.9% of residents of Mountlake Terrace speak English at home. of residents speak Spanish at home (64% speak English very well , 20% speak English well , 12% speak English not well , 4% don't speak English at all ).of residents speak other Indo-European language at home (63% speak English very well , 27% speak English well , 8% speak English not well , 2% don't speak English at all ).of residents speak Asian or Pacific Island language at home (64% speak English very well , 21% speak English well , 10% speak English not well , 5% don't speak English at all ).of residents speak other language at home (74% speak English very well , 6% speak English well , 20% speak English not well ).
Foreign born population: 4,081 (18.8%)of them are naturalized citizens )
Median number of rooms in houses and condos:
Median number of rooms in apartments
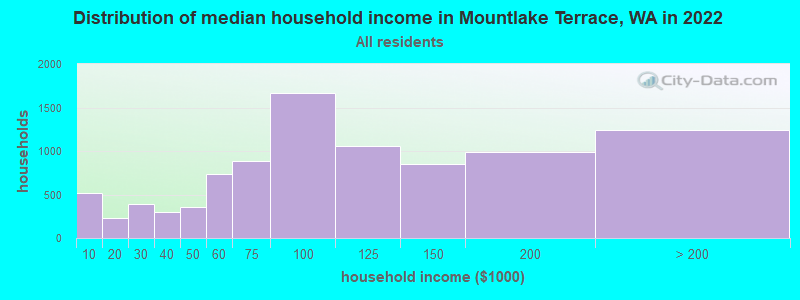
Mountlake Terrace, WA household income distribution 520 Less than $10,000225 $10,000 to $19,999387 $20,000 to $29,999296 $30,000 to $39,999355 $40,000 to $49,999738 $50,000 to $59,999885 $60,000 to $74,9991,672 $75,000 to $99,9991,052 $100,000 to $124,999853 $125,000 to $149,999989 $150,000 to $199,9991,239 $200,000 or more
Home value of owner - occupied houses in 2022 in Mountlake Terrace, WA 26 $15,000 to $19,9997 $20,000 to $24,99912 $25,000 to $29,9995 $30,000 to $34,99911 $35,000 to $39,99920 $40,000 to $49,99928 $50,000 to $59,9994 $60,000 to $69,9997 $90,000 to $99,9990 $125,000 to $149,99940 $150,000 to $174,9995 $175,000 to $199,99970 $200,000 to $249,99979 $250,000 to $299,999253 $300,000 to $399,999593 $400,000 to $499,9992,101 $500,000 to $749,9991,038 $750,000 to $999,999327 $1,000,000 to $1,499,999Rent paid by renters in 2022 in Mountlake Terrace, WA 34 $100 to $14915 $250 to $29939 $400 to $4497 $700 to $74976 $800 to $89982 $900 to $999207 $1,000 to $1,249222 $1,250 to $1,4992,348 $1,500 to $1,999556 $2,000 to $2,499140 $2,500 to $2,99969 $3,000 to $3,499120 $3,500 or more47 No cash rent
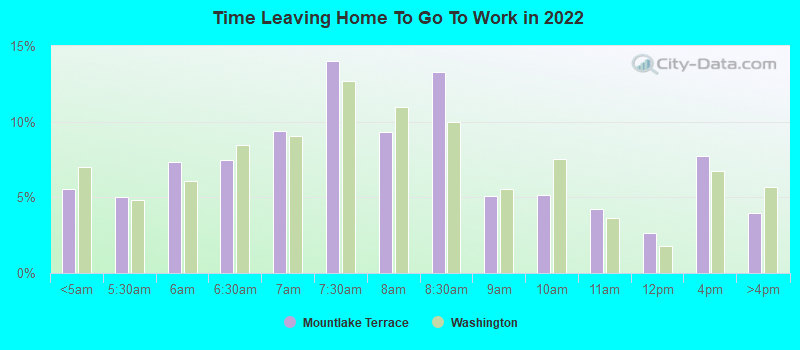
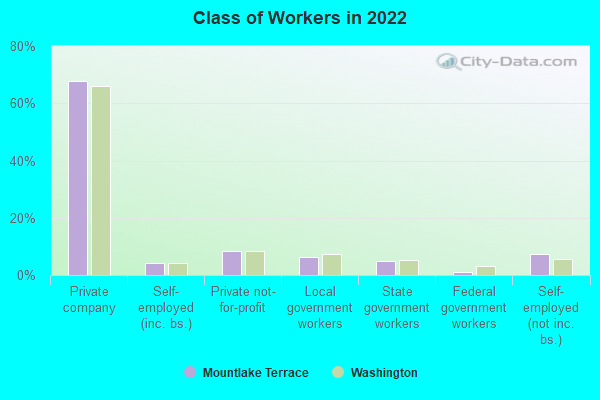
Percentage of workers working in this county: 50.9%Number of people working at home: 3,065 (25.9% of all workers )
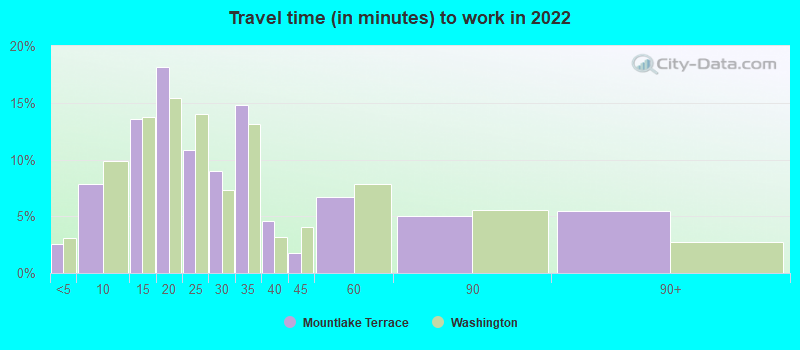
Travel time to work (commute)
Less than 5 minutes: 1435 to 9 minutes: 56710 to 14 minutes: 69415 to 19 minutes: 96020 to 24 minutes: 1,54225 to 29 minutes: 70230 to 34 minutes: 1,40435 to 39 minutes: 49640 to 44 minutes: 45845 to 59 minutes: 89760 to 89 minutes: 90190 or more minutes: 123
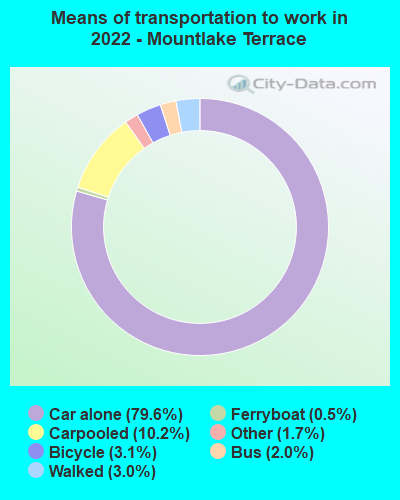
Means of transportation to work:
Drove a car alone: 4,568 (52.6%)Carpooled: 623 (7.2%)Bus : 157 (1.8%)Ferryboat: 39 (0.4%)Taxi: 112 (1.3%)Bicycle: 104 (1.2%)Walked: 206 (2.4%)Worked at home: 3,065 (35.3%)
Unemployment by race in 2022
Unemployment rate for White non-Hispanic residents 3.1% Males3.3% FemalesUnemployment rate for Black residents 16.3% FemalesUnemployment rate for Asian residents 2.3% Males8.1% FemalesUnemployment rate for two or more race residents 4.2% Males4.1% FemalesUnemployment rate for Hispanic or Latino residents 6.0% Males
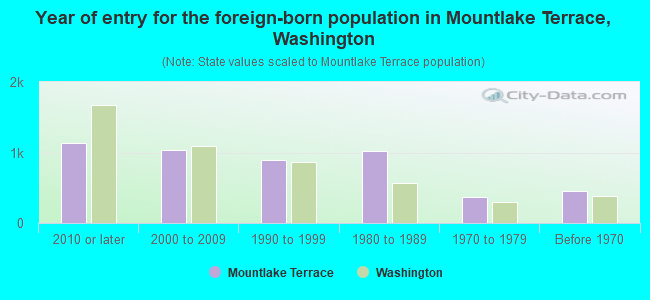
Year of entry for the foreign-born population in Mountlake Terrace, Washington
1,130 2010 or later 1,031 2000 to 2009 891 1990 to 1999 1,020 1980 to 1989 362 1970 to 1979 454 Before 1970
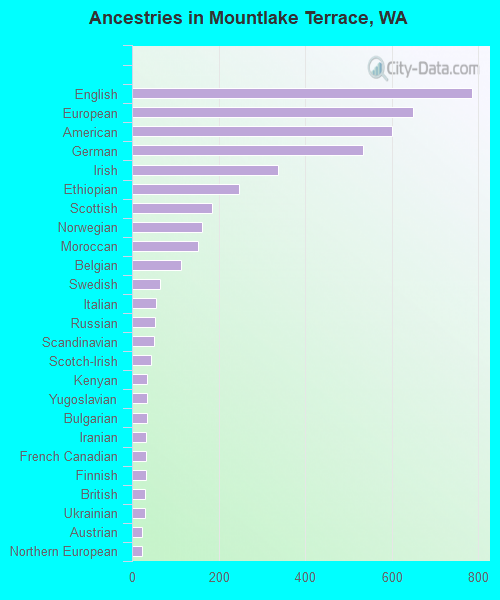
First ancestries reported:
English: 785 (8.3%)
European: 649 (6.9%)
American: 601 (6.4%)
German: 534 (5.7%)
Irish: 337 (3.6%)
Ethiopian: 247 (2.6%)
Scottish: 185 (2.0%)
Norwegian: 162 (1.7%)
Moroccan: 152 (1.6%)
Belgian: 112 (1.2%)
Swedish: 65 (0.7%)
Italian: 55 (0.6%)
Russian: 53 (0.6%)
Scandinavian: 51 (0.5%)
Scotch-Irish: 45 (0.5%)
Kenyan: 35 (0.4%)
Yugoslavian: 34 (0.4%)
Bulgarian: 34 (0.4%)
Iranian: 33 (0.4%)
French Canadian: 33 (0.4%)
Finnish: 32 (0.3%)
British: 30 (0.3%)
Ukrainian: 29 (0.3%)
Austrian: 23 (0.2%)
Northern European: 23 (0.2%)
Greek: 22 (0.2%)
Canadian: 20 (0.2%)
African: 17 (0.2%)
Hungarian: 15 (0.2%)
Afghan: 14 (0.1%)
French: 13 (0.1%)
Czechoslovakian: 12 (0.1%)
Jamaican: 12 (0.1%)
Latvian: 10 (0.1%)
Sudanese: 8 (0.08%)
Icelander: 8 (0.08%)
Polish: 7 (0.07%)
Eastern European: 6 (0.06%)
Dutch: 5 (0.05%)
Lebanese: 5 (0.05%)
Lithuanian: 4 (0.04%) Most common places of birth for foreign-born residents (%): Mexico Mountlake Terrace:
18.0% (731)Washington:
21.1% (241,655)
Philippines Mountlake Terrace:
9.5% (386)Washington:
6.3% (71,661)
China, excluding Hong Kong and Taiwan Mountlake Terrace:
8.4% (339)Washington:
7.4% (84,470)
Vietnam Mountlake Terrace:
6.3% (256)Washington:
5.4% (62,003)
Thailand Mountlake Terrace:
5.9% (238)Washington:
0.9% (9,937)
India Mountlake Terrace:
5.8% (237)Washington:
8.9% (101,353)
Ethiopia Mountlake Terrace:
5.1% (205)Washington:
1.6% (17,938)
Korea Mountlake Terrace:
4.8% (194)Washington:
4.3% (48,886)
United Kingdom, excluding England and Scotland Mountlake Terrace:
2.9% (119)Washington:
1.0% (10,943)
Russia Mountlake Terrace:
2.1% (86)Washington:
1.9% (21,540)
Canada Mountlake Terrace:
2.1% (84)Washington:
4.1% (47,238)
Japan Mountlake Terrace:
2.0% (83)Washington:
1.5% (17,453)
Morocco Mountlake Terrace:
2.0% (81)Washington:
0.2% (1,755)
Indonesia Mountlake Terrace:
1.7% (70)Washington:
0.3% (3,995)
Germany Mountlake Terrace:
1.6% (65)Washington:
1.6% (17,761)
Place of birth for U.S.-born residents:
This state: 9,780Other state: 7,247Northeast: 1,057Midwest: 2,012South: 1,015West: 3,218 83.1% of Mountlake Terrace residents lived in the same house 1 years ago.
Out of people who lived in different houses, 22.1% lived in this county.
Out of people who lived in different counties, 65.1% lived in Washington.
Mountlake Terrace:
83.1%State average:
85.2%
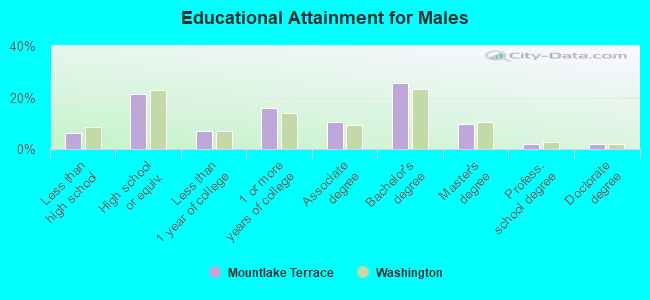
Education attainment for males 25 years and older:
No schooling: 62Nursery to 4th grade: 05th and 6th grade: 237th and 8th grade: 299th grade: 9110th grade: 3311th grade: 10112th grade, no diploma: 141High school graduate (or equivalency): 1,643Less than 1 year of college: 552Some college more than 1 year, no degree: 1,223Associate degree: 808Bachelor's degree: 1,990Master's degree: 741Professional school degree: 161Doctorate degree: 148
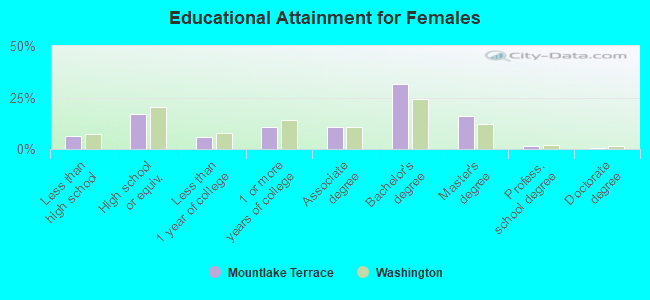
Education attainment for females 25 years and older:
No schooling: 175Nursery to 4th grade: 05th and 6th grade: 777th and 8th grade: 339th grade: 2610th grade: 12011th grade: 2912th grade, no diploma: 94High school graduate (or equivalency): 1,507Less than 1 year of college: 509Some college more than 1 year, no degree: 961Associate degree: 963Bachelor's degree: 2,784Master's degree: 1,398Professional school degree: 150Doctorate degree: 35
Housing units in structures:
One, detached: 4,888One, attached: 568Two: 2393 or 4: 5645 to 9: 76110 to 19: 87520 to 49: 78850 or more: 734Mobile homes: 189Housing units lacking complete plumbing facilities in 2022: 1.6%Housing units lacking complete kitchen facilities in 2022: 1.4%House/condo owner moved in on average 12 years ago
Renter moved in on average 2 years ago
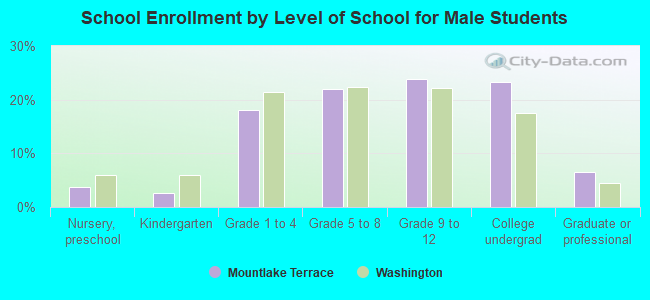
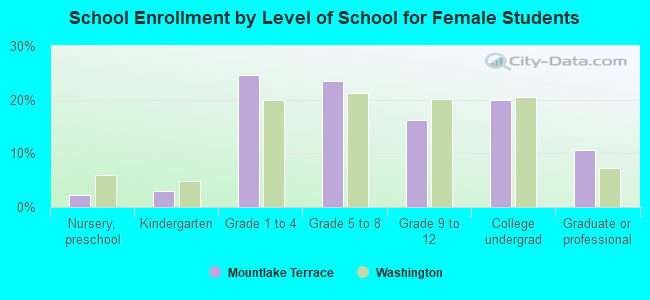
Private vs. public school enrollment:
Students in private schools in grades 1 to 8 (elementary and middle school): 117 Here:
6.0%Washington:
12.4%
Students in private schools in grades 9 to 12 (high school): 89 Students in private undergraduate colleges: 134 Here:
13.6%Washington:
16.5%