Mulvane, KS (Kansas) Houses and Residents
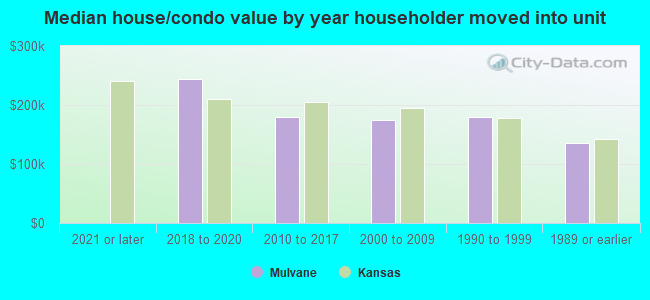
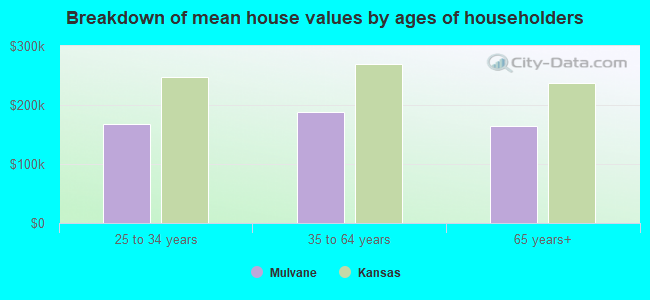
| Mulvane: | $180,298 |
| Kansas: | $206,600 |
Total population: 6,289 (Urban population: 5,041, Rural population: 46 (all nonfarm))
Houses: 2,491 (2,370 occupied: 1,868 owner occupied, 531 renter occupied)
| % of renters here: | 22% |
| State: | 32% |
Housing density: 1,093 houses/condos per square mile
Median price asked for vacant for-sale houses and condos in 2022 in this county: $87,489.
Median contract rent in 2022: $850 (lower quartile is $534, upper quartile is $1,260)
Median rent asked for vacant for-rent units in 2022: $2,668
Median gross rent in Mulvane, KS in 2022: $1,135
Housing units in Mulvane with a mortgage: 1,411 (189 second mortgage, 9 home equity loan, 147 both second mortgage and home equity loan)
Houses without a mortgage: 21
Median household income for houses/condos with a mortgage: $84,191
Median household income for apartments without a mortgage: $49,507
Median monthly housing costs: $1,225
Compare current foreclosures near Mulvane, KS:
| Photo | Address | Area | Beds / Baths | Price | Details |
|---|---|---|---|---|---|

|
#1
S Oliver St
Mulvane, KS 67110
|
2,559 sq. feet
|
2 baths 2 beds |
show details | |

|
#2
Elizabeth St
Mulvane, KS 67110
|
1,453 sq. feet
|
1 baths 2 beds |
show details | |

|
#3
Lisa Ln
Mulvane, KS 67110
|
1,201 sq. feet
|
3 baths 2 beds |
show details | |

|
#4
N Myers Cir
Mulvane, KS 67110
|
1,020 sq. feet
|
3 baths 2 beds |
show details | |

|
#5
E Glenn St
Mulvane, KS 67110
|
- sq. feet
|
- baths - beds |
show details | |

|
#6
Shelly Dr
Mulvane, KS 67110
|
- sq. feet
|
- baths - beds |
show details | |

|
#7
Shelly Dr
Mulvane, KS 67110
|
- sq. feet
|
- baths - beds |
show details | |

|
#8
E Rock Road Ct Apt F5
Mulvane, KS 67110
|
- sq. feet
|
- baths - beds |
show details | |

|
#9
W 29th St S
Wichita, KS 67217
|
960 sq. feet
|
2 baths 3 beds |
show details | |

|
#10
E Bluestem St
Wichita, KS 67207
|
1,020 sq. feet
|
2 baths 3 beds |
show details |
| Photo | Address | Area | Beds / Baths | Price | Details |
|---|---|---|---|---|---|

|
#11
S Verna Ave
Andover, KS 67002
|
720 sq. feet
|
1 baths 2 beds |
show details | |

|
#12
N Washington St
Belle Plaine, KS 67013
|
1,187 sq. feet
|
2 baths 4 beds |
show details | |

|
#13
S Davidson St
Wichita, KS 67210
|
1,120 sq. feet
|
1 baths 3 beds |
show details | |

|
#14
S Water St
Wichita, KS 67213
|
936 sq. feet
|
1 baths 2 beds |
show details | |

|
#15
W Wildwood Ln
Wichita, KS 67217
|
864 sq. feet
|
1 baths 2 beds |
show details | |

|
#16
S Armour St
Wichita, KS 67207
|
1,352 sq. feet
|
3 baths 6 beds |
show details | |

|
#17
S Ash St
Wichita, KS 67211
|
1,080 sq. feet
|
1 baths 2 beds |
show details | |

|
#18
E Bayley Ct
Wichita, KS 67207
|
1,239 sq. feet
|
3 baths 3 beds |
show details | |

|
#19
S Bonn Ave
Wichita, KS 67217
|
1,053 sq. feet
|
1 baths 3 beds |
show details | |

|
#20
S Cypress St
Wichita, KS 67207
|
1,323 sq. feet
|
2 baths 3 beds |
show details |
| Photo | Address | Area | Beds / Baths | Price | Details |
|---|---|---|---|---|---|

|
#21
S Market St
Wichita, KS 67211
|
1,662 sq. feet
|
2 baths 3 beds |
show details | |

|
#22
S Poplar St
Douglass, KS 67039
|
1,900 sq. feet
|
1 baths 3 beds |
show details | |

|
#23
S Custer Ave
Wichita, KS 67217
|
1,032 sq. feet
|
1 baths 3 beds |
show details | |

|
#24
E Dresden Ln
Wichita, KS 67207
|
1,292 sq. feet
|
1 baths 3 beds |
show details | |

|
#25
E Sennett St
Wichita, KS 67211
|
1,296 sq. feet
|
1 baths 3 beds |
show details | |

|
#26
E Lincoln St
Wichita, KS 67207
|
1,025 sq. feet
|
1 baths 3 beds |
show details | |

|
#27
S Boyd Ct
Wichita, KS 67215
|
936 sq. feet
|
2 baths 3 beds |
show details | |

|
#28
E Gilbert St
Wichita, KS 67207
|
1,290 sq. feet
|
1 baths 3 beds |
show details | |

|
#29
E Menlo St
Wichita, KS 67211
|
1,958 sq. feet
|
2 baths 3 beds |
show details | |

|
#30
W Wildwood Cir
Wichita, KS 67217
|
2,038 sq. feet
|
3 baths 4 beds |
show details |
| Photo | Address | Area | Beds / Baths | Price | Details |
|---|---|---|---|---|---|

|
#31
S Hiram Ave
Wichita, KS 67217
|
1,180 sq. feet
|
2 baths 3 beds |
show details | |

|
#32
S Edgemoor St
Wichita, KS 67218
|
1,183 sq. feet
|
1 baths 2 beds |
show details | |

|
#33
S Main St
Wichita, KS 67213
|
1,032 sq. feet
|
1 baths 2 beds |
show details | |

|
#34
S Mccomas Cir
Wichita, KS 67217
|
1,601 sq. feet
|
2 baths 3 beds |
show details | |

|
#35
E 6th St
Douglass, KS 67039
|
1,194 sq. feet
|
2 baths 3 beds |
show details | |

|
#36
S Kessler Cir
Wichita, KS 67217
|
1,674 sq. feet
|
2 baths 3 beds |
show details | |

|
#37
S Watson Ln
Wichita, KS 67207
|
983 sq. feet
|
1 baths 3 beds |
show details | |

|
#38
S Bennett Ave
Wichita, KS 67217
|
827 sq. feet
|
1 baths 2 beds |
show details | |

|
#39
Prairie Park Rd
Wichita, KS 67218
|
1,310 sq. feet
|
1 baths 3 beds |
show details | |

|
#40
S Glenn Ave
Wichita, KS 67217
|
1,025 sq. feet
|
1 baths 3 beds |
show details |
| Photo | Address | Area | Beds / Baths | Price | Details |
|---|---|---|---|---|---|

|
#41
S Kessler Ave
Wichita, KS 67217
|
1,292 sq. feet
|
1 baths 3 beds |
show details | |

|
#42
E Boston St
Wichita, KS 67218
|
672 sq. feet
|
1 baths 2 beds |
show details | |

|
#43
S Green St
Wichita, KS 67211
|
978 sq. feet
|
1 baths 2 beds |
show details | |

|
#44
S Vine St
Wichita, KS 67217
|
910 sq. feet
|
1 baths 3 beds |
show details | |

|
#45
S Elizabeth Ave
Wichita, KS 67217
|
924 sq. feet
|
1 baths 2 beds |
show details | |

|
#46
E Andrea St
Wichita, KS 67207
|
2,647 sq. feet
|
3 baths 4 beds |
show details | |

|
#47
W Calvert St
Wichita, KS 67217
|
1,454 sq. feet
|
2 baths 3 beds |
show details | |

|
#48
S Dellrose St
Wichita, KS 67218
|
997 sq. feet
|
1 baths 3 beds |
show details | |

|
#49
S Lori Ln
Wichita, KS 67207
|
1,336 sq. feet
|
3 baths 4 beds |
show details | |

|
Check over 1 million property listings on Foreclosure.com!
|
browse all offers | |||

Latest news about housing in Mulvane, KS collected exclusively by city-data.com from local newspapers, TV, and radio stations

 | Living here sucks...here's why (120 replies) |
| Sleepy Hollow Area (6 replies) |
| Is Wichita a good place to start over? (7 replies) |
| Moving from California to Wichita (Retired) (10 replies) |
| I'm moving to Topeka in 2 wks. Areas to avoid when apartment hunting? (6 replies) |
| Relocating: Andover, Derby, or Mulvane schools? (3 replies) |

Median year apartment built: 1988
Household type by relationship:
Households: 6,005- Male householders: 1,110 (197 living alone), Female householders: 1,235 (361 living alone)
1,278 spouses (1,278 opposite-sex spouses), 100 unmarried partners, (100 opposite-sex unmarried partners), 1,780 children (1,526 natural, 89 adopted, 165 stepchildren), 198 grandchildren, 25 brothers or sisters, 27 parents, 0 foster children, 24 other relatives, 163 non-relatives
- In group quarters: 63
Size of family households: 727 2-persons, 372 3-persons, 377 4-persons, 193 5-persons, 84 6-persons.
Size of nonfamily households: 582 1-person, 42 2-persons.
825 married couples with children.
427 single-parent households (71 men, 356 women).
98.3% of residents of Mulvane speak English at home.
1.7% of residents speak Spanish at home (69% speak English very well, 9% speak English well, 22% speak English not well).
0.2% of residents speak other Indo-European language at home (100% speak English very well).
Foreign born population: 65 (1.1%)
(38.5% of them are naturalized citizens)
| Here: | 7.2 |
| State: | 6.9 |
| Here: | 5.2 |
| State: | 4.4 |
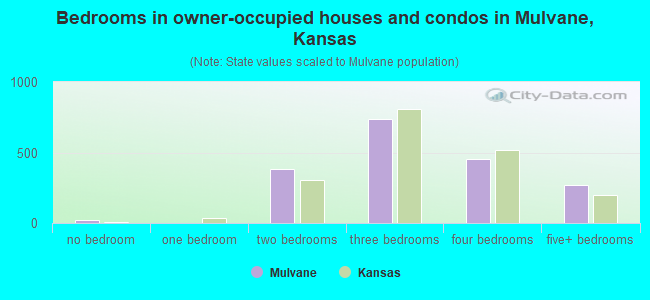
- Bedrooms in owner-occupied houses and condos in Mulvane, Kansas
- 23no bedroom
- 01 bedroom
- 3812 bedrooms
- 7363 bedrooms
- 4564 bedrooms
- 2735+ bedrooms
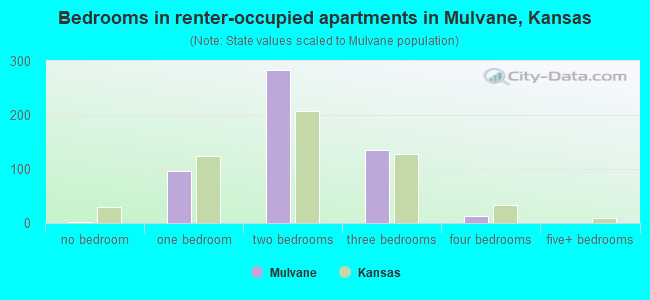
- Bedrooms in renter-occupied apartments in Mulvane, Kansas
- 1no bedroom
- 971 bedroom
- 2832 bedrooms
- 1363 bedrooms
- 134 bedrooms
- 05+ bedrooms
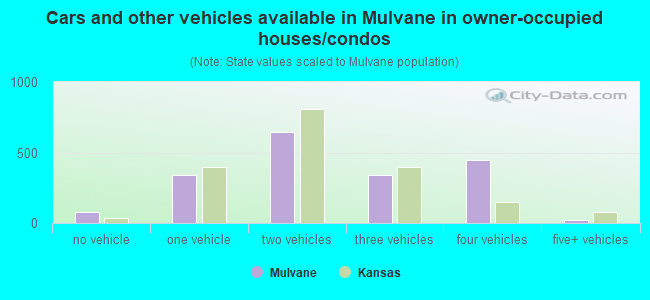
- Cars and other vehicles available in Mulvane in owner-occupied houses/condos
- 81no vehicle
- 3381 vehicle
- 6442 vehicles
- 3373 vehicles
- 4464 vehicles
- 245+ vehicles
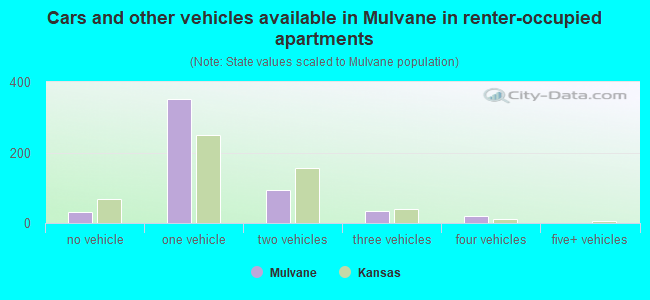
- Cars and other vehicles available in Mulvane in renter-occupied apartments
- 31no vehicle
- 3521 vehicle
- 952 vehicles
- 343 vehicles
- 194 vehicles
- 05+ vehicles
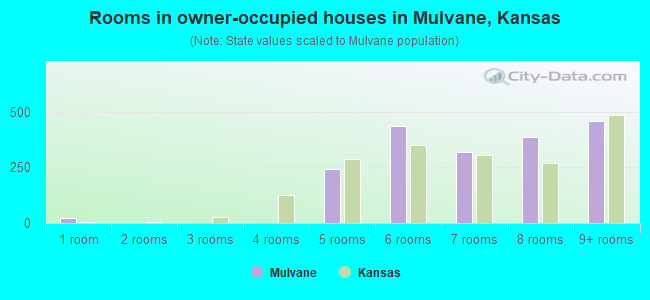
- Rooms in owner-occupied houses in Mulvane, Kansas
- 231 room
- 02 rooms
- 03 rooms
- 04 rooms
- 2435 rooms
- 4386 rooms
- 3197 rooms
- 3888 rooms
- 4589+ rooms
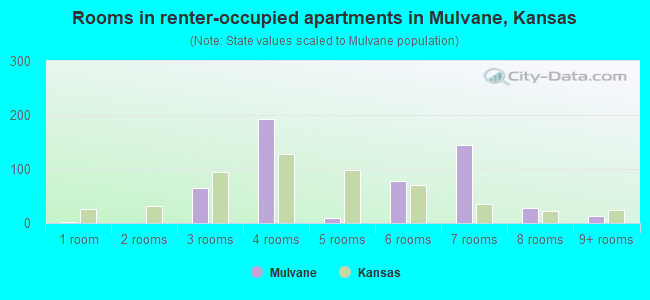
- Rooms in renter-occupied apartments in Mulvane, Kansas
- 11 room
- 02 rooms
- 653 rooms
- 1924 rooms
- 95 rooms
- 786 rooms
- 1457 rooms
- 278 rooms
- 139+ rooms
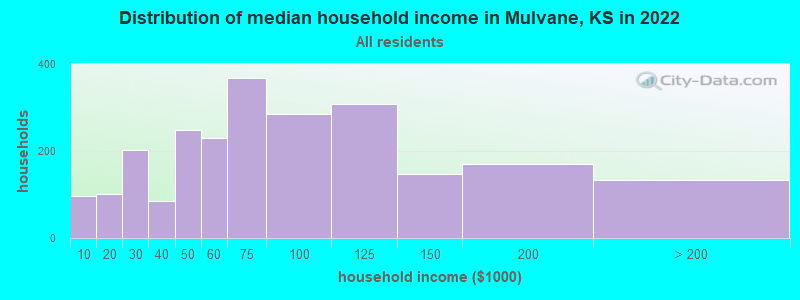
Mulvane, KS household income distribution

- 97Less than $10,000
- 101$10,000 to $19,999
- 203$20,000 to $29,999
- 84$30,000 to $39,999
- 249$40,000 to $49,999
- 229$50,000 to $59,999
- 367$60,000 to $74,999
- 286$75,000 to $99,999
- 308$100,000 to $124,999
- 148$125,000 to $149,999
- 169$150,000 to $199,999
- 133$200,000 or more
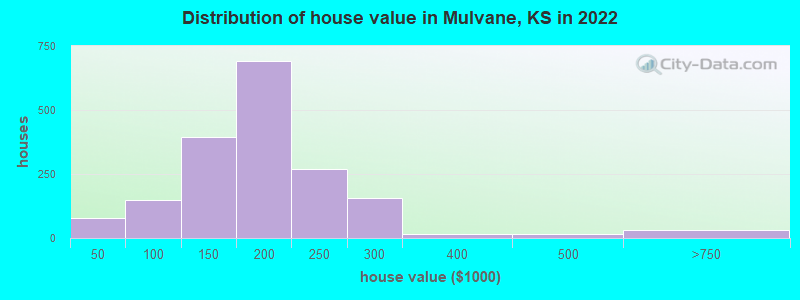
Home value of owner - occupied houses in 2022 in Mulvane, KS
-
- 30Less than $10,000
- 32$15,000 to $19,999
- 15$40,000 to $49,999
- 8$50,000 to $59,999
- 68$60,000 to $69,999
- 8$70,000 to $79,999
- 36$80,000 to $89,999
- 9$90,000 to $99,999
- 163$100,000 to $124,999
- 229$125,000 to $149,999
- 456$150,000 to $174,999
- 232$175,000 to $199,999
- 268$200,000 to $249,999
- 155$250,000 to $299,999
- 14$300,000 to $399,999
- 15$400,000 to $499,999
- 31$500,000 to $749,999
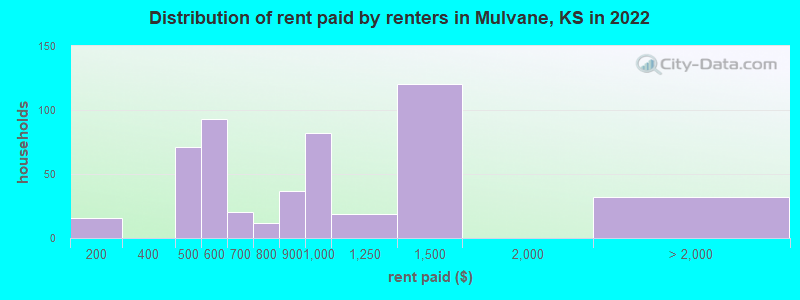
Rent paid by renters in 2022 in Mulvane, KS
-
- 16$150 to $199
- 71$450 to $499
- 44$500 to $549
- 48$550 to $599
- 19$650 to $699
- 11$700 to $749
- 36$800 to $899
- 81$900 to $999
- 19$1,000 to $1,249
- 120$1,250 to $1,499
- 31No cash rent
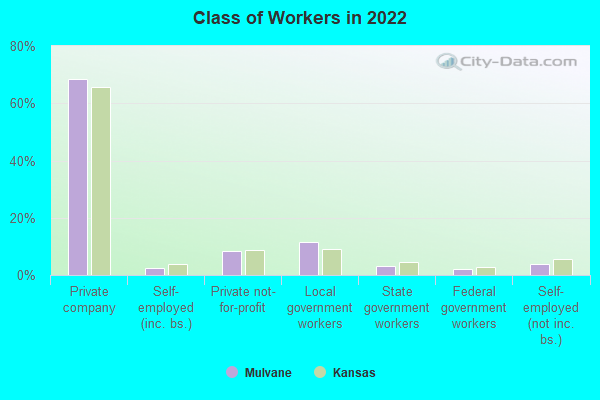
Percentage of workers working in this county: 81.4%
Number of people working at home: 256 (9.3% of all workers)
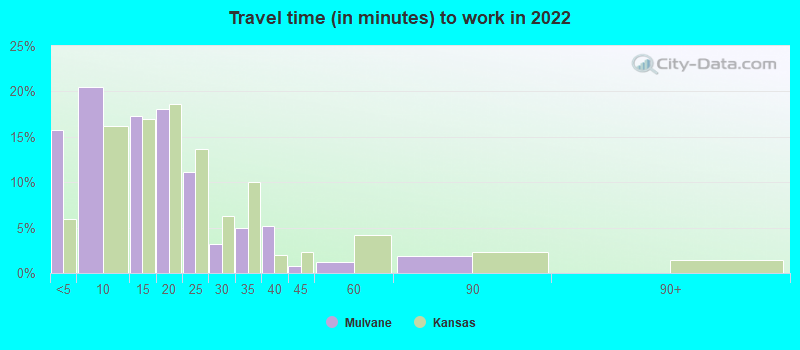
Travel time to work (commute)
- Less than 5 minutes: 227
- 5 to 9 minutes: 225
- 10 to 14 minutes: 397
- 15 to 19 minutes: 253
- 20 to 24 minutes: 291
- 25 to 29 minutes: 164
- 30 to 34 minutes: 449
- 35 to 39 minutes: 226
- 40 to 44 minutes: 113
- 45 to 59 minutes: 98
- 60 to 89 minutes: 0
- 90 or more minutes: 0
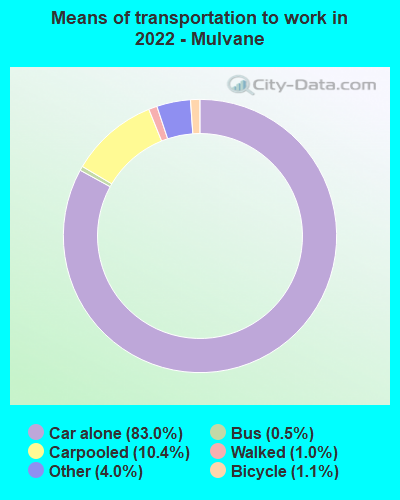
Means of transportation to work:
- Drove a car alone: 1,283 (71.2%)
- Carpooled: 162 (9.0%)
- Bus: 8 (0.4%)
- Taxi: 74 (4.1%)
- Bicycle: 17 (0.9%)
- Walked: 16 (0.9%)
- Worked at home: 256 (14.2%)
- Unemployment by race in 2022
- Unemployment rate for White non-Hispanic residents
- 5.7%Males
- 8.1%Females
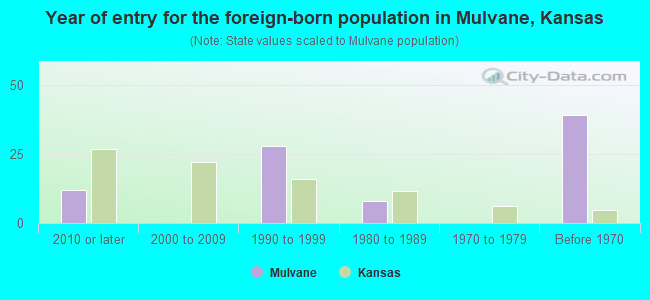
- Year of entry for the foreign-born population in Mulvane, Kansas
- 122010 or later
- 02000 to 2009
- 281990 to 1999
- 81980 to 1989
- 01970 to 1979
- 39Before 1970
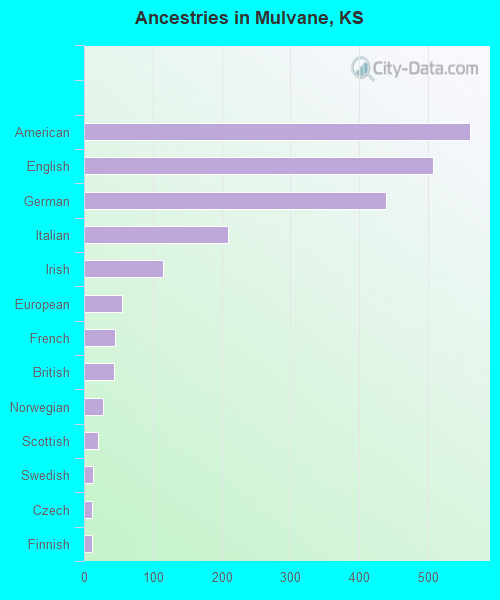
First ancestries reported:
- American: 561 (20.2%)
- English: 507 (18.3%)
- German: 439 (15.8%)
- Italian: 209 (7.5%)
- Irish: 115 (4.1%)
- European: 55 (2.0%)
- French: 45 (1.6%)
- British: 44 (1.6%)
- Norwegian: 28 (1.0%)
- Scottish: 21 (0.8%)
- Swedish: 13 (0.5%)
- Czech: 12 (0.4%)
- Finnish: 12 (0.4%)
Most common places of birth for foreign-born residents (%):
| Mulvane: | 42.4% (28) |
| Kansas: | 1.6% (3,349) |
| Mulvane: | 39.4% (26) |
| Kansas: | 0.7% (1,372) |
| Mulvane: | 13.6% (9) |
| Kansas: | 1.6% (3,353) |
Place of birth for U.S.-born residents:
- This state: 3,712
- Other state: 2,118
- Northeast: 137
- Midwest: 451
- South: 938
- West: 609
90.3% of Mulvane residents lived in the same house 1 years ago.
Out of people who lived in different houses, 30.8% lived in this county.
Out of people who lived in different counties, 95.6% lived in Kansas.
| Mulvane: | 90.3% |
| State average: | 85.3% |
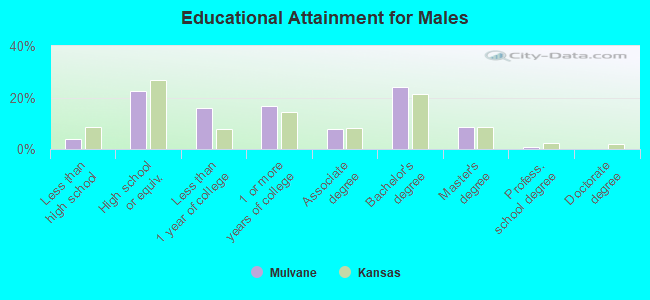
Education attainment for males 25 years and older:
- No schooling: 33
- Nursery to 4th grade: 0
- 5th and 6th grade: 0
- 7th and 8th grade: 9
- 9th grade: 11
- 10th grade: 13
- 11th grade: 6
- 12th grade, no diploma: 0
- High school graduate (or equivalency): 421
- Less than 1 year of college: 294
- Some college more than 1 year, no degree: 309
- Associate degree: 144
- Bachelor's degree: 450
- Master's degree: 156
- Professional school degree: 13
- Doctorate degree: 0
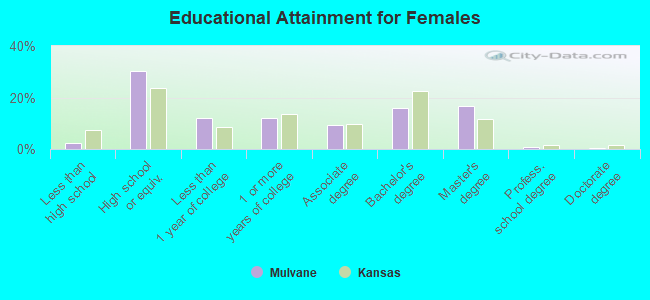
Education attainment for females 25 years and older:
- No schooling: 27
- Nursery to 4th grade: 0
- 5th and 6th grade: 0
- 7th and 8th grade: 0
- 9th grade: 14
- 10th grade: 0
- 11th grade: 8
- 12th grade, no diploma: 0
- High school graduate (or equivalency): 639
- Less than 1 year of college: 256
- Some college more than 1 year, no degree: 254
- Associate degree: 200
- Bachelor's degree: 338
- Master's degree: 356
- Professional school degree: 17
- Doctorate degree: 10


Housing units in structures:
- One, detached: 2,084
- One, attached: 86
- 3 or 4: 218
- 5 to 9: 86
- 50 or more: 1
- Mobile homes: 13
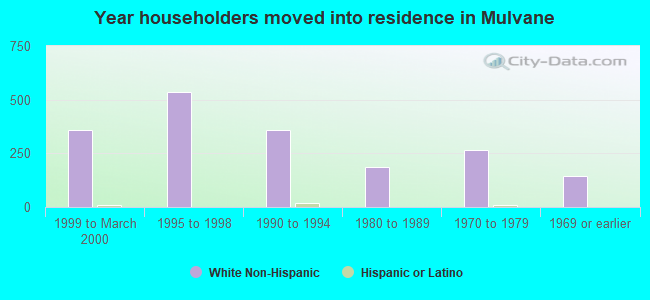
House/condo owner moved in on average 11 years ago
Renter moved in on average 3 years ago
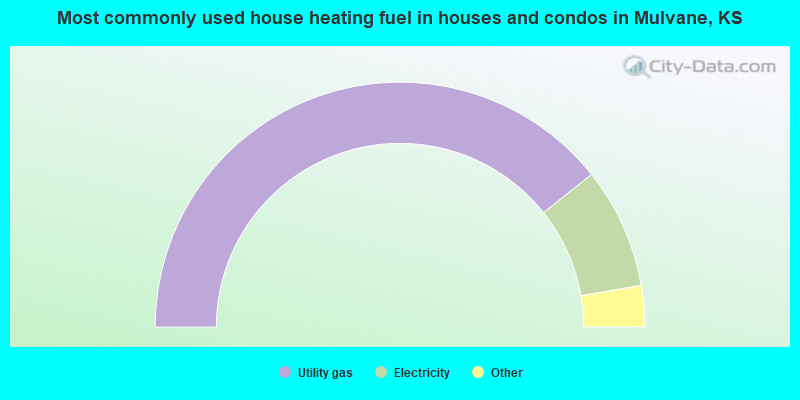
- 78.6%Utility gas
- 16.0%Electricity
- 2.5%Wood
- 2.1%Bottled, tank, or LP gas
- 0.8%No fuel used
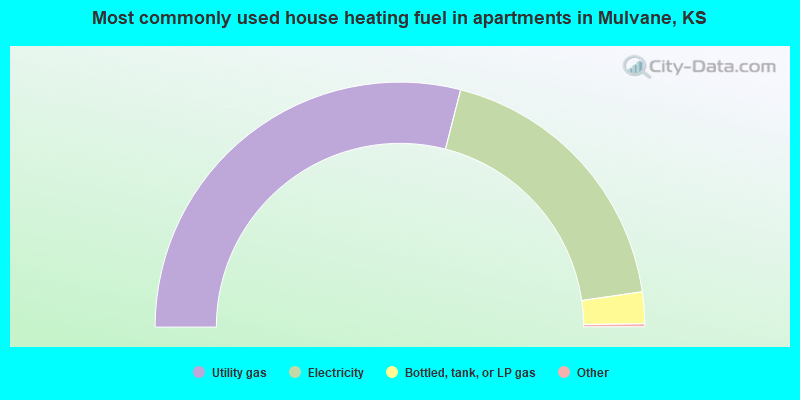
- 58.2%Utility gas
- 37.6%Electricity
- 4.2%Bottled, tank, or LP gas
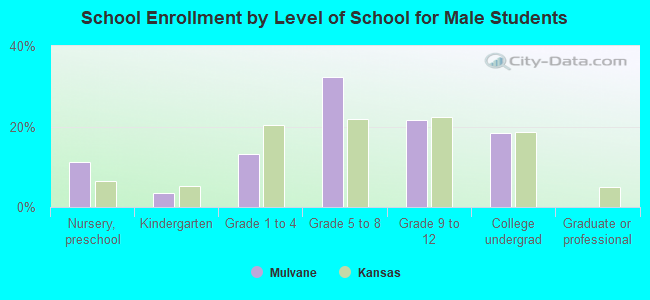
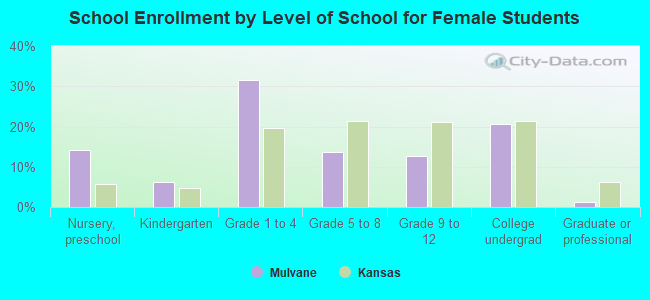
Private vs. public school enrollment:
| Here: | 0.0% |
| Kansas: | 14.1% |
| Here: | 0.0% |
| Kansas: | 10.8% |
| Here: | 11.8% |
| Kansas: | 15.4% |