Munster, IN (Indiana) Houses and Residents
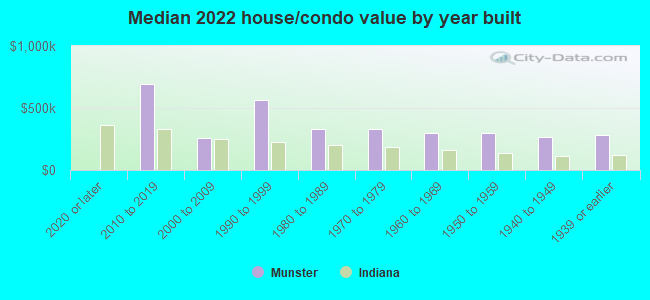
| Munster: | $325,738 |
| Indiana: | $208,700 |
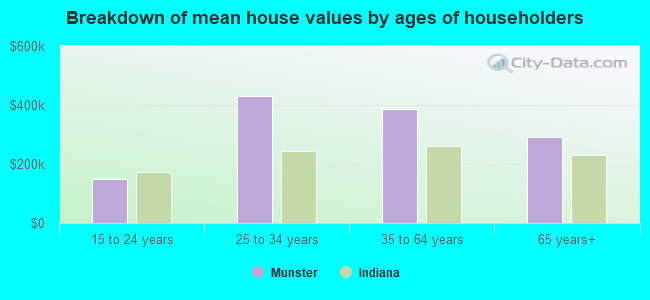
Mean price in 2022:
Detached houses: $409,508
Here: $409,508 State: $257,916 Townhouses or other attached units: $258,184
Here: $258,184 State: $224,114 In 3-to-4-unit structures: $187,966
Here: $187,966 State: $151,116 In 5-or-more-unit structures: $149,221
Here: $149,221 State: $200,844
Total population: 23,103 (Urban population: 21,511, Rural population: 0)
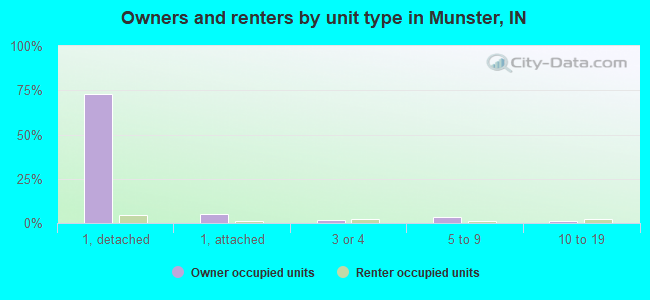
Houses: 9,876 (9,399 occupied: 8,141 owner occupied, 1,267 renter occupied)
| % of renters here: | 13% |
| State: | 29% |
Housing density: 1,310 houses/condos per square mile
Median price asked for vacant for-sale houses and condos in 2022: $393,036.
Median contract rent in 2022: $1,092 (lower quartile is $921, upper quartile is $1,354)
Median rent asked for vacant for-rent units in 2022: $1,431
Median gross rent in Munster, IN in 2022: $1,230
Housing units in Munster with a mortgage: 4,856 (581 second mortgage, 103 home equity loan, 528 both second mortgage and home equity loan)
Houses without a mortgage: 157
Median household income for houses/condos with a mortgage: $127,421
Median household income for apartments without a mortgage: $83,557
Median monthly housing costs: $1,322
Compare current foreclosures in Munster, IN:
| Photo | Address | Area | Beds / Baths | Price | Details |
|---|---|---|---|---|---|

|
#1
Harrison Ave
Munster, IN 46321
|
2,052 sq. feet
|
2 baths 4 beds |
show details | |

|
#2
Greenwood Ave
Munster, IN 46321
|
2,406 sq. feet
|
1 baths 3 beds |
show details | |

|
#3
Columbia Ave
Munster, IN 46321
|
2,571 sq. feet
|
1 baths 3 beds |
show details | |

|
#4
Hollywood Ave
Munster, IN 46321
|
1,296 sq. feet
|
1 baths 2 beds |
show details | |

|
#5
Hawthorne Dr
Munster, IN 46321
|
2,502 sq. feet
|
1 baths 3 beds |
show details | |

|
#6
Fisher St
Munster, IN 46321
|
4,515 sq. feet
|
2 baths 4 beds |
show details | |

|
#7
Monaldi Dr
Munster, IN 46321
|
2,520 sq. feet
|
1 baths 3 beds |
show details | |

|
#8
Jefferson Ave
Munster, IN 46321
|
1,884 sq. feet
|
1 baths 2 beds |
show details | |

|
#9
Chestnut Ct
Munster, IN 46321
|
3,636 sq. feet
|
2 baths 4 beds |
show details | |

|
#10
River Dr
Munster, IN 46321
|
2,490 sq. feet
|
1 baths 3 beds |
show details |
| Photo | Address | Area | Beds / Baths | Price | Details |
|---|---|---|---|---|---|

|
#11
Forest Ave
Munster, IN 46321
|
2,016 sq. feet
|
1 baths 2 beds |
show details | |

|
#12
Bluebird Ln
Munster, IN 46321
|
1,758 sq. feet
|
1 baths 3 beds |
show details | |

|
#13
Columbia Ave
Munster, IN 46321
|
2,016 sq. feet
|
1 baths 3 beds |
show details | |

|
#14
Holly Ln
Munster, IN 46321
|
1,385 sq. feet
|
1 baths 3 beds |
show details | |

|
#15
State Line Ave
Munster, IN 46321
|
2,907 sq. feet
|
1 baths 3 beds |
show details | |

|
#16
Broadmoor Ave
Munster, IN 46321
|
1,968 sq. feet
|
1 baths 2 beds |
show details | |

|
#17
River Dr
Munster, IN 46321
|
1,192 sq. feet
|
1 baths 2 beds |
show details | |

|
#18
Tulip Ln
Munster, IN 46321
|
2,754 sq. feet
|
1 baths 3 beds |
show details | |

|
#19
Chestnut Ln
Munster, IN 46321
|
2,350 sq. feet
|
1 baths 3 beds |
show details | |

|
#20
Monroe Ave
Munster, IN 46321
|
2,614 sq. feet
|
1 baths 3 beds |
show details |
| Photo | Address | Area | Beds / Baths | Price | Details |
|---|---|---|---|---|---|

|
#21
Van Buren Ave
Munster, IN 46321
|
2,468 sq. feet
|
1 baths 3 beds |
show details | |

|
#22
Belden Pl
Munster, IN 46321
|
2,490 sq. feet
|
2 baths 3 beds |
show details | |

|
#23
Beacon Pl
Munster, IN 46321
|
3,396 sq. feet
|
1 baths 4 beds |
show details | |

|
#24
Highland Pl
Munster, IN 46321
|
1,253 sq. feet
|
1 baths 2 beds |
show details | |

|
#25
Terrace Dr
Munster, IN 46321
|
- sq. feet
|
- baths - beds |
show details | |

|
#26
Park West Cir
Munster, IN 46321
|
- sq. feet
|
- baths - beds |
show details | |

|
#27
Camellia Dr
Munster, IN 46321
|
- sq. feet
|
- baths - beds |
show details | |

|
#28
Fran Lin Pkwy
Munster, IN 46321
|
- sq. feet
|
- baths - beds |
show details | |

|
#29
Adelaide Pl
Munster, IN 46321
|
- sq. feet
|
- baths - beds |
show details | |

|
#30
Hohman Ave
Munster, IN 46321
|
- sq. feet
|
- baths - beds |
show details |
| Photo | Address | Area | Beds / Baths | Price | Details |
|---|---|---|---|---|---|

|
#31
Camellia Dr Apt 3
Munster, IN 46321
|
- sq. feet
|
- baths - beds |
show details | |

|
#32
Cambridge Ct Apt 2a
Munster, IN 46321
|
- sq. feet
|
- baths - beds |
show details | |

|
#33
Camellia Dr Apt 1
Munster, IN 46321
|
- sq. feet
|
- baths - beds |
show details | |

|
#34
Camellia Dr Apt 7
Munster, IN 46321
|
- sq. feet
|
- baths - beds |
show details | |

|
#35
South St Apt 207
Munster, IN 46321
|
- sq. feet
|
- baths - beds |
show details | |

|
#36
Harrison Ave Apt 302
Munster, IN 46321
|
- sq. feet
|
- baths - beds |
show details | |

|
Check over 1 million property listings on Foreclosure.com!
|
browse all offers | |||

Latest news about housing in Munster, IN collected exclusively by city-data.com from local newspapers, TV, and radio stations

 | Community Estates - Munster (2 replies) |
| Centennial Village (Munster, IN) (89 replies) |
| Low Inventory of homes in the region (17 replies) |
| Do you think this home price in Munster is supported for the area? (22 replies) |
| Are there ANY houses to rent in the Munster area??? (6 replies) |
| Is it a good idea to buy/rent in Munster, IN and commute daily to Chicago downtown for work? (14 replies) |
Median year apartment built: 1973
Household type by relationship:
Households: 23,826- Male householders: 4,510 (1,210 living alone), Female householders: 4,823 (1,340 living alone)
5,328 spouses (5,307 opposite-sex spouses), 263 unmarried partners, (234 opposite-sex unmarried partners), 7,163 children (6,763 natural, 181 adopted, 218 stepchildren), 322 grandchildren, 82 brothers or sisters, 196 parents, 56 foster children, 229 other relatives, 487 non-relatives
- In group quarters: 362
Size of family households: 2,893 2-persons, 1,649 3-persons, 1,281 4-persons, 439 5-persons, 78 6-persons, 97 7-or-more-persons.
Size of nonfamily households: 2,614 1-person, 312 2-persons, 16 4-persons.
3,572 married couples with children.
575 single-parent households (156 men, 419 women).
83.7% of residents of Munster speak English at home.
7.4% of residents speak Spanish at home (85% speak English very well, 8% speak English well, 5% speak English not well, 2% don't speak English at all).
6.5% of residents speak other Indo-European language at home (72% speak English very well, 24% speak English well, 4% speak English not well, 1% don't speak English at all).
2.3% of residents speak Asian or Pacific Island language at home (43% speak English very well, 33% speak English well, 13% speak English not well, 10% don't speak English at all).
1.5% of residents speak other language at home (95% speak English very well, 5% speak English well).
Foreign born population: 2,452 (10.3%)
(64.7% of them are naturalized citizens)
| Here: | 6.8 |
| State: | 6.6 |
| Here: | 4.4 |
| State: | 4.3 |
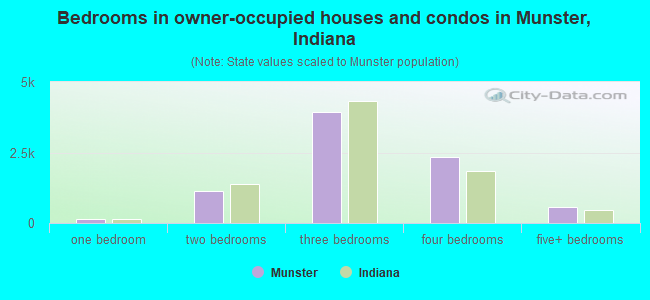
- Bedrooms in owner-occupied houses and condos in Munster, Indiana
- 0no bedroom
- 1571 bedroom
- 1,1502 bedrooms
- 3,9263 bedrooms
- 2,3324 bedrooms
- 5775+ bedrooms
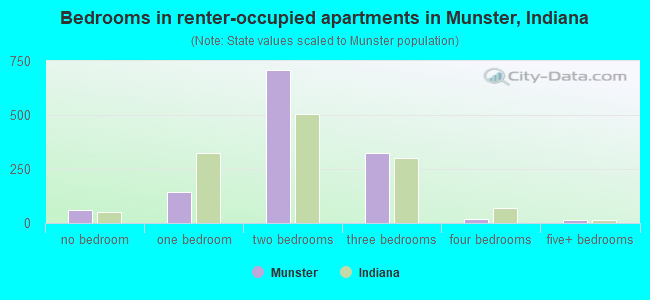
- Bedrooms in renter-occupied apartments in Munster, Indiana
- 60no bedroom
- 1451 bedroom
- 7092 bedrooms
- 3243 bedrooms
- 174 bedrooms
- 125+ bedrooms
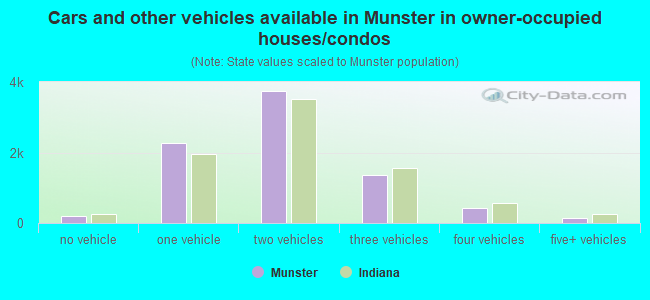
- Cars and other vehicles available in Munster in owner-occupied houses/condos
- 201no vehicle
- 2,2801 vehicle
- 3,7482 vehicles
- 1,3483 vehicles
- 4364 vehicles
- 1285+ vehicles
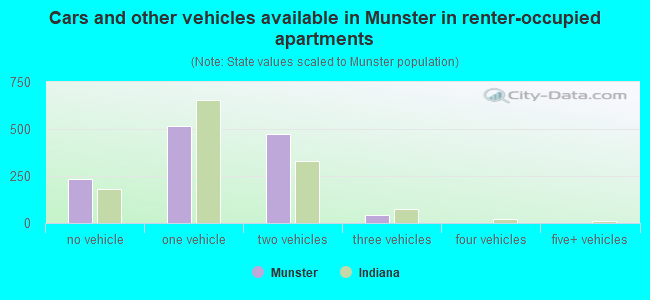
- Cars and other vehicles available in Munster in renter-occupied apartments
- 233no vehicle
- 5171 vehicle
- 4752 vehicles
- 433 vehicles
- 04 vehicles
- 05+ vehicles
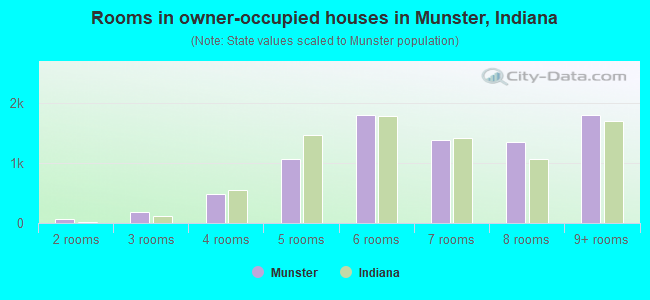
- Rooms in owner-occupied houses in Munster, Indiana
- 01 room
- 682 rooms
- 1793 rooms
- 4814 rooms
- 1,0655 rooms
- 1,8026 rooms
- 1,3877 rooms
- 1,3578 rooms
- 1,8049+ rooms
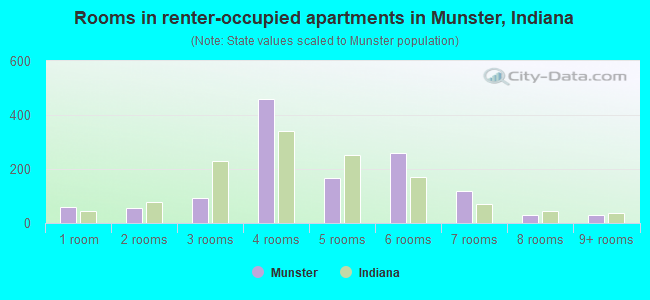
- Rooms in renter-occupied apartments in Munster, Indiana
- 601 room
- 542 rooms
- 913 rooms
- 4584 rooms
- 1655 rooms
- 2596 rooms
- 1197 rooms
- 308 rooms
- 309+ rooms
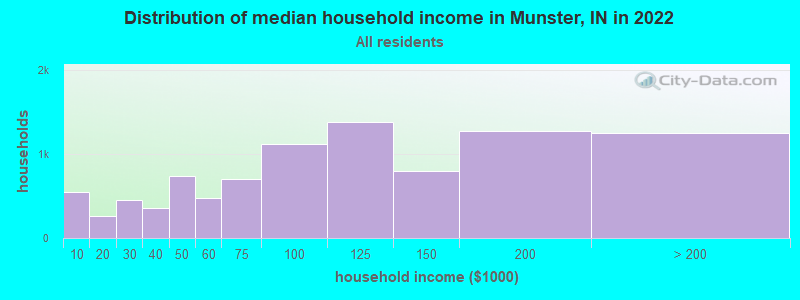
Munster, IN household income distribution

- 548Less than $10,000
- 266$10,000 to $19,999
- 456$20,000 to $29,999
- 356$30,000 to $39,999
- 735$40,000 to $49,999
- 476$50,000 to $59,999
- 698$60,000 to $74,999
- 1,120$75,000 to $99,999
- 1,383$100,000 to $124,999
- 795$125,000 to $149,999
- 1,272$150,000 to $199,999
- 1,255$200,000 or more
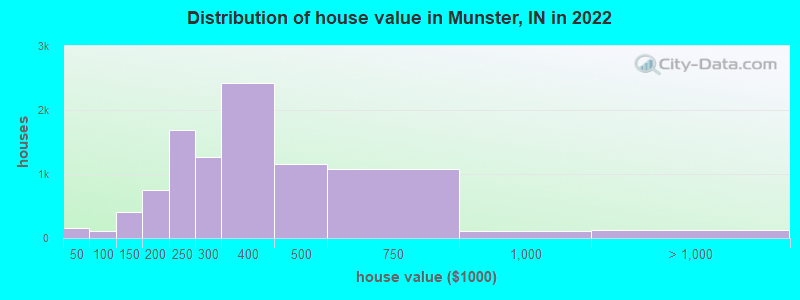
Home value of owner - occupied houses in 2022 in Munster, IN
-
- 46$15,000 to $19,999
- 54$20,000 to $24,999
- 37$25,000 to $29,999
- 11$30,000 to $34,999
- 12$50,000 to $59,999
- 10$60,000 to $69,999
- 69$80,000 to $89,999
- 17$90,000 to $99,999
- 157$100,000 to $124,999
- 248$125,000 to $149,999
- 449$150,000 to $174,999
- 296$175,000 to $199,999
- 1,691$200,000 to $249,999
- 1,265$250,000 to $299,999
- 2,424$300,000 to $399,999
- 1,155$400,000 to $499,999
- 1,080$500,000 to $749,999
- 114$750,000 to $999,999
- 29$1,000,000 to $1,499,999
- 13$1,500,000 to $1,999,999
- 77$2,000,000 or more
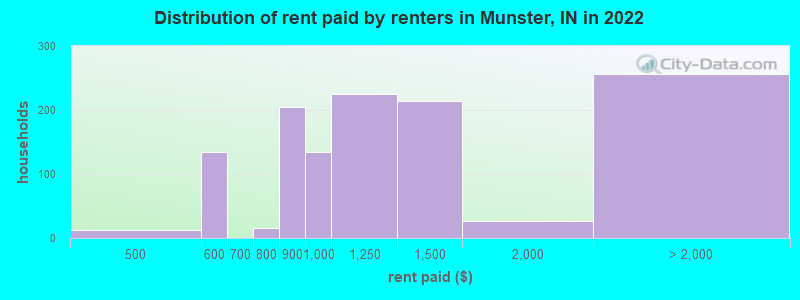
Rent paid by renters in 2022 in Munster, IN
-
- 12$400 to $449
- 133$550 to $599
- 15$750 to $799
- 205$800 to $899
- 133$900 to $999
- 224$1,000 to $1,249
- 214$1,250 to $1,499
- 26$1,500 to $1,999
- 32$2,000 to $2,499
- 19$2,500 to $2,999
- 42$3,000 to $3,499
- 102$3,500 or more
- 60No cash rent
Percentage of workers working in this county: 64.8%
Number of people working at home: 1,920 (16.3% of all workers)
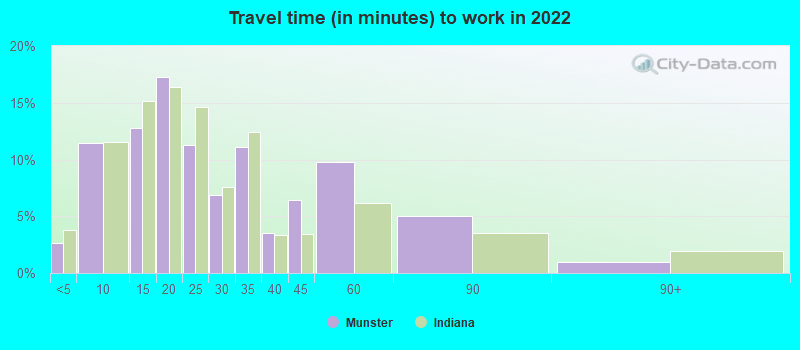
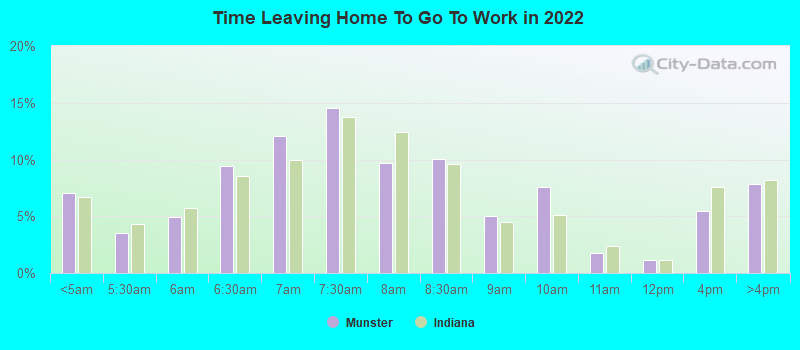
Travel time to work (commute)
- Less than 5 minutes: 260
- 5 to 9 minutes: 1,518
- 10 to 14 minutes: 1,375
- 15 to 19 minutes: 1,208
- 20 to 24 minutes: 864
- 25 to 29 minutes: 855
- 30 to 34 minutes: 1,045
- 35 to 39 minutes: 330
- 40 to 44 minutes: 320
- 45 to 59 minutes: 1,226
- 60 to 89 minutes: 927
- 90 or more minutes: 299
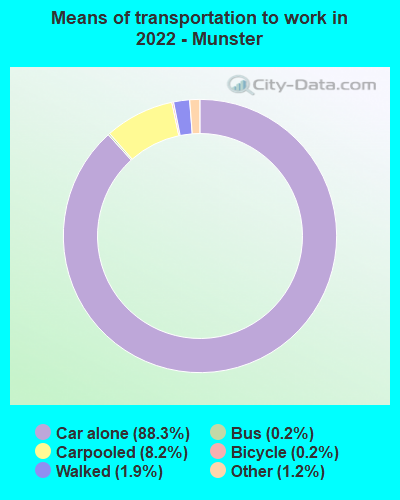
Means of transportation to work:
- Drove a car alone: 12,334 (76.9%)
- Carpooled: 1,367 (8.5%)
- Bus: 25 (0.2%)
- Long-distance train or commuter rail: 2 (0.0%)
- Taxi: 163 (1.0%)
- Bicycle: 73 (0.5%)
- Walked: 274 (1.7%)
- Worked at home: 1,920 (12.0%)
- Unemployment by race in 2022
- Unemployment rate for White non-Hispanic residents
- 1.9%Males
- 2.5%Females
- Unemployment rate for Black residents
- 17.3%Males
- Unemployment rate for Asian residents
- 2.9%Males
- 2.2%Females
- Unemployment rate for two or more race residents
- 1.0%Males
- 10.2%Females
- Unemployment rate for Hispanic or Latino residents
- 6.8%Females
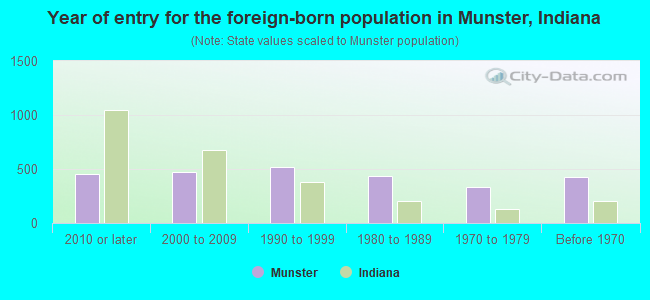
- Year of entry for the foreign-born population in Munster, Indiana
- 4522010 or later
- 4722000 to 2009
- 5161990 to 1999
- 4351980 to 1989
- 3341970 to 1979
- 426Before 1970
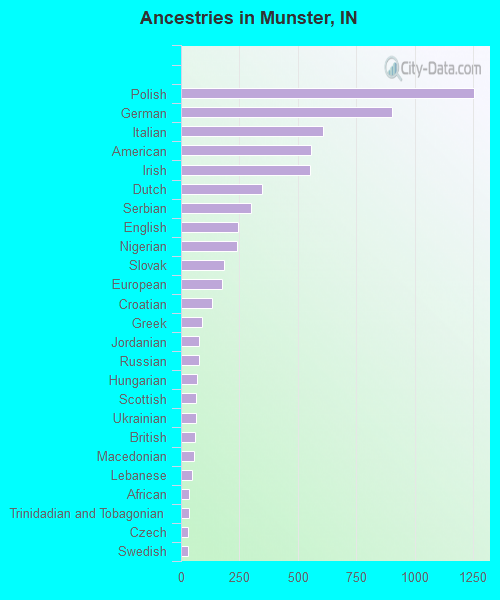
First ancestries reported:
- Polish: 1,256 (11.3%)
- German: 904 (8.1%)
- Italian: 606 (5.4%)
- American: 557 (5.0%)
- Irish: 553 (5.0%)
- Dutch: 345 (3.1%)
- Serbian: 299 (2.7%)
- English: 246 (2.2%)
- Nigerian: 239 (2.1%)
- Slovak: 184 (1.7%)
- European: 177 (1.6%)
- Croatian: 132 (1.2%)
- Greek: 92 (0.8%)
- Jordanian: 78 (0.7%)
- Russian: 75 (0.7%)
- Hungarian: 68 (0.6%)
- Scottish: 65 (0.6%)
- Ukrainian: 65 (0.6%)
- British: 59 (0.5%)
- Macedonian: 54 (0.5%)
- Lebanese: 49 (0.4%)
- African: 35 (0.3%)
- Trinidadian and Tobagonian: 33 (0.3%)
- Czech: 32 (0.3%)
- Swedish: 28 (0.3%)
- Jamaican: 28 (0.3%)
- Ghanaian: 27 (0.2%)
- Northern European: 24 (0.2%)
- Armenian: 22 (0.2%)
- Welsh: 22 (0.2%)
- Eastern European: 20 (0.2%)
- Romanian: 19 (0.2%)
- Assyrian: 17 (0.2%)
- Bulgarian: 16 (0.1%)
- Egyptian: 15 (0.1%)
- Syrian: 13 (0.1%)
- French: 13 (0.1%)
- Liberian: 11 (0.10%)
- Haitian: 11 (0.10%)
- Brazilian: 8 (0.07%)
- Czechoslovakian: 8 (0.07%)
- Lithuanian: 8 (0.07%)
- Norwegian: 8 (0.07%)
- Swiss: 8 (0.07%)
Most common places of birth for foreign-born residents (%):
| Munster: | 16.4% (416) |
| Indiana: | 8.5% (32,127) |
| Munster: | 13.4% (339) |
| Indiana: | 27.0% (101,996) |
| Munster: | 10.0% (254) |
| Indiana: | 0.8% (2,959) |
| Munster: | 8.7% (221) |
| Indiana: | 2.0% (7,653) |
| Munster: | 3.9% (98) |
| Indiana: | 3.1% (11,851) |
| Munster: | 3.5% (89) |
| Indiana: | 0.9% (3,221) |
| Munster: | 3.4% (86) |
| Indiana: | 0.3% (1,277) |
| Munster: | 3.2% (81) |
| Indiana: | 2.3% (8,656) |
| Munster: | 3.1% (79) |
| Indiana: | 5.3% (19,877) |
| Munster: | 2.8% (71) |
| Indiana: | 0.5% (1,808) |
| Munster: | 2.6% (66) |
| Indiana: | 3.3% (12,337) |
| Munster: | 2.3% (57) |
| Indiana: | 0.2% (705) |
| Munster: | 1.8% (45) |
| Indiana: | 0.9% (3,307) |
| Munster: | 1.7% (42) |
| Indiana: | 1.7% (6,439) |
| Munster: | 1.5% (39) |
| Indiana: | 0.1% (439) |
| Munster: | 1.5% (38) |
| Indiana: | 1.2% (4,520) |
Place of birth for U.S.-born residents:
- This state: 11,781
- Other state: 9,394
- Northeast: 485
- Midwest: 8,310
- South: 531
- West: 281
95.8% of Munster residents lived in the same house 1 years ago.
Out of people who lived in different houses, 37.1% lived in this county.
Out of people who lived in different counties, 37.6% lived in Indiana.
| Munster: | 95.8% |
| State average: | 87.1% |
Education attainment for males 25 years and older:
- No schooling: 40
- Nursery to 4th grade: 0
- 5th and 6th grade: 0
- 7th and 8th grade: 20
- 9th grade: 62
- 10th grade: 0
- 11th grade: 27
- 12th grade, no diploma: 147
- High school graduate (or equivalency): 2,206
- Less than 1 year of college: 310
- Some college more than 1 year, no degree: 985
- Associate degree: 656
- Bachelor's degree: 2,945
- Master's degree: 1,006
- Professional school degree: 262
- Doctorate degree: 167

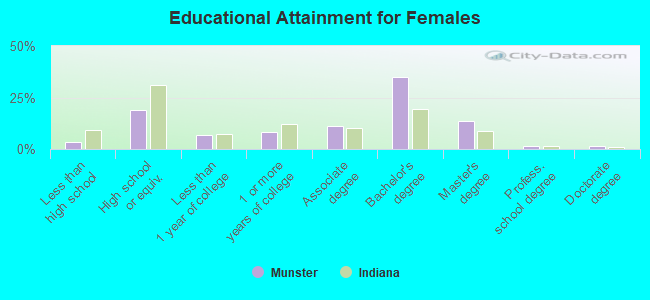
Education attainment for females 25 years and older:
- No schooling: 100
- Nursery to 4th grade: 44
- 5th and 6th grade: 7
- 7th and 8th grade: 11
- 9th grade: 38
- 10th grade: 12
- 11th grade: 36
- 12th grade, no diploma: 62
- High school graduate (or equivalency): 1,699
- Less than 1 year of college: 589
- Some college more than 1 year, no degree: 722
- Associate degree: 982
- Bachelor's degree: 3,139
- Master's degree: 1,231
- Professional school degree: 152
- Doctorate degree: 149
Housing units in structures:
- One, detached: 7,589
- One, attached: 688
- Two: 192
- 3 or 4: 241
- 5 to 9: 557
- 10 to 19: 284
- 20 to 49: 97
- 50 or more: 224
- Mobile homes: 1
Housing units lacking complete kitchen facilities in 2022: 1.9%
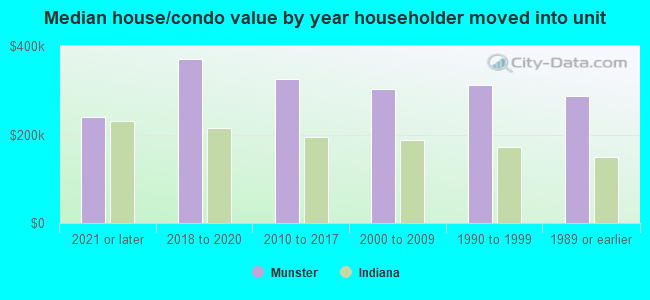
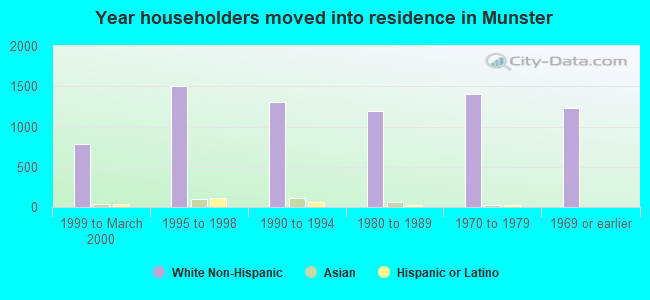
House/condo owner moved in on average 14 years ago
Renter moved in on average 6 years ago
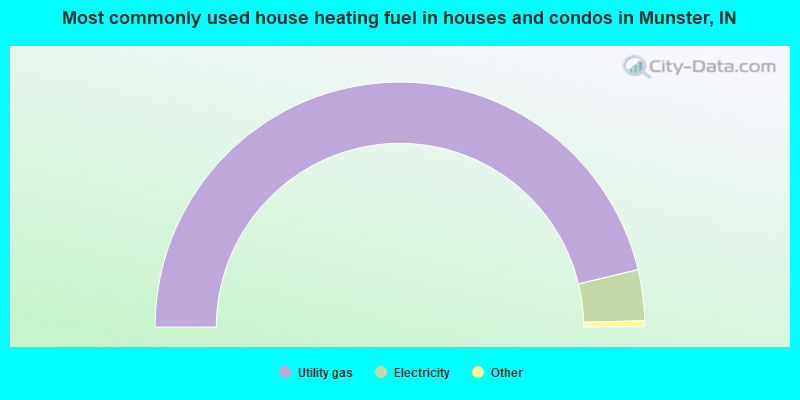
- 92.5%Utility gas
- 6.7%Electricity
- 0.4%Bottled, tank, or LP gas
- 0.4%Fuel oil, kerosene, etc.
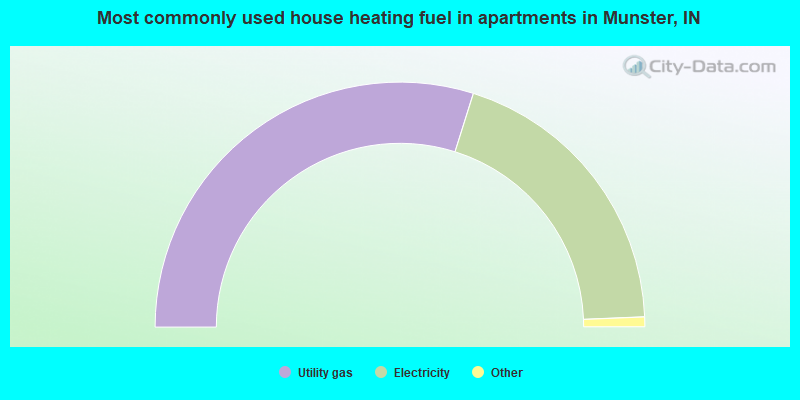
- 59.7%Utility gas
- 39.0%Electricity
- 0.6%Bottled, tank, or LP gas
- 0.6%Fuel oil, kerosene, etc.
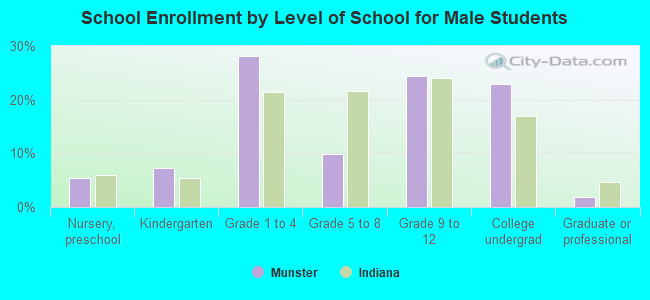
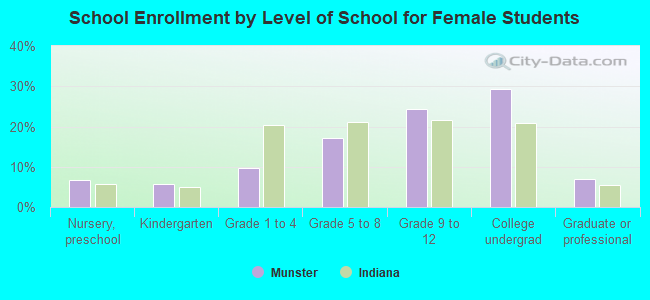
Private vs. public school enrollment:
| Here: | 16.0% |
| Indiana: | 14.9% |
| Here: | 6.3% |
| Indiana: | 11.4% |
| Here: | 10.3% |
| Indiana: | 22.3% |