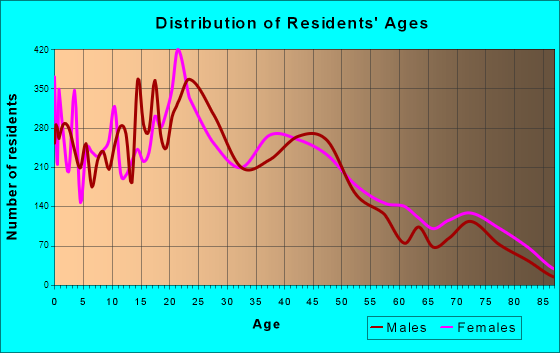
Murray, UT (Utah) Houses and Residents
Estimated median house or condo value in 2022: $505,749 (it was $151,200 in 2000 )
Murray:
$505,749Utah:
$499,500
Lower value quartile - upper value quartile: $374,977 - $655,352Mean price in 2022: Detached houses: $579,051 Here:
$579,051State:
$607,750
Townhouses or other attached units: $614,527 Here:
$614,527State:
$444,505
In 2-unit structures: $347,557 Here:
$347,557State:
$433,540
In 3-to-4-unit structures: $507,110 Here:
$507,110State:
$362,850
In 5-or-more-unit structures: $221,512 Here:
$221,512State:
$412,810
Mobile homes: $155,739 Here:
$155,739State:
$113,475
Total population: 48,822 (Urban population: 33,911, Rural population: 0)
Houses: 22,306 (21,085 occupied: 13,628 owner occupied, 7,328 renter occupied )
% of renters here:
35%State:
29%
Housing density: 2,322 houses/condos per square mile
Median price asked for vacant for-sale houses and condos in 2022: $611,490.
Median contract rent in 2022: $1,308 (lower quartile is $1,074, upper quartile is $1,691)
Median rent asked for vacant for-rent units in 2022: $1,445
Median gross rent in Murray, UT in 2022: $1,421
Housing units in Murray with a mortgage: 8,579 (1,174 second mortgage, 37 home equity loan, 943 both second mortgage and home equity loan )Houses without a mortgage: 331
Median household income for houses/condos with a mortgage: $120,768
Median household income for apartments without a mortgage: $70,933
Median monthly housing costs: $1,352
Data:
Median house or condo value ($)
Median house or condo value ($ change since 2000)
Median house or condo value ($) - White
Median house or condo value ($) - Black or African American
Median house or condo value ($) - Asian
Median house or condo value ($) - Hispanic or Latino
Median house or condo value ($) - American Indian and Alaska Native
Median house or condo value ($) - Multirace
Median house or condo value ($) - Other Race
Median price asked for mobile homes ($)
Household density (households per square mile)
Mean house or condo value by units in structure - 1, detached ($)
Mean house or condo value by units in structure - 1, attached ($)
Mean house or condo value by units in structure - 2 ($)
Mean house or condo value by units in structure by units in structure - 3 or 4 ($)
Mean house or condo value by units in structure - 5 or more ($)
Mean house or condo value by units in structure - Boat, RV, van, etc. ($)
Mean house or condo value by units in structure - Mobile home ($)
Median contract rent ($)
Median contract rent - Lower quartile ($)
Median contract rent - Upper quartile ($)
Median gross rent ($)
Urban houses (%)
Rural houses (%)
Houses occupied (%)
Houses occupied (% change since 2000)
Houses owner occupied (%)
Houses owner occupied (% change since 2000)
Houses renter occupied (%)
Houses renter occupied (% change since 2000)
Vacant housing units - For rent (%)
Vacant housing units - For rent (% change since 2000)
Vacant housing units - For sale only (%)
Vacant housing units - For sale only (% change since 2000)
Vacant housing units - Rented or sold, not occupied (%)
Vacant housing units - Rented or sold, not occupied (% change since 2000)
Vacant housing units - For seasonal, recreational, or occasional use (%)
Vacant housing units - For seasonal, recreational, or occasional use (% change since 2000)
Vacant housing units - For migrant workers (%)
Vacant housing units - For migrant workers (% change since 2000)
Vacant housing units - Other vacant (%)
Vacant housing units - Other vacant (% change since 2000)
Median monthly housing costs ($)
Median household income for houses/condos with a mortgage ($)
Median household income for houses/condos without a mortgage ($)
Median household income ($)
Median household income ($) - White
Median household income ($) - Black or African American
Median household income ($) - Asian
Median household income ($) - Hispanic or Latino
Median household income ($) - American Indian and Alaska Native
Median household income ($) - Multirace
Median household income ($) - Other Race
Mortgage status - with mortgage (%)
Mortgage status - with second mortgage (%)
Mortgage status - with home equity loan (%)
Mortgage status - with both second mortgage and home equity loan (%)
Mortgage status - without a mortgage (%)
Median year house/condo built
Median year apartment built
Household type by relationship - Male householder living alone (%)
Household type by relationship - Male householder not living alone (%)
Household type by relationship - Female householder living alone (%)
Household type by relationship - Female householder not living alone (%)
Household type by relationship - Opposite-Sex spouse (%)
Household type by relationship - Same-Sex spouse (%)
Household type by relationship - Opposite-Sex unmarried partner (%)
Household type by relationship - Same-Sex unmarried partner (%)
Household type by relationship - In group quarters (%)
Size of family households - 2-person household (%)
Size of family households - 3-person household (%)
Size of family households - 4-person household (%)
Size of family households - 5-person household (%)
Size of family households - 6-person household (%)
Size of family households - 7-or-more-person household (%)
Size of nonfamily households - 1-person household (%)
Size of nonfamily households - 2-person household (%)
Size of nonfamily households - 3-person household (%)
Size of nonfamily households - 4-person household (%)
Size of nonfamily households - 5-person household (%)
Size of nonfamily households - 6-person household (%)
Size of nonfamily households - 7-or-moreperson household (%)
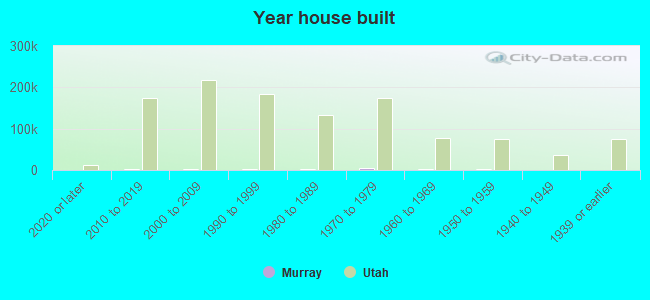
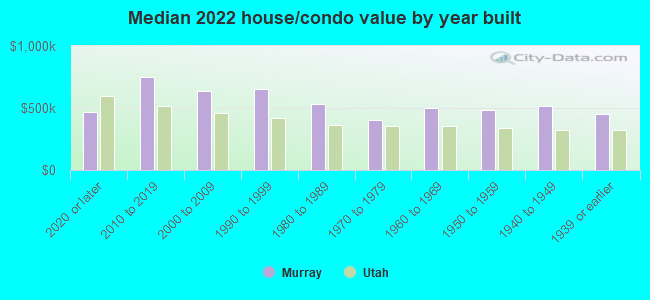
Year house built - Built 2010 or later (%)
Year house built - Built 2000 to 2009 (%)
Year house built - Built 1990 to 1999 (%)
Year house built - Built 1980 to 1989 (%)
Year house built - Built 1970 to 1979 (%)
Year house built - Built 1960 to 1969 (%)
Year house built - Built 1950 to 1959 (%)
Year house built - Built 1940 to 1949 (%)
Year house built - Built 1939 or earlier (%)
Median number of rooms in houses and condos
Median number of rooms in apartments
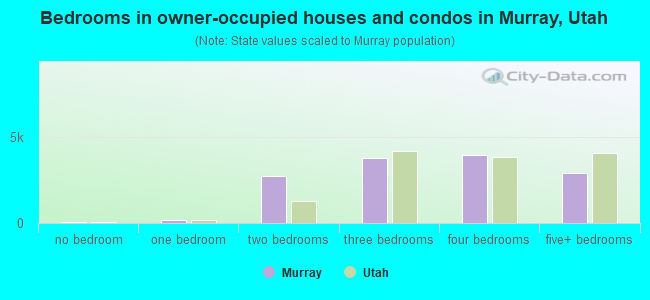
Median number of bedrooms in owner occupied houses
Mean number of bedrooms in owner occupied houses
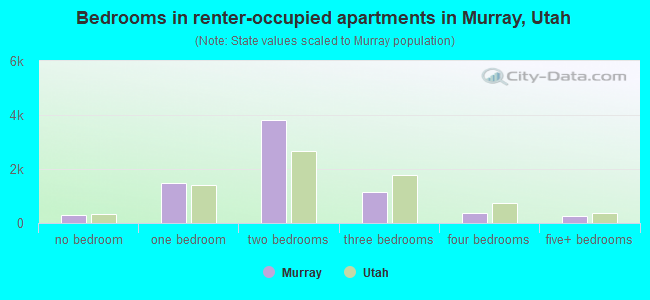
Median number of bedrooms in renter occupied houses
Mean number of bedrooms in renter occupied houses
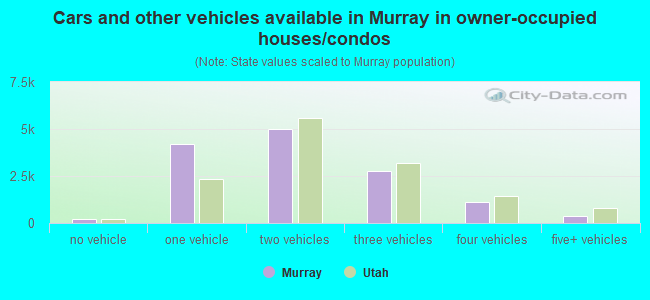
Median number of vehichles in owner occupied houses
Mean number of vehichles in owner occupied houses
Median number of vehichles in renter occupied houses
Mean number of vehichles in renter occupied houses
Rooms in owner-occupied houses - 1 room (%)
Rooms in owner-occupied houses - 2 rooms (%)
Rooms in owner-occupied houses - 3 rooms (%)
Rooms in owner-occupied houses - 4 rooms (%)
Rooms in owner-occupied houses - 5 rooms (%)
Rooms in owner-occupied houses - 6 rooms (%)
Rooms in owner-occupied houses - 7 rooms (%)
Rooms in owner-occupied houses - 8 rooms (%)
Rooms in owner-occupied houses - 9+ rooms (%)
Rooms in renter-occupied houses - 1 room (%)
Rooms in renter-occupied houses - 2 rooms (%)
Rooms in renter-occupied houses - 3 rooms (%)
Rooms in renter-occupied houses - 4 rooms (%)
Rooms in renter-occupied houses - 5 rooms (%)
Rooms in renter-occupied houses - 6 rooms (%)
Rooms in renter-occupied houses - 7 rooms (%)
Rooms in renter-occupied houses - 8 rooms (%)
Rooms in renter-occupied houses - 9+ rooms (%)
Bedrooms in owner-occupied houses - no bedrooms (%)
Bedrooms in owner-occupied houses - 1 bedroom (%)
Bedrooms in owner-occupied houses - 2 bedrooms (%)
Bedrooms in owner-occupied houses - 3 bedrooms (%)
Bedrooms in owner-occupied houses - 4 bedrooms (%)
Bedrooms in owner-occupied houses - 5+ bedrooms (%)
Bedrooms in renter-occupied houses - no bedrooms (%)
Bedrooms in renter-occupied houses - 1 bedroom (%)
Bedrooms in renter-occupied houses - 2 bedrooms (%)
Bedrooms in renter-occupied houses - 3 bedrooms (%)
Bedrooms in renter-occupied houses - 4 bedrooms (%)
Bedrooms in renter-occupied houses - 5+ bedrooms (%)
Vehicles available in owner-occupied houses - no vehicle available (%)
Vehicles available in owner-occupied houses - 1 vehicle available(%)
Vehicles available in owner-occupied houses - 2 Vehicles available (%)
Vehicles available in owner-occupied houses - 3 Vehicles available (%)
Vehicles available in owner-occupied houses - 4 Vehicles available (%)
Vehicles available in owner-occupied houses - 5+ Vehicles available (%)
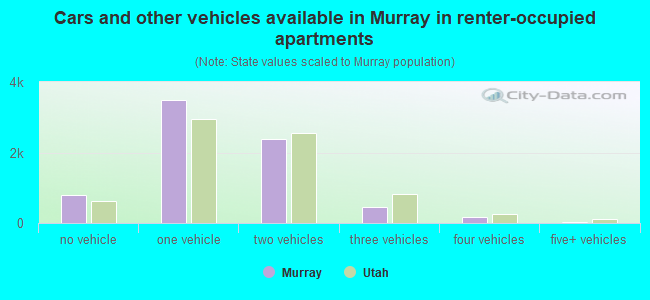
Vehicles available in renter-occupied houses - no vehicle available (%)
Vehicles available in renter-occupied houses - 1 vehicle available (%)
Vehicles available in renter-occupied houses - 2 Vehicles available (%)
Vehicles available in renter-occupied houses - 3 Vehicles available (%)
Vehicles available in renter-occupied houses - 4 Vehicles available (%)
Vehicles available in renter-occupied houses - 5+ Vehicles available (%)
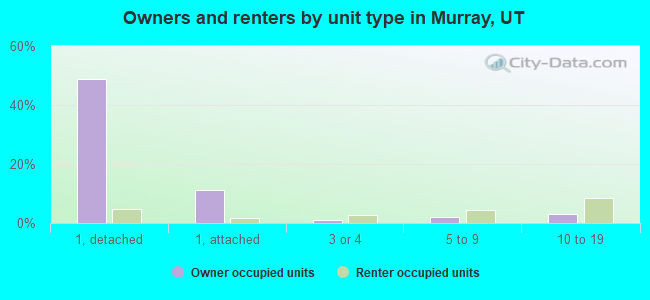
Housing units in structures - 1, detached (%)
Housing units in structures - 1, attached (%)
Housing units in structures - 2 (%)
Housing units in structures - 3 or 4 (%)
Housing units in structures - 5 to 9 (%)
Housing units in structures - 10 to 19 (%)
Housing units in structures - 20 to 49 (%)
Housing units in structures - 50 or more (%)
Housing units in structures - Mobile home (%)
Housing units in structures - Boat, RV, van, etc. (%)
Housing units in structures - Owners - 1, detached (%)
Housing units in structures - Owners - 1, attached (%)
Housing units in structures - Owners - 2 (%)
Housing units in structures - Owners - 3 or 4 (%)
Housing units in structures - Owners - 5 to 9 (%)
Housing units in structures - Owners - 10 to 19 (%)
Housing units in structures - Owners - 20 to 49 (%)
Housing units in structures - Owners - 50 or more (%)
Housing units in structures - Owners - Mobile home (%)
Housing units in structures - Owners - Boat, RV, van, etc. (%)
Housing units in structures - Renters - 1, detached (%)
Housing units in structures - Renters - 1, attached (%)
Housing units in structures - Renters - 2 (%)
Housing units in structures - Renters - 3 or 4 (%)
Housing units in structures - Renters - 5 to 9 (%)
Housing units in structures - Renters - 10 to 19 (%)
Housing units in structures - Renters - 20 to 49 (%)
Housing units in structures - Renters - 50 or more (%)
Housing units in structures - Renters - Mobile home (%)
Housing units in structures - Renters - Boat, RV, van, etc. (%)
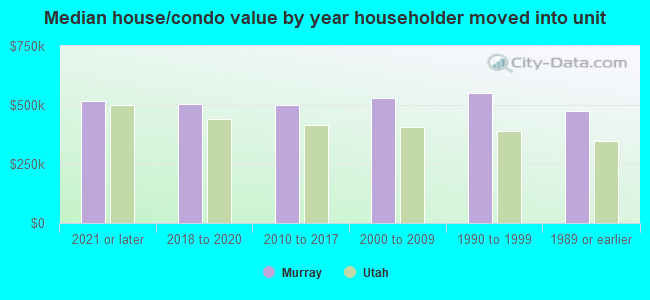
House/condo owner moved in on average (years ago)
Renter moved in on average (years ago)
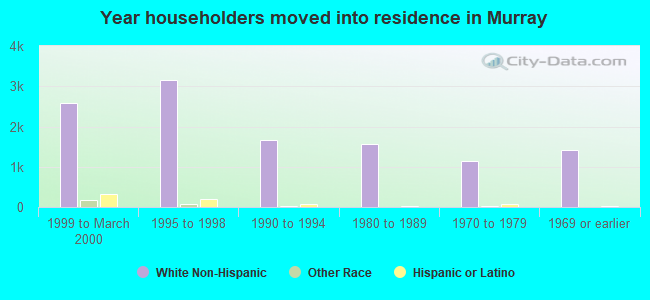
Year householder moved into unit - Moved in 1999 to March 2000 (%)
Year householder moved into unit - Moved in 1999 to March 2000 (%) - White
Year householder moved into unit - Moved in 1999 to March 2000 (%) - Black or African American
Year householder moved into unit - Moved in 1999 to March 2000 (%) - Asian
Year householder moved into unit - Moved in 1999 to March 2000 (%) - Hispanic or Latino
Year householder moved into unit - Moved in 1999 to March 2000 (%) - American Indian and Alaska Native
Year householder moved into unit - Moved in 1999 to March 2000 (%) - Multirace
Year householder moved into unit - Moved in 1999 to March 2000 (%) - Other Race
Year householder moved into unit - Moved in 1995 to 1998 (%)
Year householder moved into unit - Moved in 1995 to 1998 (%) - White
Year householder moved into unit - Moved in 1995 to 1998 (%) - Black or African American
Year householder moved into unit - Moved in 1995 to 1998 (%) - Asian
Year householder moved into unit - Moved in 1995 to 1998 (%) - Hispanic or Latino
Year householder moved into unit - Moved in 1995 to 1998 (%) - American Indian and Alaska Native
Year householder moved into unit - Moved in 1995 to 1998 (%) - Multirace
Year householder moved into unit - Moved in 1995 to 1998 (%) - Other Race
Year householder moved into unit - Moved in 1990 to 1994 (%)
Year householder moved into unit - Moved in 1990 to 1994 (%) - White
Year householder moved into unit - Moved in 1990 to 1994 (%) - Black or African American
Year householder moved into unit - Moved in 1990 to 1994 (%) - Asian
Year householder moved into unit - Moved in 1990 to 1994 (%) - Hispanic or Latino
Year householder moved into unit - Moved in 1990 to 1994 (%) - American Indian and Alaska Native
Year householder moved into unit - Moved in 1990 to 1994 (%) - Multirace
Year householder moved into unit - Moved in 1990 to 1994 (%) - Other Race
Year householder moved into unit - Moved in 1980 to 1989 (%)
Year householder moved into unit - Moved in 1980 to 1989 (%) - White
Year householder moved into unit - Moved in 1980 to 1989 (%) - Black or African American
Year householder moved into unit - Moved in 1980 to 1989 (%) - Asian
Year householder moved into unit - Moved in 1980 to 1989 (%) - Hispanic or Latino
Year householder moved into unit - Moved in 1980 to 1989 (%) - American Indian and Alaska Native
Year householder moved into unit - Moved in 1980 to 1989 (%) - Multirace
Year householder moved into unit - Moved in 1980 to 1989 (%) - Other Race
Year householder moved into unit - Moved in 1970 to 1979 (%)
Year householder moved into unit - Moved in 1970 to 1979 (%) - White
Year householder moved into unit - Moved in 1970 to 1979 (%) - Black or African American
Year householder moved into unit - Moved in 1970 to 1979 (%) - Asian
Year householder moved into unit - Moved in 1970 to 1979 (%) - Hispanic or Latino
Year householder moved into unit - Moved in 1970 to 1979 (%) - American Indian and Alaska Native
Year householder moved into unit - Moved in 1970 to 1979 (%) - Multirace
Year householder moved into unit - Moved in 1970 to 1979 (%) - Other Race
Year householder moved into unit - Moved in 1969 or earlier (%)
Year householder moved into unit - Moved in 1969 or earlier (%) - White
Year householder moved into unit - Moved in 1969 or earlier (%) - Black or African American
Year householder moved into unit - Moved in 1969 or earlier (%) - Asian
Year householder moved into unit - Moved in 1969 or earlier (%) - Hispanic or Latino
Year householder moved into unit - Moved in 1969 or earlier (%) - American Indian and Alaska Native
Year householder moved into unit - Moved in 1969 or earlier (%) - Multirace
Year householder moved into unit - Moved in 1969 or earlier (%) - Other Race
Housing units lacking complete plumbing facilities (%)
Housing units lacking complete kitchen facilities (%)
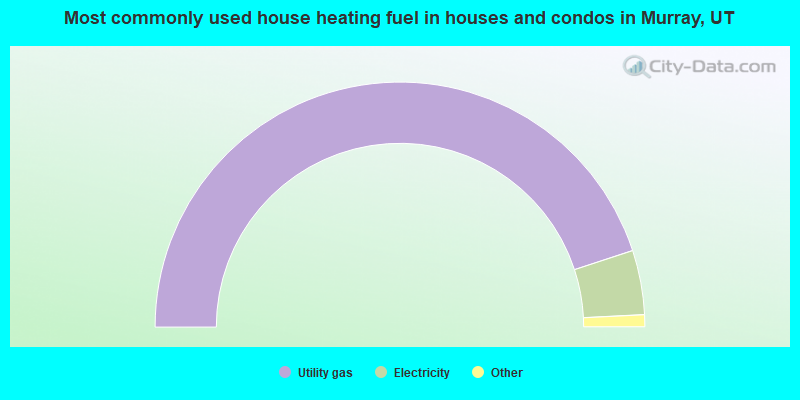
House heating fuel used in houses and condos - Utility gas (%)
House heating fuel used in houses and condos - Bottled, tank, or LP gas (%)
House heating fuel used in houses and condos - Electricity (%)
House heating fuel used in houses and condos - Fuel oil, kerosene, etc. (%)
House heating fuel used in houses and condos - Coal or coke (%)
House heating fuel used in houses and condos - Wood (%)
House heating fuel used in houses and condos - Solar energy (%)
House heating fuel used in houses and condos - Other fuel (%)
House heating fuel used in houses and condos - No fuel used (%)
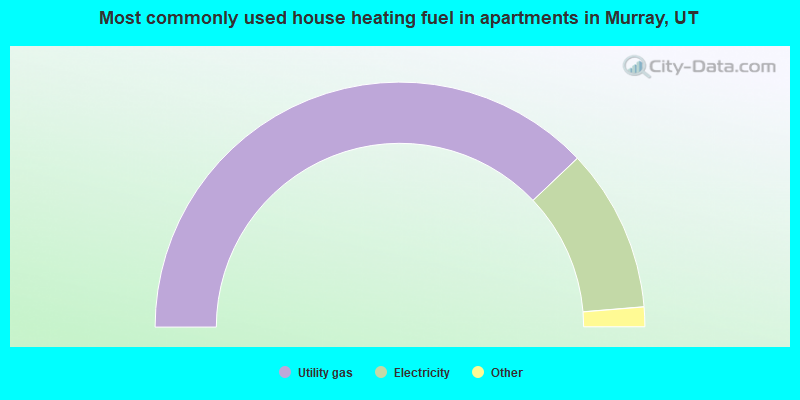
House heating fuel used in apartments - Utility gas (%)
House heating fuel used in apartments - Bottled, tank, or LP gas (%)
House heating fuel used in apartments - Electricity (%)
House heating fuel used in apartments - Fuel oil, kerosene, etc. (%)
House heating fuel used in apartments - Coal or coke (%)
House heating fuel used in apartments - Wood (%)
House heating fuel used in apartments - Solar energy (%)
House heating fuel used in apartments - Other fuel (%)
House heating fuel used in apartments - No fuel used (%)
Latest news about housing in Murray, UT collected exclusively by city-data.com from local newspapers, TV, and radio stations
Median year house/condo built: 1975Median year apartment built: 1984Household type by relationship:
Households: 50,278
Male householders: 10,321 (2,604 living alone ), Female householders: 9,908 (3,838 living alone )9,349 spouses (9,223 opposite-sex spouses ), 1,560 unmarried partners , (1,517 opposite-sex unmarried partners ), 12,875 children (11,846 natural , 482 adopted , 547 stepchildren ), 890 grandchildren , 626 brothers or sisters , 711 parents , 29 foster children , 1,305 other relatives , 2,429 non-relatives In group quarters: 270
Size of family households: 5,570 2-persons , 3,211 3-persons , 1,995 4-persons , 914 5-persons , 440 6-persons , 417 7-or-more-persons .
Size of nonfamily households: 6,517 1-person , 1,421 2-persons , 399 3-persons , 95 4-persons , 93 5-persons , 8 6-persons .
6,655 married couples with children. single-parent households (767 men , 1,251 women ).
85.6% of residents of Murray speak English at home. of residents speak Spanish at home (62% speak English very well , 28% speak English well , 9% speak English not well , 1% don't speak English at all ).of residents speak other Indo-European language at home (84% speak English very well , 10% speak English well , 5% speak English not well ).of residents speak Asian or Pacific Island language at home (64% speak English very well , 24% speak English well , 8% speak English not well , 3% don't speak English at all ).of residents speak other language at home (92% speak English very well , 5% speak English well , 3% speak English not well ).
Foreign born population: 5,159 (10.3%)of them are naturalized citizens )
Median number of rooms in houses and condos:
Median number of rooms in apartments
Owner-occupied Renter-occupied
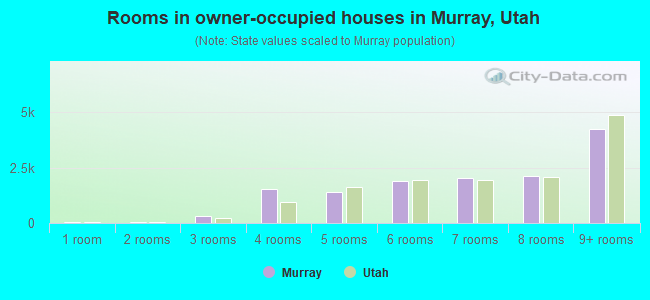
Rooms in owner-occupied houses in Murray, Utah
50 1 room 46 2 rooms 328 3 rooms 1,529 4 rooms 1,402 5 rooms 1,887 6 rooms 2,017 7 rooms 2,135 8 rooms 4,235 9+ rooms
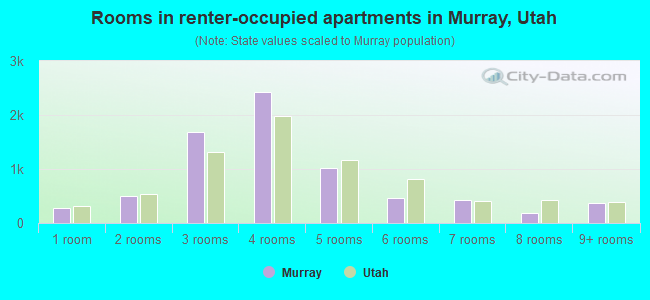
Rooms in renter-occupied apartments in Murray, Utah
278 1 room 492 2 rooms 1,689 3 rooms 2,423 4 rooms 1,011 5 rooms 456 6 rooms 420 7 rooms 186 8 rooms 373 9+ rooms
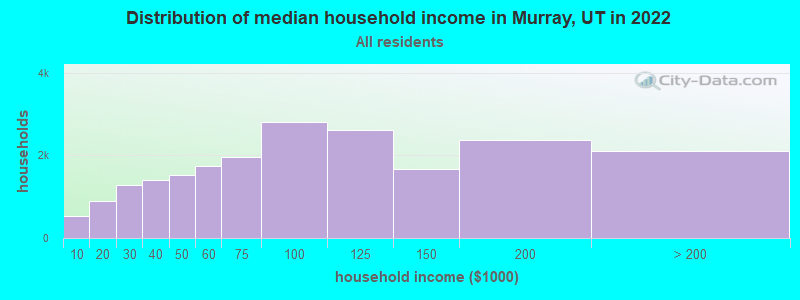
Murray, UT household income distribution 533 Less than $10,000899 $10,000 to $19,9991,279 $20,000 to $29,9991,415 $30,000 to $39,9991,514 $40,000 to $49,9991,752 $50,000 to $59,9991,955 $60,000 to $74,9992,806 $75,000 to $99,9992,609 $100,000 to $124,9991,657 $125,000 to $149,9992,378 $150,000 to $199,9992,100 $200,000 or more
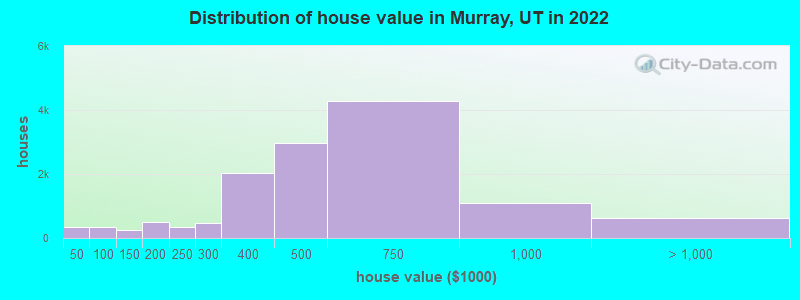
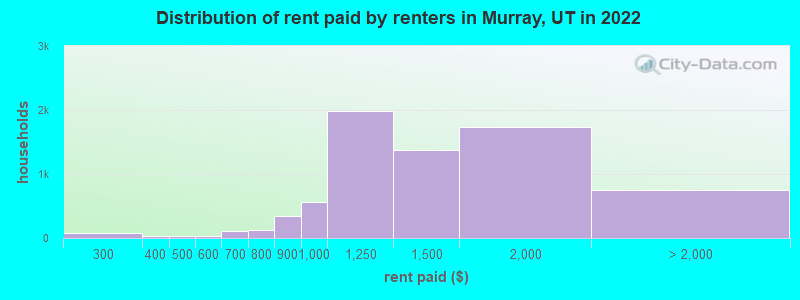
Home value of owner - occupied houses in 2022 in Murray, UT 154 Less than $10,0002 $10,000 to $14,99915 $15,000 to $19,99926 $25,000 to $29,99935 $30,000 to $34,9997 $35,000 to $39,99990 $40,000 to $49,999111 $50,000 to $59,9998 $70,000 to $79,99952 $80,000 to $89,99966 $90,000 to $99,999116 $100,000 to $124,999124 $125,000 to $149,99979 $150,000 to $174,999406 $175,000 to $199,999328 $200,000 to $249,999479 $250,000 to $299,9992,023 $300,000 to $399,9992,963 $400,000 to $499,9994,287 $500,000 to $749,9991,102 $750,000 to $999,999281 $1,000,000 to $1,499,99984 $1,500,000 to $1,999,999250 $2,000,000 or moreRent paid by renters in 2022 in Murray, UT 14 $150 to $19954 $200 to $24924 $250 to $29931 $300 to $3493 $350 to $3992 $400 to $44933 $450 to $49914 $500 to $54915 $550 to $599104 $600 to $6496 $650 to $69941 $700 to $74981 $750 to $799342 $800 to $899558 $900 to $9991,979 $1,000 to $1,2491,377 $1,250 to $1,4991,738 $1,500 to $1,999313 $2,000 to $2,499202 $2,500 to $2,99948 $3,000 to $3,49975 $3,500 or more112 No cash rent
Percentage of workers working in this county: 93.9%Number of people working at home: 6,321 (22.0% of all workers )
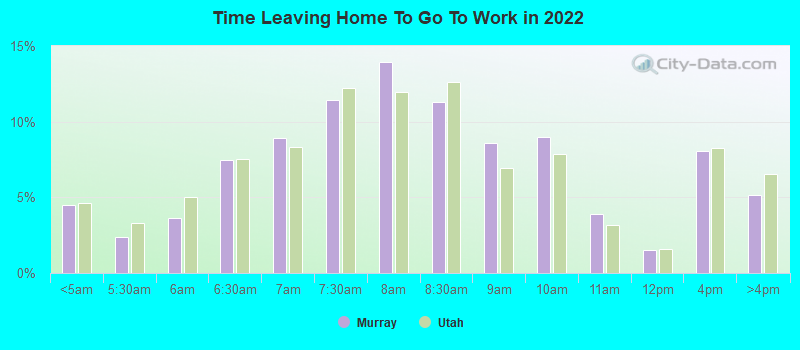
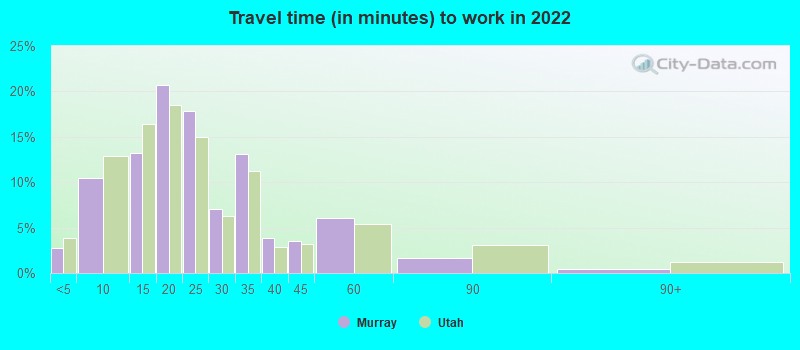
Travel time to work (commute)
Less than 5 minutes: 8265 to 9 minutes: 2,45010 to 14 minutes: 3,67815 to 19 minutes: 4,45320 to 24 minutes: 4,40125 to 29 minutes: 2,12330 to 34 minutes: 2,39735 to 39 minutes: 21540 to 44 minutes: 64945 to 59 minutes: 79360 to 89 minutes: 33490 or more minutes: 259
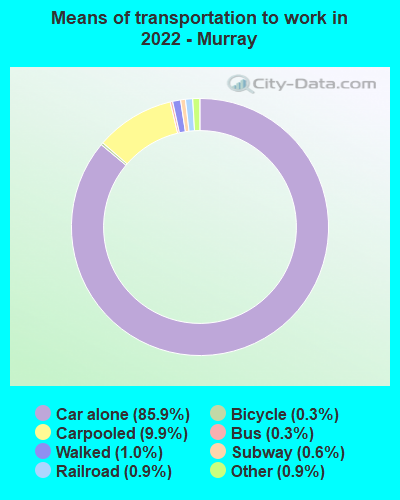
Means of transportation to work:
Drove a car alone: 30,043 (72.5%)Carpooled: 3,734 (9.0%)Bus : 84 (0.2%)Subway or elevated rail : 15 (0.0%)Long-distance train or commuter rail : 127 (0.3%)Light rail, streetcar or trolley : 239 (0.6%)Ferryboat: 8 (0.0%)Taxi: 323 (0.8%)Bicycle: 102 (0.2%)Walked: 360 (0.9%)Worked at home: 6,321 (15.2%)
Unemployment by race in 2022
Unemployment rate for White non-Hispanic residents 2.4% Males1.8% FemalesUnemployment rate for Black residents 18.5% FemalesUnemployment rate for Asian residents 4.5% Males1.1% FemalesUnemployment rate for other race residents 1.2% MalesUnemployment rate for two or more race residents 1.6% Males4.0% FemalesUnemployment rate for Hispanic or Latino residents 4.1% Males3.1% Females
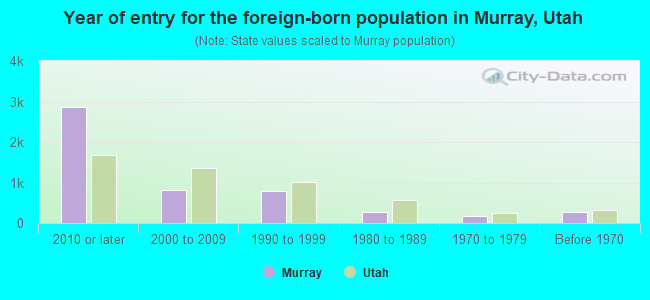
Year of entry for the foreign-born population in Murray, Utah
2,876 2010 or later 820 2000 to 2009 801 1990 to 1999 275 1980 to 1989 164 1970 to 1979 266 Before 1970
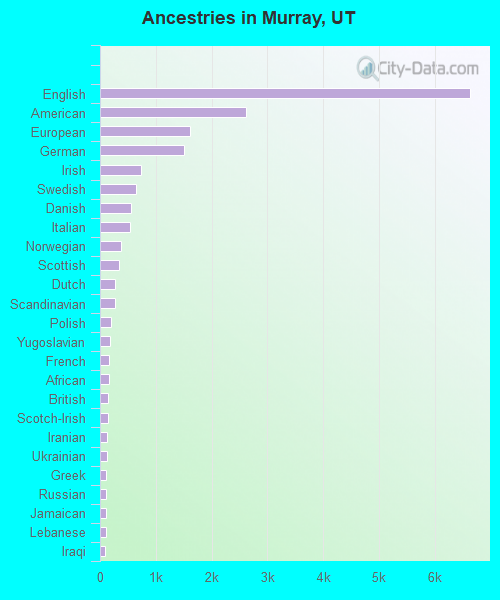
First ancestries reported:
English: 6,640 (25.9%)
American: 2,616 (10.2%)
European: 1,618 (6.3%)
German: 1,499 (5.8%)
Irish: 729 (2.8%)
Swedish: 654 (2.6%)
Danish: 555 (2.2%)
Italian: 533 (2.1%)
Norwegian: 371 (1.4%)
Scottish: 341 (1.3%)
Dutch: 275 (1.1%)
Scandinavian: 264 (1.0%)
Polish: 193 (0.8%)
Yugoslavian: 178 (0.7%)
French: 161 (0.6%)
African: 153 (0.6%)
British: 148 (0.6%)
Scotch-Irish: 136 (0.5%)
Iranian: 130 (0.5%)
Ukrainian: 117 (0.5%)
Greek: 109 (0.4%)
Russian: 106 (0.4%)
Jamaican: 104 (0.4%)
Lebanese: 100 (0.4%)
Iraqi: 95 (0.4%)
Northern European: 73 (0.3%)
Canadian: 52 (0.2%)
Afghan: 47 (0.2%)
Welsh: 46 (0.2%)
Belgian: 42 (0.2%)
Hungarian: 42 (0.2%)
Swiss: 40 (0.2%)
French Canadian: 35 (0.1%)
Czech: 33 (0.1%)
Finnish: 30 (0.1%)
Haitian: 26 (0.1%)
Armenian: 23 (0.09%)
Nigerian: 21 (0.08%)
Slavic: 20 (0.08%)
Ghanaian: 17 (0.07%)
Portuguese: 17 (0.07%)
Eastern European: 14 (0.05%)
Brazilian: 12 (0.05%)
Icelander: 12 (0.05%)
Croatian: 11 (0.04%)
Serbian: 10 (0.04%)
Macedonian: 10 (0.04%)
Romanian: 6 (0.02%)
Basque: 6 (0.02%)
Turkish: 4 (0.02%)
Most common places of birth for foreign-born residents (%): India Murray:
11.3% (587)Utah:
3.0% (8,294)
Mexico Murray:
11.1% (577)Utah:
36.1% (99,740)
Venezuela Murray:
9.1% (473)Utah:
3.2% (8,804)
Brazil Murray:
6.1% (318)Utah:
2.8% (7,644)
China, excluding Hong Kong and Taiwan Murray:
5.1% (265)Utah:
2.9% (8,017)
Chile Murray:
4.4% (229)Utah:
1.3% (3,479)
Peru Murray:
4.1% (215)Utah:
2.9% (7,901)
Spain Murray:
3.7% (194)Utah:
0.5% (1,315)
Colombia Murray:
3.6% (187)Utah:
2.0% (5,555)
Iraq Murray:
3.3% (173)Utah:
0.6% (1,700)
Vietnam Murray:
3.1% (160)Utah:
2.6% (7,211)
Oceania, n.e.c. Murray:
3.1% (159)Utah:
2.7% (7,472)
Korea Murray:
2.7% (139)Utah:
1.6% (4,524)
Japan Murray:
2.3% (121)Utah:
0.7% (2,014)
Jamaica Murray:
2.2% (115)Utah:
0.2% (527)
Canada Murray:
2.0% (104)Utah:
3.0% (8,341)
Germany Murray:
1.8% (93)Utah:
1.5% (4,247)
Iran Murray:
1.8% (93)Utah:
0.8% (2,137)
Uzbekistan Murray:
1.5% (80)Utah:
0.0% (124)
Place of birth for U.S.-born residents:
This state: 30,270Other state: 14,124Northeast: 1,425Midwest: 2,706South: 2,492West: 7,468 85.5% of Murray residents lived in the same house 1 years ago.
Out of people who lived in different houses, 40.8% lived in this county.
Out of people who lived in different counties, 49.8% lived in Utah.
Murray:
85.5%State average:
85.7%
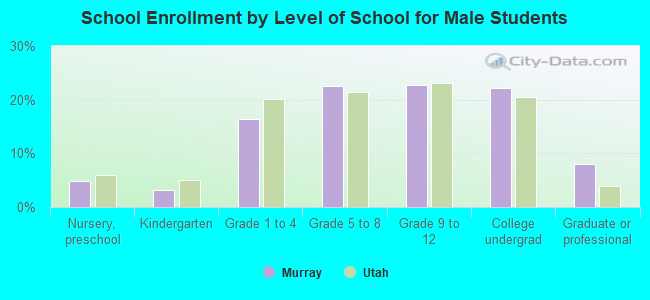
Education attainment for males 25 years and older:
No schooling: 231Nursery to 4th grade: 95th and 6th grade: 417th and 8th grade: 329th grade: 2710th grade: 7211th grade: 7412th grade, no diploma: 297High school graduate (or equivalency): 4,114Less than 1 year of college: 1,233Some college more than 1 year, no degree: 2,974Associate degree: 1,741Bachelor's degree: 4,337Master's degree: 1,873Professional school degree: 470Doctorate degree: 264
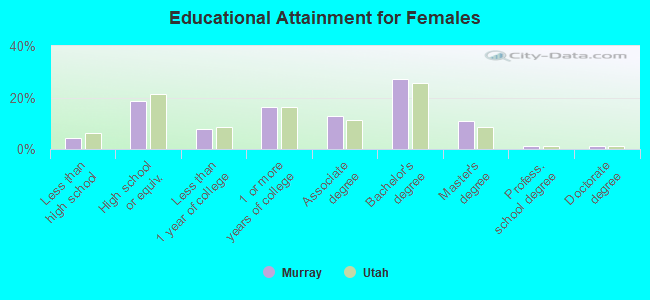
Education attainment for females 25 years and older:
No schooling: 156Nursery to 4th grade: 405th and 6th grade: 317th and 8th grade: 829th grade: 910th grade: 20911th grade: 6812th grade, no diploma: 196High school graduate (or equivalency): 3,391Less than 1 year of college: 1,397Some college more than 1 year, no degree: 2,929Associate degree: 2,317Bachelor's degree: 4,894Master's degree: 1,932Professional school degree: 181Doctorate degree: 202
Housing units in structures:
One, detached: 11,435One, attached: 2,469Two: 2783 or 4: 1,2285 to 9: 1,52010 to 19: 2,41520 to 49: 1,32150 or more: 1,344Mobile homes: 257Boats, RVs, vans, etc.: 34Median worth of mobile homes: $132,522
Housing units lacking complete plumbing facilities in 2022: 0.3%Housing units lacking complete kitchen facilities in 2022: 0.7%House/condo owner moved in on average 14 years ago
Renter moved in on average 3 years ago
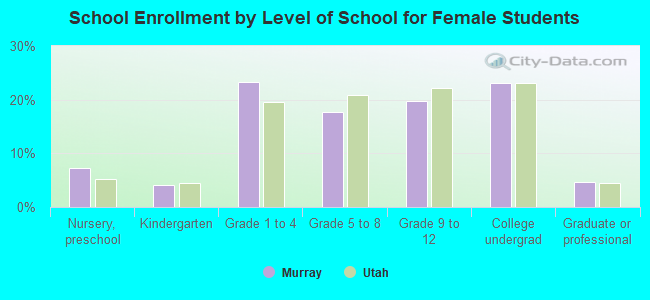
Private vs. public school enrollment:
Students in private schools in grades 1 to 8 (elementary and middle school): 363 Students in private schools in grades 9 to 12 (high school): 156 Students in private undergraduate colleges: 472