Jump to a detailed profile or search site with Google Custom Search

Murrieta, CA (California) Houses and Residents

Estimated median house or condo value in 2022: $648,600 (it was $190,300 in 2000)
Murrieta:

$648,600
California:

$715,900
Lower value quartile - upper value quartile: $541,800 - $765,400

Mean price in 2022:

Detached houses: $683,383
Here:

$683,383
State:

$988,808

Townhouses or other attached units: $622,226
Here:

$622,226
State:

$838,546

In 3-to-4-unit structures: $838,558
Here:

$838,558
State:

$824,253

In 5-or-more-unit structures: $359,849
Here:

$359,849
State:

$730,996

Mobile homes: $334,888
Here:

$334,888
State:

$184,506

Total population: 108,368 (Urban population: 42,402, Rural population: 1,948 (all nonfarm))

Houses: 37,558 (36,610 occupied: 26,394 owner occupied, 10,216 renter occupied)

% of renters here:

28%
State:

44%

Housing density: 1,323 houses/condos per square mile

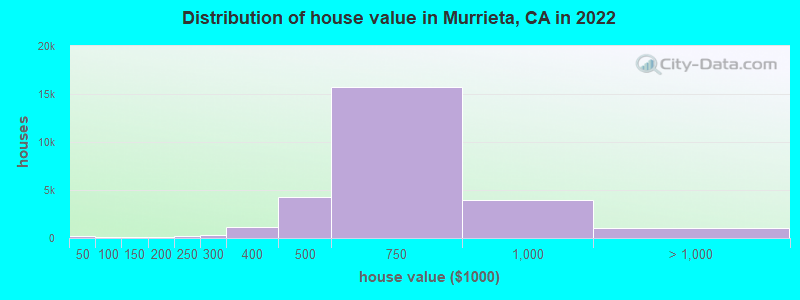
Median price asked for vacant for-sale houses and condos in 2022: $570,044.

Median contract rent in 2022: $1,905 (lower quartile is $1,579, upper quartile is over $2,000)


Median rent asked for vacant for-rent units in 2022: $3,465


Median gross rent in Murrieta, CA in 2022: over $2,000

Housing units in Murrieta with a mortgage: 19,469 (1,163 second mortgage, 0 home equity loan, 940 both second mortgage and home equity loan)
Houses without a mortgage: 192

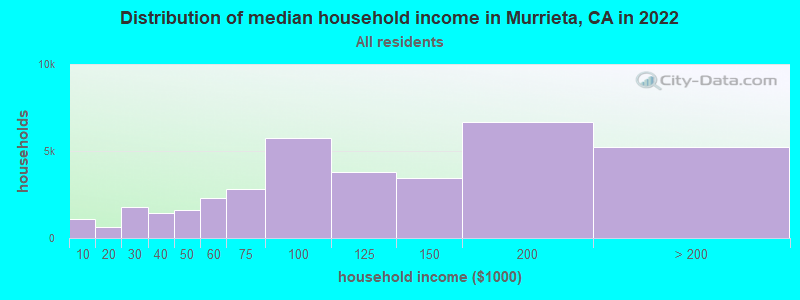
Median household income for houses/condos with a mortgage: $142,621

Median household income for apartments without a mortgage: $92,381

Median monthly housing costs: $2,256

Compare current foreclosures in Murrieta, CA:

Check out more offers in Murrieta, CA.
Powered by Foreclosure.com

Settings
X
Data:
Loading data...
Based on 2000-2022 data
Loading data...

123
Hide US histogram

Latest news about housing in Murrieta, CA collected exclusively by city-data.com from local newspapers, TV, and radio stations

Murrieta, California Age and Sex of Residents
Median year house/condo built: 2001

Median year apartment built: 1998

Household type by relationship:

Households: 113,774
  • Male householders: 19,741 (3,060 living alone), Female householders: 16,869 (3,916 living alone)
  • 20,488 spouses (20,369 opposite-sex spouses), 2,502 unmarried partners, (2,502 opposite-sex unmarried partners), 42,634 children (39,115 natural, 984 adopted, 2,535 stepchildren), 2,824 grandchildren, 1,042 brothers or sisters, 2,704 parents, 0 foster children, 2,051 other relatives, 2,105 non-relatives
  • In group quarters: 814

Size of family households: 9,053 2-persons, 6,798 3-persons, 5,705 4-persons, 3,877 5-persons, 1,656 6-persons, 912 7-or-more-persons.

Size of nonfamily households: 6,976 1-person, 1,187 2-persons, 313 3-persons, 133 4-persons.

20,799 married couples with children.
6,977 single-parent households (1,787 men, 5,190 women).

73.6% of residents of Murrieta speak English at home.
17.5% of residents speak Spanish at home (74% speak English very well, 17% speak English well, 7% speak English not well, 2% don't speak English at all).
1.7% of residents speak other Indo-European language at home (86% speak English very well, 8% speak English well, 6% speak English not well, 1% don't speak English at all).
5.7% of residents speak Asian or Pacific Island language at home (51% speak English very well, 34% speak English well, 11% speak English not well, 4% don't speak English at all).
1.3% of residents speak other language at home (52% speak English very well, 33% speak English well, 15% speak English not well).

Foreign born population: 19,833 (17.4%)
(71.8% of them are naturalized citizens)

Median number of rooms in houses and condos:
Here:

7.0
State:

6.0

Median number of rooms in apartments
Here:

4.6
State:

3.9

Owner-occupied Renter-occupied
Bedrooms in owner-occupied houses and condos in Murrieta, California
  • Bedrooms in owner-occupied houses and condos in Murrieta, California
  • 46no bedroom
  • 471 bedroom
  • 2,4552 bedrooms
  • 9,2573 bedrooms
  • 9,1384 bedrooms
  • 5,4515+ bedrooms
Bedrooms in renter-occupied apartments in Murrieta, California
  • Bedrooms in renter-occupied apartments in Murrieta, California
  • 408no bedroom
  • 1,9091 bedroom
  • 3,2622 bedrooms
  • 2,6073 bedrooms
  • 1,5064 bedrooms
  • 5245+ bedrooms
Owner-occupied Renter-occupied
Cars and other vehicles available in Murrieta in owner-occupied houses/condos
  • Cars and other vehicles available in Murrieta in owner-occupied houses/condos
  • 999no vehicle
  • 4,4091 vehicle
  • 10,0272 vehicles
  • 6,8823 vehicles
  • 3,0494 vehicles
  • 1,0285+ vehicles
Cars and other vehicles available in Murrieta in renter-occupied apartments
  • Cars and other vehicles available in Murrieta in renter-occupied apartments
  • 278no vehicle
  • 3,7961 vehicle
  • 3,4972 vehicles
  • 1,8933 vehicles
  • 6984 vehicles
  • 545+ vehicles
Owner-occupied Renter-occupied
Rooms in owner-occupied houses in Murrieta, California
  • Rooms in owner-occupied houses in Murrieta, California
  • 461 room
  • 02 rooms
  • 3663 rooms
  • 1,2174 rooms
  • 3,9765 rooms
  • 4,6226 rooms
  • 5,4607 rooms
  • 4,4898 rooms
  • 6,2189+ rooms
Rooms in renter-occupied apartments in Murrieta, California
  • Rooms in renter-occupied apartments in Murrieta, California
  • 3621 room
  • 6732 rooms
  • 1,6573 rooms
  • 2,2664 rooms
  • 1,1145 rooms
  • 1,2356 rooms
  • 1,8717 rooms
  • 5238 rooms
  • 5159+ rooms
Year house built
Median 2022 house/condo value by year built
Median house/condo value by year householder moved into unit
Breakdown of mean house values by ages of householders
Owners and renters by unit type in Murrieta, CA
  • Murrieta, CA household income distribution

  • Distribution of median household income in Murrieta, CA in 2022
  • 1,070Less than $10,000
  • 629$10,000 to $19,999
  • 1,797$20,000 to $29,999
  • 1,418$30,000 to $39,999
  • 1,633$40,000 to $49,999
  • 2,304$50,000 to $59,999
  • 2,836$60,000 to $74,999
  • 5,768$75,000 to $99,999
  • 3,803$100,000 to $124,999
  • 3,436$125,000 to $149,999
  • 6,677$150,000 to $199,999
  • 5,239$200,000 or more
  • Home value of owner - occupied houses in 2022 in Murrieta, CA

  • Distribution of house value in Murrieta, CA in 2022
  • 109Less than $10,000
  • 15$15,000 to $19,999
  • 9$20,000 to $24,999
  • 49$40,000 to $49,999
  • 67$50,000 to $59,999
  • 2$60,000 to $69,999
  • 24$70,000 to $79,999
  • 10$80,000 to $89,999
  • 31$100,000 to $124,999
  • 74$125,000 to $149,999
  • 57$150,000 to $174,999
  • 41$175,000 to $199,999
  • 179$200,000 to $249,999
  • 308$250,000 to $299,999
  • 1,113$300,000 to $399,999
  • 4,259$400,000 to $499,999
  • 15,766$500,000 to $749,999
  • 3,937$750,000 to $999,999
  • 674$1,000,000 to $1,499,999
  • 173$1,500,000 to $1,999,999
  • 209$2,000,000 or more
  • Rent paid by renters in 2022 in Murrieta, CA

  • Distribution of rent paid by renters in Murrieta, CA in 2022
  • 33$100 to $149
  • 57$350 to $399
  • 16$400 to $449
  • 166$500 to $549
  • 82$650 to $699
  • 152$700 to $749
  • 77$750 to $799
  • 114$800 to $899
  • 121$900 to $999
  • 662$1,000 to $1,249
  • 743$1,250 to $1,499
  • 3,744$1,500 to $1,999
  • 3,477$2,000 to $2,499
  • 1,929$2,500 to $2,999
  • 338$3,500 or more
  • 339No cash rent
Time Leaving Home To Go To Work in 2022

Percentage of workers working in this county: 78.0%
Number of people working at home: 8,760 (16.7% of all workers)

Travel time (in minutes) to work in 2022

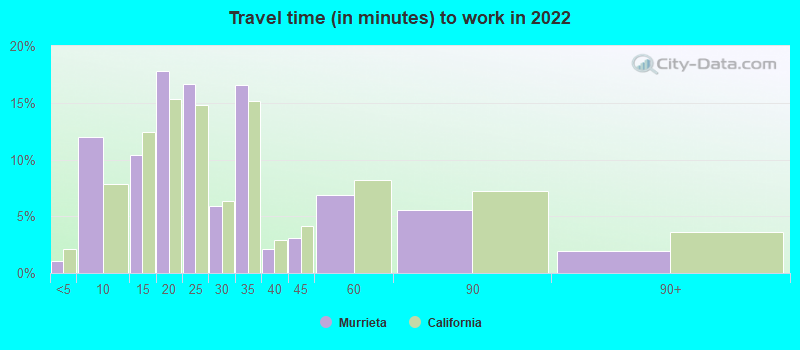
Travel time to work (commute)

  • Less than 5 minutes: 132
  • 5 to 9 minutes: 4,036
  • 10 to 14 minutes: 5,289
  • 15 to 19 minutes: 8,805
  • 20 to 24 minutes: 5,033
  • 25 to 29 minutes: 1,302
  • 30 to 34 minutes: 2,422
  • 35 to 39 minutes: 1,031
  • 40 to 44 minutes: 1,315
  • 45 to 59 minutes: 4,725
  • 60 to 89 minutes: 7,435
  • 90 or more minutes: 2,088
Means of transportation to work in 2022 - Murrieta

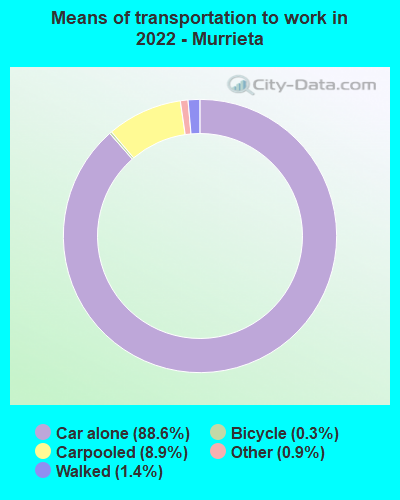
Means of transportation to work:

  • Drove a car alone: 26,941 (69.6%)
  • Carpooled: 2,934 (7.6%)
  • Taxi: 280 (0.7%)
  • Bicycle: 110 (0.3%)
  • Walked: 412 (1.1%)
  • Worked at home: 8,760 (22.6%)
Class of Workers in 2022
  • Unemployment by race in 2022
  • Unemployment rate for White non-Hispanic residents
  • 6.6%Males
  • 6.8%Females
  • Unemployment rate for Black residents
  • 3.3%Males
  • 4.8%Females
  • Unemployment rate for American Indian and Alaska Native residents
  • 9.1%Males
  • 3.6%Females
  • Unemployment rate for Asian residents
  • 11.2%Males
  • 5.7%Females
  • Unemployment rate for other race residents
  • 6.4%Males
  • 5.0%Females
  • Unemployment rate for two or more race residents
  • 3.5%Males
  • 8.3%Females
  • Unemployment rate for Hispanic or Latino residents
  • 4.1%Males
  • 3.5%Females
Year of entry for the foreign-born population in Murrieta, California
  • Year of entry for the foreign-born population in Murrieta, California
  • 4,0002010 or later
  • 3,3502000 to 2009
  • 3,3541990 to 1999
  • 8531980 to 1989
  • 7031970 to 1979
  • 1,342Before 1970
Ancestries in Murrieta, CA

First ancestries reported:

  • English: 3,884 (6.9%)
  • German: 2,514 (4.5%)
  • Irish: 2,473 (4.4%)
  • American: 2,054 (3.6%)
  • Italian: 2,039 (3.6%)
  • European: 1,037 (1.8%)
  • Scottish: 751 (1.3%)
  • Syrian: 476 (0.8%)
  • French: 322 (0.6%)
  • Eastern European: 307 (0.5%)
  • Iranian: 300 (0.5%)
  • Dutch: 274 (0.5%)
  • Arab: 260 (0.5%)
  • Polish: 258 (0.5%)
  • Norwegian: 224 (0.4%)
  • Scotch-Irish: 204 (0.4%)
  • African: 202 (0.4%)
  • Swedish: 194 (0.3%)
  • French Canadian: 182 (0.3%)
  • Czech: 178 (0.3%)
  • Afghan: 173 (0.3%)
  • Russian: 170 (0.3%)
  • British: 165 (0.3%)
  • Canadian: 160 (0.3%)
  • Jordanian: 156 (0.3%)
  • Armenian: 120 (0.2%)
  • Portuguese: 91 (0.2%)
  • Somali: 80 (0.1%)
  • Slovak: 74 (0.1%)
  • Greek: 74 (0.1%)
  • Hungarian: 72 (0.1%)
  • Palestinian: 67 (0.1%)
  • Jamaican: 64 (0.1%)
  • Swiss: 64 (0.1%)
  • Romanian: 59 (0.1%)
  • Scandinavian: 59 (0.1%)
  • Egyptian: 52 (0.09%)
  • Finnish: 50 (0.09%)
  • Haitian: 49 (0.09%)
  • Lithuanian: 46 (0.08%)
  • South African: 40 (0.07%)
  • Lebanese: 34 (0.06%)
  • Australian: 24 (0.04%)
  • Croatian: 23 (0.04%)
  • Latvian: 21 (0.04%)
  • Nigerian: 20 (0.04%)
  • Yugoslavian: 20 (0.04%)
  • Austrian: 20 (0.04%)
  • Danish: 19 (0.03%)
  • Maltese: 15 (0.03%)
  • Serbian: 15 (0.03%)
  • Northern European: 14 (0.02%)
  • Guyanese: 9 (0.02%)
  • Turkish: 5 (0.01%)
  • Ghanaian: 4 (0.01%)

Most common places of birth for foreign-born residents (%):

Mexico
Murrieta:

37.5% (6,662)
California:

37.2% (3,881,193)

Philippines
Murrieta:

12.7% (2,259)
California:

7.8% (818,297)

Vietnam
Murrieta:

5.7% (1,016)
California:

4.9% (512,335)

Syria
Murrieta:

4.0% (713)
California:

0.3% (30,949)

Korea
Murrieta:

3.8% (683)
California:

3.0% (315,248)

England
Murrieta:

3.6% (631)
California:

0.6% (57,953)

China, excluding Hong Kong and Taiwan
Murrieta:

2.3% (403)
California:

6.6% (684,672)

El Salvador
Murrieta:

2.0% (361)
California:

4.2% (440,287)

Place of birth for U.S.-born residents:

  • This state: 73,010
  • Other state: 19,917
  • Northeast: 3,397
  • Midwest: 4,686
  • South: 4,854
  • West: 6,980

87.1% of Murrieta residents lived in the same house 1 years ago.
   Out of people who lived in different houses, 34.6% lived in this county.
   Out of people who lived in different counties, 82.5% lived in California.


Murrieta:

87.1%
State average:

88.9%

Education attainment for males 25 years and older:

  • No schooling: 497
  • Nursery to 4th grade: 238
  • 5th and 6th grade: 218
  • 7th and 8th grade: 90
  • 9th grade: 48
  • 10th grade: 526
  • 11th grade: 206
  • 12th grade, no diploma: 1,127
  • High school graduate (or equivalency): 7,051
  • Less than 1 year of college: 3,105
  • Some college more than 1 year, no degree: 5,423
  • Associate degree: 4,824
  • Bachelor's degree: 7,532
  • Master's degree: 2,400
  • Professional school degree: 973
  • Doctorate degree: 746
Educational Attainment for Males

Education attainment for females 25 years and older:

  • No schooling: 289
  • Nursery to 4th grade: 128
  • 5th and 6th grade: 190
  • 7th and 8th grade: 180
  • 9th grade: 215
  • 10th grade: 344
  • 11th grade: 405
  • 12th grade, no diploma: 516
  • High school graduate (or equivalency): 8,058
  • Less than 1 year of college: 3,742
  • Some college more than 1 year, no degree: 7,300
  • Associate degree: 5,022
  • Bachelor's degree: 6,544
  • Master's degree: 3,208
  • Professional school degree: 507
  • Doctorate degree: 162
Educational Attainment for Females
Murrieta marital status for males
Murrieta marital status for females

Housing units in structures:

  • One, detached: 28,536
  • One, attached: 1,314
  • Two: 745
  • 3 or 4: 1,170
  • 5 to 9: 835
  • 10 to 19: 1,203
  • 20 to 49: 770
  • 50 or more: 1,031
  • Mobile homes: 1,954

Median worth of mobile homes: $385,700

Housing units lacking complete kitchen facilities in 2022: 0.3%

House/condo owner moved in on average 8 years ago

Renter moved in on average 3 years ago

Year householders moved into residence in Murrieta
Houses and condos Apartments
Most commonly used house heating fuel in houses and condos in Murrieta, CA
  • 82.0%Utility gas
  • 11.7%Electricity
  • 3.0%Bottled, tank, or LP gas
  • 2.3%Solar energy
  • 0.8%No fuel used
  • 0.4%Wood
Most commonly used house heating fuel in apartments in Murrieta, CA
  • 65.0%Utility gas
  • 31.3%Electricity
  • 1.9%Bottled, tank, or LP gas
  • 1.4%No fuel used
  • 0.2%Solar energy

Private vs. public school enrollment:

Students in private schools in grades 1 to 8 (elementary and middle school): 962
Here:

6.8%
California:

10.5%

Students in private schools in grades 9 to 12 (high school): 366
Here:

4.4%
California:

8.5%

Students in private undergraduate colleges: 1,150
Here:

18.3%
California:

15.9%
School Enrollment by Level of School for Male Students
School Enrollment by Level of School for Female Students
Age and Sex of Sensory-Disabled Noninstitutionalized Residents
Age and Sex of Physically-Disabled Noninstitutionalized Residents
Age and Sex of Mentally-Disabled Noninstitutionalized Residents
Age and Sex of Self-Care Disabled Noninstitutionalized Residents
Age and Sex of Go-Outside-Home Disabled Noninstitutionalized Residents
Age and Sex of Noninstitutionalized Residents with Employment Disability