Murrieta Hot Springs, CA (California) Houses and Residents
| Murrieta Hot Springs: | $411,819 |
| California: | $715,900 |
Total population: 3,887 (Urban population: 2,949, Rural population: 0)
Houses: 1,487 (1,385 occupied: 1,082 owner occupied, 303 renter occupied)
| % of renters here: | 22% |
| State: | 44% |
Housing density: 1,163 houses/condos per square mile
Median price asked for vacant for-sale houses and condos in 2022 in this county: $550,307.
Median contract rent in 2022: $1,695 (lower quartile is $1,280, upper quartile is over $2,000)
Median rent asked for vacant for-rent units in 2022: $1,825
Median gross rent in Murrieta Hot Springs, CA in 2022: over $2,000
Housing units in Murrieta Hot Springs with a mortgage: 182 (43 second mortgage, 0 home equity loan, 0 both second mortgage and home equity loan)
Houses without a mortgage: 16
Compare current foreclosures near Murrieta Hot Springs, CA:
| Photo | Address | Area | Beds / Baths | Price | Details |
|---|---|---|---|---|---|

|
#1
Pebble Brook Cir
Temecula, CA 92592
|
3,573 sq. feet
|
3 baths 4 beds |
$849,900
|
show details |

|
#2
Camino Cristal
Menifee, CA 92584
|
2,337 sq. feet
|
2 baths 5 beds |
$419,900
|
show details |

|
#3
Quail Creek Lane
Wildomar, CA 92595
|
1,891 sq. feet
|
2 baths 3 beds |
$675,000
|
show details |

|
#4
Ryan Ave
Lake Elsinore, CA 92530
|
- sq. feet
|
2 baths 2 beds |
$509,900
|
show details |

|
#5
Periwinkle Way
Lake Elsinore, CA 92532
|
2,858 sq. feet
|
3 baths 5 beds |
show details | |

|
#6
Lyndie Ln Unit 2
Temecula, CA 92591
|
1,004 sq. feet
|
2 baths 2 beds |
show details | |

|
#7
Alehzon Cir
Temecula, CA 92592
|
2,685 sq. feet
|
2 baths 5 beds |
show details | |

|
#8
W Westmont Ave
Hemet, CA 92543
|
1,218 sq. feet
|
2 baths 2 beds |
show details | |

|
#9
Canyon Estates Dr
Lake Elsinore, CA 92532
|
2,358 sq. feet
|
2 baths 6 beds |
show details | |

|
#10
Tierra Shores Ln
Menifee, CA 92584
|
1,979 sq. feet
|
2 baths 3 beds |
show details |
| Photo | Address | Area | Beds / Baths | Price | Details |
|---|---|---|---|---|---|

|
#11
E Acacia Ave
Hemet, CA 92543
|
988 sq. feet
|
1 baths 4 beds |
show details | |

|
#12
Blue Topaz Dr
Sun City, CA 92585
|
3,290 sq. feet
|
3 baths 5 beds |
show details | |

|
#13
Oradon Way
Hemet, CA 92545
|
883 sq. feet
|
2 baths 2 beds |
show details | |

|
#14
Plymouth Way
Temecula, CA 92591
|
2,203 sq. feet
|
2 baths 3 beds |
show details | |

|
#15
Capricho Cir
Temecula, CA 92590
|
3,248 sq. feet
|
3 baths 4 beds |
show details | |

|
#16
Breighton Wood St
Menifee, CA 92584
|
3,393 sq. feet
|
2 baths 5 beds |
show details | |

|
#17
Avenida Bonita
Murrieta, CA 92562
|
3,359 sq. feet
|
4 baths 4 beds |
show details | |

|
#18
Almont Way
Sun City, CA 92585
|
2,865 sq. feet
|
3 baths 6 beds |
show details | |

|
#19
Sonata Dr
Murrieta, CA 92562
|
3,028 sq. feet
|
3 baths 5 beds |
show details | |

|
#20
Coral Ave
Hemet, CA 92543
|
1,034 sq. feet
|
2 baths 2 beds |
show details |
| Photo | Address | Area | Beds / Baths | Price | Details |
|---|---|---|---|---|---|

|
#21
Morro Rd
Fallbrook, CA 92028
|
1,693 sq. feet
|
2 baths 3 beds |
show details | |

|
#22
Bonnie Lea Dr
Lake Elsinore, CA 92530
|
702 sq. feet
|
1 baths 1 beds |
show details | |

|
#23
Via Verde
Lake Elsinore, CA 92530
|
1,274 sq. feet
|
2 baths 3 beds |
show details | |

|
#24
Old Wrangler Rd
Sun City, CA 92587
|
3,189 sq. feet
|
3 baths 5 beds |
show details | |

|
#25
Bradley Rd
Sun City, CA 92586
|
1,066 sq. feet
|
2 baths 2 beds |
show details | |

|
#26
Brentwood Way
Hemet, CA 92545
|
2,040 sq. feet
|
3 baths 3 beds |
show details | |

|
#27
Baldy Peak Dr
Sun City, CA 92586
|
1,570 sq. feet
|
2 baths 3 beds |
show details | |

|
#28
Hibiscus
Lake Elsinore, CA 92530
|
3,014 sq. feet
|
5 baths 5 beds |
show details | |

|
#29
Via Oeste Dr
Fallbrook, CA 92028
|
4,650 sq. feet
|
3 baths 5 beds |
show details | |

|
#30
Canopy Ln
Lake Elsinore, CA 92532
|
3,794 sq. feet
|
3 baths 6 beds |
show details |
| Photo | Address | Area | Beds / Baths | Price | Details |
|---|---|---|---|---|---|

|
#31
Bonica St
Lake Elsinore, CA 92532
|
2,867 sq. feet
|
3 baths 4 beds |
show details | |

|
#32
Westlake Dr
Menifee, CA 92584
|
1,746 sq. feet
|
2 baths 3 beds |
show details | |

|
#33
Chervil Way
Lake Elsinore, CA 92532
|
2,533 sq. feet
|
3 baths 4 beds |
show details | |

|
#34
Mira Loma Dr
Temecula, CA 92592
|
1,645 sq. feet
|
1 baths 4 beds |
show details | |

|
#35
E Loma Linda Rd
Temecula, CA 92592
|
1,189 sq. feet
|
2 baths 3 beds |
show details | |

|
#36
Calle Arevalo
Temecula, CA 92592
|
1,940 sq. feet
|
2 baths 2 beds |
show details | |

|
#37
Bronco Cir
Temecula, CA 92592
|
1,537 sq. feet
|
2 baths 3 beds |
show details | |

|
#38
Tuscan Creek Way
Temecula, CA 92592
|
3,335 sq. feet
|
3 baths 5 beds |
show details | |

|
#39
Serrana Rd
Perris, CA 92570
|
1,300 sq. feet
|
2 baths 3 beds |
show details | |

|
#40
Green Branch St
Menifee, CA 92584
|
3,090 sq. feet
|
2 baths 3 beds |
show details |
| Photo | Address | Area | Beds / Baths | Price | Details |
|---|---|---|---|---|---|

|
#41
Villa Valtelena
Lake Elsinore, CA 92532
|
2,589 sq. feet
|
3 baths 4 beds |
show details | |

|
#42
Long St
Hemet, CA 92543
|
1,464 sq. feet
|
2 baths 2 beds |
show details | |

|
#43
Oakville Ct
Temecula, CA 92592
|
2,895 sq. feet
|
2 baths 3 beds |
show details | |

|
#44
Cottonwood St
Murrieta, CA 92563
|
2,797 sq. feet
|
3 baths 4 beds |
show details | |

|
#45
Portsmouth Dr
Sun City, CA 92586
|
2,420 sq. feet
|
2 baths 4 beds |
show details | |

|
#46
Oak Cliff Dr
Temecula, CA 92591
|
1,262 sq. feet
|
2 baths 3 beds |
show details | |

|
#47
Calle Arrebol
Murrieta, CA 92563
|
1,810 sq. feet
|
2 baths 2 beds |
show details | |

|
#48
Sweet Magnolia Way
Murrieta, CA 92563
|
3,732 sq. feet
|
4 baths 4 beds |
show details | |

|
#49
Mesa Rd
Temecula, CA 92592
|
2,882 sq. feet
|
3 baths 4 beds |
show details | |

|
Check over 1 million property listings on Foreclosure.com!
|
browse all offers | |||

 | RIDGEGATE Condos in Murrieta (4 replies) |
| Temecula vs Winchita vs Murrieta vs French Valley? Moving asap! (7 replies) |
| Commute from Temecula to Irvine and Vice Versa (34 replies) |
| Considering move to Murrieta area, lots of questions (57 replies) |
| Considering Murrieta (Honest Facts please) (65 replies) |
| Military Considering Move to Temecula (17 replies) |

Household type by relationship:
Households: 2,153,812- In family households: 1,916,707 (357,691 male householders, 152,550 female householders)
376,381 spouses, 728,028 children (675,451 natural, 15,499 adopted, 37,078 stepchildren), 69,455 grandchildren, 34,232 brothers or sisters, 33,896 parents, foster children, 57,727 other relatives, 76,462 non-relatives
- In nonfamily households: 237,105 (84,686 male householders (58,397 living alone)), 91,333 female householders (74,097 living alone)), 61,086 nonrelatives
- In group quarters: 35,829 (20,862 institutionalized population)
308,692 married couples with children.
98,911 single-parent households (26,262 men, 72,649 women).
88.6% of residents of Murrieta Hot Springs speak English at home.
5.4% of residents speak Spanish at home (58% speak English very well, 24% speak English well, 18% don't speak English at all).
4.7% of residents speak other Indo-European language at home (70% speak English very well, 30% speak English well).
1.3% of residents speak Asian or Pacific Island language at home (68% speak English very well, 32% speak English well).
Foreign born population: 638 (13.5%)
(104.4% of them are naturalized citizens)
| Here: | 6.1 |
| State: | 6.0 |
| Here: | 5.7 |
| State: | 3.9 |

- Bedrooms in owner-occupied houses and condos in Murrieta Hot Springs, California
- 12no bedroom
- 81 bedroom
- 7582 bedrooms
- 2153 bedrooms
- 644 bedrooms
- 255+ bedrooms

- Bedrooms in renter-occupied apartments in Murrieta Hot Springs, California
- 30no bedroom
- 241 bedroom
- 1762 bedrooms
- 683 bedrooms
- 54 bedrooms
- 05+ bedrooms

- Cars and other vehicles available in Murrieta Hot Springs in owner-occupied houses/condos
- 65no vehicle
- 6231 vehicle
- 3382 vehicles
- 363 vehicles
- 204 vehicles
- 05+ vehicles

- Cars and other vehicles available in Murrieta Hot Springs in renter-occupied apartments
- 28no vehicle
- 1691 vehicle
- 652 vehicles
- 313 vehicles
- 104 vehicles
- 05+ vehicles

- Rooms in owner-occupied houses in Murrieta Hot Springs, California
- 121 room
- 02 rooms
- 243 rooms
- 1894 rooms
- 4825 rooms
- 2126 rooms
- 787 rooms
- 528 rooms
- 339+ rooms

- Rooms in renter-occupied apartments in Murrieta Hot Springs, California
- 301 room
- 242 rooms
- 83 rooms
- 894 rooms
- 925 rooms
- 286 rooms
- 197 rooms
- 138 rooms
- 09+ rooms


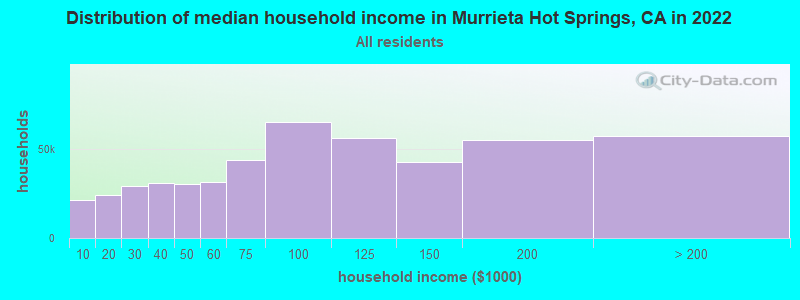
Murrieta Hot Springs, CA household income distribution

- 21,440Less than $10,000
- 24,247$10,000 to $19,999
- 29,264$20,000 to $29,999
- 31,095$30,000 to $39,999
- 30,711$40,000 to $49,999
- 31,583$50,000 to $59,999
- 44,222$60,000 to $74,999
- 65,440$75,000 to $99,999
- 56,317$100,000 to $124,999
- 43,073$125,000 to $149,999
- 55,033$150,000 to $199,999
- 57,587$200,000 or more
Percentage of workers working in this county: 83.8%
Number of people working at home: 182 (11.6% of all workers)
Travel time to work (commute)
- Less than 5 minutes: 56
- 5 to 9 minutes: 113
- 10 to 14 minutes: 155
- 15 to 19 minutes: 134
- 20 to 24 minutes: 88
- 25 to 29 minutes: 23
- 30 to 34 minutes: 54
- 35 to 39 minutes: 0
- 40 to 44 minutes: 19
- 45 to 59 minutes: 53
- 60 to 89 minutes: 36
- 90 or more minutes: 44
Means of transportation to work:
- Drove a car alone: 543 (65.7%)
- Carpooled: 153 (18.5%)
- Bus or trolley bus: 8 (1.0%)
- Bicycle: 5 (0.6%)
- Walked: 35 (4.2%)
- Other means: 31 (3.8%)
- Worked at home: 51 (6.2%)


- Year of entry for the foreign-born population in Murrieta Hot Springs, California
- 281995 to March 2000
- 301990 to 1994
- 51985 to 1989
- 41980 to 1984
- 231975 to 1979
- 441970 to 1974
- 101965 to 1969
- 201Before 1965

First ancestries reported:
- Other: 726 (23.1%)
- German: 471 (15.0%)
- English: 394 (12.5%)
- Irish: 317 (10.1%)
- United States: 191 (6.1%)
- Italian: 164 (5.2%)
- French: 124 (3.9%)
- Scotch-Irish: 100 (3.2%)
- Russian: 96 (3.1%)
- Norwegian: 75 (2.4%)
- Scottish: 72 (2.3%)
- Swedish: 70 (2.2%)
- Dutch: 55 (1.7%)
- Polish: 45 (1.4%)
- Czech: 40 (1.3%)
- Lithuanian: 35 (1.1%)
- Welsh: 35 (1.1%)
- Danish: 30 (1.0%)
- Hungarian: 28 (0.9%)
- Swiss: 26 (0.8%)
- Ukrainian: 21 (0.7%)
- Portuguese: 15 (0.5%)
- French Canadian: 14 (0.4%)
Most common places of birth for foreign-born residents (%):
| Murrieta Hot Springs: | 20.3% (70) |
| California: | 44.3% (3,928,701) |
| Murrieta Hot Springs: | 11.0% (38) |
| California: | 1.1% (98,160) |
| Murrieta Hot Springs: | 9.9% (34) |
| California: | 1.6% (141,181) |
| Murrieta Hot Springs: | 9.3% (32) |
| California: | 0.3% (22,311) |
| Murrieta Hot Springs: | 8.1% (28) |
| California: | 0.4% (32,279) |
| Murrieta Hot Springs: | 7.5% (26) |
| California: | 1.5% (133,090) |
| Murrieta Hot Springs: | 5.8% (20) |
| California: | 0.4% (38,450) |
| Murrieta Hot Springs: | 4.6% (16) |
| California: | 3.0% (268,452) |
| Murrieta Hot Springs: | 2.9% (10) |
| California: | 1.8% (158,613) |
| Murrieta Hot Springs: | 2.6% (9) |
| California: | 0.3% (24,638) |
| Murrieta Hot Springs: | 2.6% (9) |
| California: | 0.3% (29,335) |
| Murrieta Hot Springs: | 2.3% (8) |
| California: | 0.1% (11,383) |
| Murrieta Hot Springs: | 2.3% (8) |
| California: | 0.1% (9,641) |
| Murrieta Hot Springs: | 2.3% (8) |
| California: | 0.1% (11,701) |
| Murrieta Hot Springs: | 2.3% (8) |
| California: | 4.7% (418,249) |
| Murrieta Hot Springs: | 2.3% (8) |
| California: | 0.6% (53,250) |
Place of birth for U.S.-born residents:
- This state: 1,103
- Other state: 1,480
- Northeast: 319
- Midwest: 696
- South: 204
- West: 261
32% of Murrieta Hot Springs residents lived in the same house 5 years ago.
Out of people who lived in different houses, 46% lived in this county.
Out of people who lived in different counties, 61% lived in California.
Education attainment for males 25 years and older:
- No schooling: 14
- Nursery to 4th grade: 0
- 5th and 6th grade: 8
- 7th and 8th grade: 16
- 9th grade: 8
- 10th grade: 9
- 11th grade: 13
- 12th grade, no diploma: 72
- High school graduate (or equivalency): 307
- Less than 1 year of college: 119
- Some college more than 1 year, no degree: 193
- Associate degree: 58
- Bachelor's degree: 122
- Master's degree: 60
- Professional school degree: 0
- Doctorate degree: 28

Education attainment for females 25 years and older:
- No schooling: 8
- Nursery to 4th grade: 0
- 5th and 6th grade: 6
- 7th and 8th grade: 36
- 9th grade: 50
- 10th grade: 36
- 11th grade: 49
- 12th grade, no diploma: 85
- High school graduate (or equivalency): 436
- Less than 1 year of college: 153
- Some college more than 1 year, no degree: 175
- Associate degree: 97
- Bachelor's degree: 68
- Master's degree: 7
- Professional school degree: 0
- Doctorate degree: 0


Housing units in structures:
- One, detached: 164
- One, attached: 106
- 3 or 4: 64
- 10 to 19: 59
- Mobile homes: 1,094
Median worth of mobile homes: $262,030

Private vs. public school enrollment:
| Here: | 25.9% |
| California: | 9.9% |
| Here: | 23.6% |
| California: | 7.8% |
| Here: | 80.1% |
| California: | 15.4% |


