Muskegon, MI (Michigan) Houses and Residents
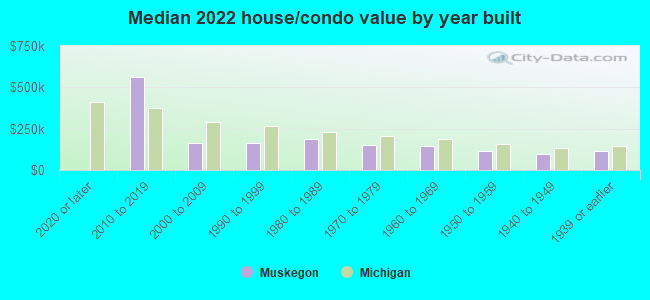
Estimated median house or condo value in 2022: $111,935 (it was $60,200 in 2000 )
Muskegon:
$111,935Michigan:
$224,400
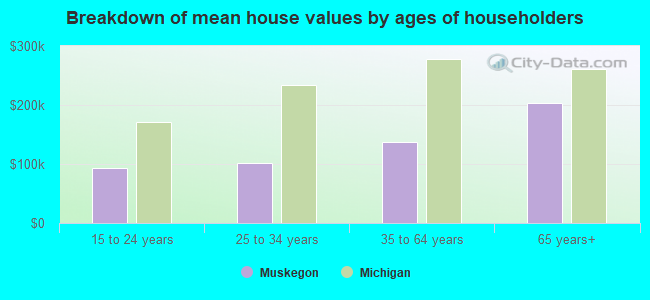
Lower value quartile - upper value quartile: $74,572 - $177,702Mean price in 2022: Detached houses: $128,643 Here:
$128,643State:
$280,038
Townhouses or other attached units: $231,664 Here:
$231,664State:
$239,520
In 2-unit structures: $232,557 Here:
$232,557State:
$219,481
In 3-to-4-unit structures: $321,131 Here:
$321,131State:
$207,067
In 5-or-more-unit structures: $94,106 Here:
$94,106State:
$192,733
Mobile homes: $104,562 Here:
$104,562State:
$72,868
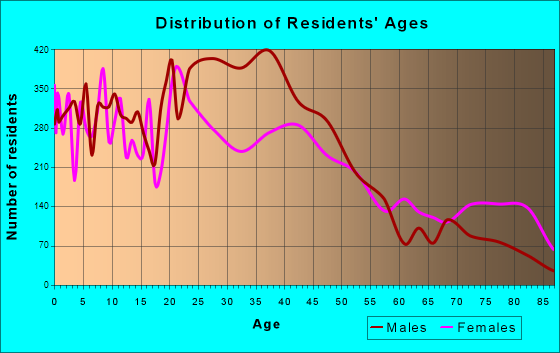
Total population: 38,393 (All urban)
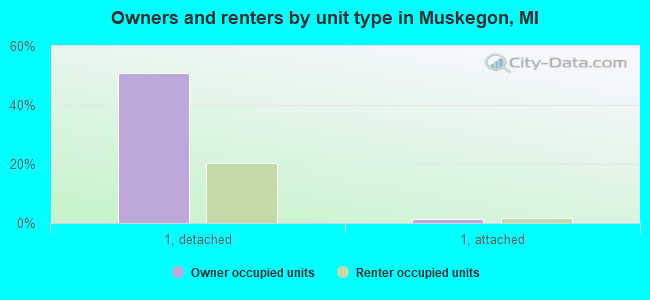
Houses: 16,806 (14,393 occupied: 7,662 owner occupied, 6,767 renter occupied )
% of renters here:
47%State:
27%
Housing density: 1,171 houses/condos per square mile
Median price asked for vacant for-sale houses and condos in 2022: $77,671.
Median contract rent in 2022: $767 (lower quartile is $589, upper quartile is $950)
Median rent asked for vacant for-rent units in 2022: $1,172
Median gross rent in Muskegon, MI in 2022: $927
Housing units in Muskegon with a mortgage: 3,924 (256 second mortgage, 0 home equity loan, 196 both second mortgage and home equity loan )Houses without a mortgage: 176
Median household income for houses/condos with a mortgage: $55,688
Median household income for apartments without a mortgage: $43,697
Median monthly housing costs: $786
Data:
Median house or condo value ($)
Median house or condo value ($ change since 2000)
Median house or condo value ($) - White
Median house or condo value ($) - Black or African American
Median house or condo value ($) - Asian
Median house or condo value ($) - Hispanic or Latino
Median house or condo value ($) - American Indian and Alaska Native
Median house or condo value ($) - Multirace
Median house or condo value ($) - Other Race
Median price asked for mobile homes ($)
Household density (households per square mile)
Mean house or condo value by units in structure - 1, detached ($)
Mean house or condo value by units in structure - 1, attached ($)
Mean house or condo value by units in structure - 2 ($)
Mean house or condo value by units in structure by units in structure - 3 or 4 ($)
Mean house or condo value by units in structure - 5 or more ($)
Mean house or condo value by units in structure - Boat, RV, van, etc. ($)
Mean house or condo value by units in structure - Mobile home ($)
Median contract rent ($)
Median contract rent - Lower quartile ($)
Median contract rent - Upper quartile ($)
Median gross rent ($)
Urban houses (%)
Rural houses (%)
Houses occupied (%)
Houses occupied (% change since 2000)
Houses owner occupied (%)
Houses owner occupied (% change since 2000)
Houses renter occupied (%)
Houses renter occupied (% change since 2000)
Vacant housing units - For rent (%)
Vacant housing units - For rent (% change since 2000)
Vacant housing units - For sale only (%)
Vacant housing units - For sale only (% change since 2000)
Vacant housing units - Rented or sold, not occupied (%)
Vacant housing units - Rented or sold, not occupied (% change since 2000)
Vacant housing units - For seasonal, recreational, or occasional use (%)
Vacant housing units - For seasonal, recreational, or occasional use (% change since 2000)
Vacant housing units - For migrant workers (%)
Vacant housing units - For migrant workers (% change since 2000)
Vacant housing units - Other vacant (%)
Vacant housing units - Other vacant (% change since 2000)
Median monthly housing costs ($)
Median household income for houses/condos with a mortgage ($)
Median household income for houses/condos without a mortgage ($)
Median household income ($)
Median household income ($) - White
Median household income ($) - Black or African American
Median household income ($) - Asian
Median household income ($) - Hispanic or Latino
Median household income ($) - American Indian and Alaska Native
Median household income ($) - Multirace
Median household income ($) - Other Race
Mortgage status - with mortgage (%)
Mortgage status - with second mortgage (%)
Mortgage status - with home equity loan (%)
Mortgage status - with both second mortgage and home equity loan (%)
Mortgage status - without a mortgage (%)
Median year house/condo built
Median year apartment built
Household type by relationship - Male householder living alone (%)
Household type by relationship - Male householder not living alone (%)
Household type by relationship - Female householder living alone (%)
Household type by relationship - Female householder not living alone (%)
Household type by relationship - Opposite-Sex spouse (%)
Household type by relationship - Same-Sex spouse (%)
Household type by relationship - Opposite-Sex unmarried partner (%)
Household type by relationship - Same-Sex unmarried partner (%)
Household type by relationship - In group quarters (%)
Size of family households - 2-person household (%)
Size of family households - 3-person household (%)
Size of family households - 4-person household (%)
Size of family households - 5-person household (%)
Size of family households - 6-person household (%)
Size of family households - 7-or-more-person household (%)
Size of nonfamily households - 1-person household (%)
Size of nonfamily households - 2-person household (%)
Size of nonfamily households - 3-person household (%)
Size of nonfamily households - 4-person household (%)
Size of nonfamily households - 5-person household (%)
Size of nonfamily households - 6-person household (%)
Size of nonfamily households - 7-or-moreperson household (%)
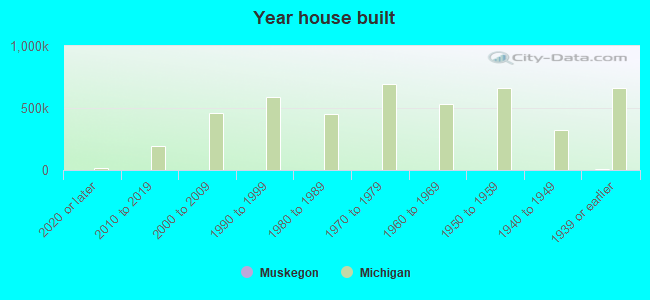
Year house built - Built 2010 or later (%)
Year house built - Built 2000 to 2009 (%)
Year house built - Built 1990 to 1999 (%)
Year house built - Built 1980 to 1989 (%)
Year house built - Built 1970 to 1979 (%)
Year house built - Built 1960 to 1969 (%)
Year house built - Built 1950 to 1959 (%)
Year house built - Built 1940 to 1949 (%)
Year house built - Built 1939 or earlier (%)
Median number of rooms in houses and condos
Median number of rooms in apartments
Median number of bedrooms in owner occupied houses
Mean number of bedrooms in owner occupied houses
Median number of bedrooms in renter occupied houses
Mean number of bedrooms in renter occupied houses
Median number of vehichles in owner occupied houses
Mean number of vehichles in owner occupied houses
Median number of vehichles in renter occupied houses
Mean number of vehichles in renter occupied houses
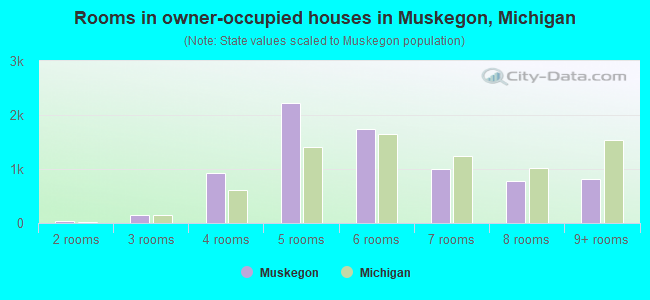
Rooms in owner-occupied houses - 1 room (%)
Rooms in owner-occupied houses - 2 rooms (%)
Rooms in owner-occupied houses - 3 rooms (%)
Rooms in owner-occupied houses - 4 rooms (%)
Rooms in owner-occupied houses - 5 rooms (%)
Rooms in owner-occupied houses - 6 rooms (%)
Rooms in owner-occupied houses - 7 rooms (%)
Rooms in owner-occupied houses - 8 rooms (%)
Rooms in owner-occupied houses - 9+ rooms (%)
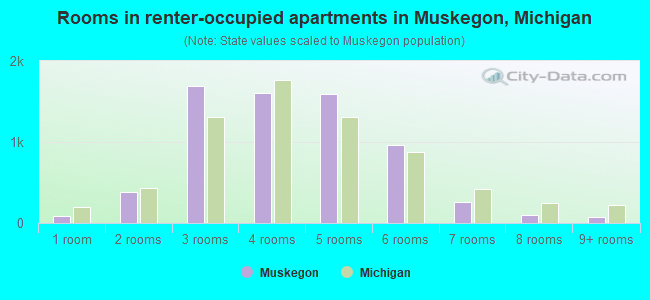
Rooms in renter-occupied houses - 1 room (%)
Rooms in renter-occupied houses - 2 rooms (%)
Rooms in renter-occupied houses - 3 rooms (%)
Rooms in renter-occupied houses - 4 rooms (%)
Rooms in renter-occupied houses - 5 rooms (%)
Rooms in renter-occupied houses - 6 rooms (%)
Rooms in renter-occupied houses - 7 rooms (%)
Rooms in renter-occupied houses - 8 rooms (%)
Rooms in renter-occupied houses - 9+ rooms (%)
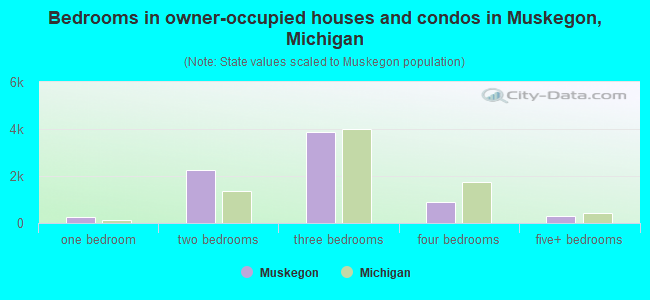
Bedrooms in owner-occupied houses - no bedrooms (%)
Bedrooms in owner-occupied houses - 1 bedroom (%)
Bedrooms in owner-occupied houses - 2 bedrooms (%)
Bedrooms in owner-occupied houses - 3 bedrooms (%)
Bedrooms in owner-occupied houses - 4 bedrooms (%)
Bedrooms in owner-occupied houses - 5+ bedrooms (%)
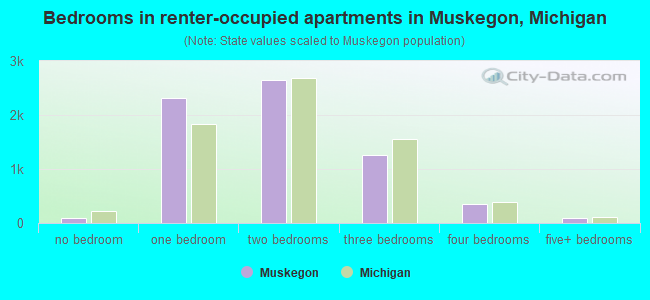
Bedrooms in renter-occupied houses - no bedrooms (%)
Bedrooms in renter-occupied houses - 1 bedroom (%)
Bedrooms in renter-occupied houses - 2 bedrooms (%)
Bedrooms in renter-occupied houses - 3 bedrooms (%)
Bedrooms in renter-occupied houses - 4 bedrooms (%)
Bedrooms in renter-occupied houses - 5+ bedrooms (%)
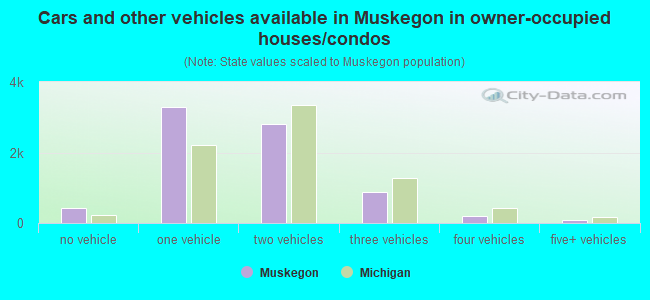
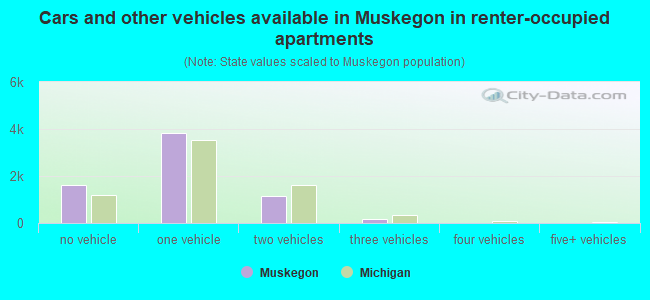
Vehicles available in owner-occupied houses - no vehicle available (%)
Vehicles available in owner-occupied houses - 1 vehicle available(%)
Vehicles available in owner-occupied houses - 2 Vehicles available (%)
Vehicles available in owner-occupied houses - 3 Vehicles available (%)
Vehicles available in owner-occupied houses - 4 Vehicles available (%)
Vehicles available in owner-occupied houses - 5+ Vehicles available (%)
Vehicles available in renter-occupied houses - no vehicle available (%)
Vehicles available in renter-occupied houses - 1 vehicle available (%)
Vehicles available in renter-occupied houses - 2 Vehicles available (%)
Vehicles available in renter-occupied houses - 3 Vehicles available (%)
Vehicles available in renter-occupied houses - 4 Vehicles available (%)
Vehicles available in renter-occupied houses - 5+ Vehicles available (%)
Housing units in structures - 1, detached (%)
Housing units in structures - 1, attached (%)
Housing units in structures - 2 (%)
Housing units in structures - 3 or 4 (%)
Housing units in structures - 5 to 9 (%)
Housing units in structures - 10 to 19 (%)
Housing units in structures - 20 to 49 (%)
Housing units in structures - 50 or more (%)
Housing units in structures - Mobile home (%)
Housing units in structures - Boat, RV, van, etc. (%)
Housing units in structures - Owners - 1, detached (%)
Housing units in structures - Owners - 1, attached (%)
Housing units in structures - Owners - 2 (%)
Housing units in structures - Owners - 3 or 4 (%)
Housing units in structures - Owners - 5 to 9 (%)
Housing units in structures - Owners - 10 to 19 (%)
Housing units in structures - Owners - 20 to 49 (%)
Housing units in structures - Owners - 50 or more (%)
Housing units in structures - Owners - Mobile home (%)
Housing units in structures - Owners - Boat, RV, van, etc. (%)
Housing units in structures - Renters - 1, detached (%)
Housing units in structures - Renters - 1, attached (%)
Housing units in structures - Renters - 2 (%)
Housing units in structures - Renters - 3 or 4 (%)
Housing units in structures - Renters - 5 to 9 (%)
Housing units in structures - Renters - 10 to 19 (%)
Housing units in structures - Renters - 20 to 49 (%)
Housing units in structures - Renters - 50 or more (%)
Housing units in structures - Renters - Mobile home (%)
Housing units in structures - Renters - Boat, RV, van, etc. (%)
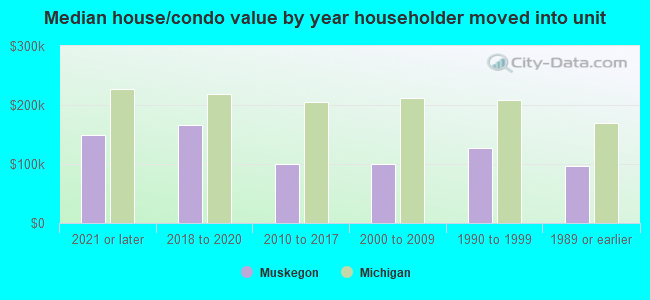
House/condo owner moved in on average (years ago)
Renter moved in on average (years ago)
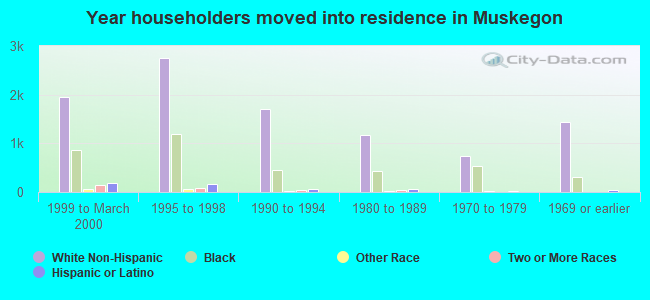
Year householder moved into unit - Moved in 1999 to March 2000 (%)
Year householder moved into unit - Moved in 1999 to March 2000 (%) - White
Year householder moved into unit - Moved in 1999 to March 2000 (%) - Black or African American
Year householder moved into unit - Moved in 1999 to March 2000 (%) - Asian
Year householder moved into unit - Moved in 1999 to March 2000 (%) - Hispanic or Latino
Year householder moved into unit - Moved in 1999 to March 2000 (%) - American Indian and Alaska Native
Year householder moved into unit - Moved in 1999 to March 2000 (%) - Multirace
Year householder moved into unit - Moved in 1999 to March 2000 (%) - Other Race
Year householder moved into unit - Moved in 1995 to 1998 (%)
Year householder moved into unit - Moved in 1995 to 1998 (%) - White
Year householder moved into unit - Moved in 1995 to 1998 (%) - Black or African American
Year householder moved into unit - Moved in 1995 to 1998 (%) - Asian
Year householder moved into unit - Moved in 1995 to 1998 (%) - Hispanic or Latino
Year householder moved into unit - Moved in 1995 to 1998 (%) - American Indian and Alaska Native
Year householder moved into unit - Moved in 1995 to 1998 (%) - Multirace
Year householder moved into unit - Moved in 1995 to 1998 (%) - Other Race
Year householder moved into unit - Moved in 1990 to 1994 (%)
Year householder moved into unit - Moved in 1990 to 1994 (%) - White
Year householder moved into unit - Moved in 1990 to 1994 (%) - Black or African American
Year householder moved into unit - Moved in 1990 to 1994 (%) - Asian
Year householder moved into unit - Moved in 1990 to 1994 (%) - Hispanic or Latino
Year householder moved into unit - Moved in 1990 to 1994 (%) - American Indian and Alaska Native
Year householder moved into unit - Moved in 1990 to 1994 (%) - Multirace
Year householder moved into unit - Moved in 1990 to 1994 (%) - Other Race
Year householder moved into unit - Moved in 1980 to 1989 (%)
Year householder moved into unit - Moved in 1980 to 1989 (%) - White
Year householder moved into unit - Moved in 1980 to 1989 (%) - Black or African American
Year householder moved into unit - Moved in 1980 to 1989 (%) - Asian
Year householder moved into unit - Moved in 1980 to 1989 (%) - Hispanic or Latino
Year householder moved into unit - Moved in 1980 to 1989 (%) - American Indian and Alaska Native
Year householder moved into unit - Moved in 1980 to 1989 (%) - Multirace
Year householder moved into unit - Moved in 1980 to 1989 (%) - Other Race
Year householder moved into unit - Moved in 1970 to 1979 (%)
Year householder moved into unit - Moved in 1970 to 1979 (%) - White
Year householder moved into unit - Moved in 1970 to 1979 (%) - Black or African American
Year householder moved into unit - Moved in 1970 to 1979 (%) - Asian
Year householder moved into unit - Moved in 1970 to 1979 (%) - Hispanic or Latino
Year householder moved into unit - Moved in 1970 to 1979 (%) - American Indian and Alaska Native
Year householder moved into unit - Moved in 1970 to 1979 (%) - Multirace
Year householder moved into unit - Moved in 1970 to 1979 (%) - Other Race
Year householder moved into unit - Moved in 1969 or earlier (%)
Year householder moved into unit - Moved in 1969 or earlier (%) - White
Year householder moved into unit - Moved in 1969 or earlier (%) - Black or African American
Year householder moved into unit - Moved in 1969 or earlier (%) - Asian
Year householder moved into unit - Moved in 1969 or earlier (%) - Hispanic or Latino
Year householder moved into unit - Moved in 1969 or earlier (%) - American Indian and Alaska Native
Year householder moved into unit - Moved in 1969 or earlier (%) - Multirace
Year householder moved into unit - Moved in 1969 or earlier (%) - Other Race
Housing units lacking complete plumbing facilities (%)
Housing units lacking complete kitchen facilities (%)
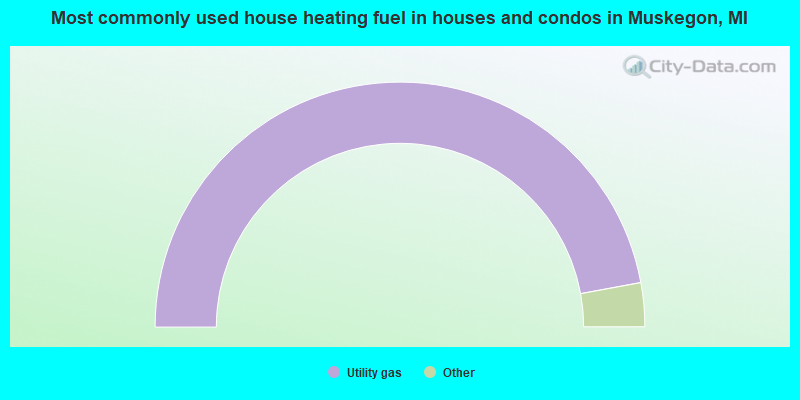
House heating fuel used in houses and condos - Utility gas (%)
House heating fuel used in houses and condos - Bottled, tank, or LP gas (%)
House heating fuel used in houses and condos - Electricity (%)
House heating fuel used in houses and condos - Fuel oil, kerosene, etc. (%)
House heating fuel used in houses and condos - Coal or coke (%)
House heating fuel used in houses and condos - Wood (%)
House heating fuel used in houses and condos - Solar energy (%)
House heating fuel used in houses and condos - Other fuel (%)
House heating fuel used in houses and condos - No fuel used (%)
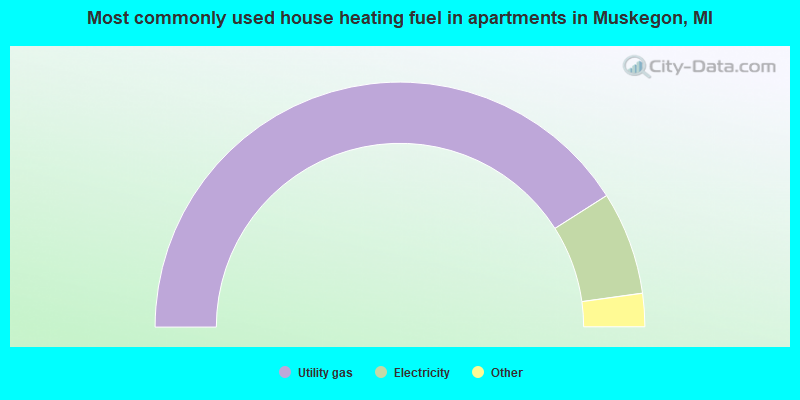
House heating fuel used in apartments - Utility gas (%)
House heating fuel used in apartments - Bottled, tank, or LP gas (%)
House heating fuel used in apartments - Electricity (%)
House heating fuel used in apartments - Fuel oil, kerosene, etc. (%)
House heating fuel used in apartments - Coal or coke (%)
House heating fuel used in apartments - Wood (%)
House heating fuel used in apartments - Solar energy (%)
House heating fuel used in apartments - Other fuel (%)
House heating fuel used in apartments - No fuel used (%)
Latest news about housing in Muskegon, MI collected exclusively by city-data.com from local newspapers, TV, and radio stations
Median year house/condo built: 1947Median year apartment built: 1955Household type by relationship:
Households: 38,420
Male householders: 6,008 (2,550 living alone ), Female householders: 8,330 (2,971 living alone )3,566 spouses (3,522 opposite-sex spouses ), 1,643 unmarried partners , (1,606 opposite-sex unmarried partners ), 9,796 children (9,003 natural , 289 adopted , 503 stepchildren ), 900 grandchildren , 731 brothers or sisters , 513 parents , 0 foster children , 699 other relatives , 1,159 non-relatives In group quarters: 5,071
Size of family households: 3,299 2-persons , 1,950 3-persons , 910 4-persons , 615 5-persons , 239 6-persons , 149 7-or-more-persons .
Size of nonfamily households: 6,150 1-person , 1,216 2-persons , 62 3-persons , 9 4-persons , 19 5-persons .
2,779 married couples with children. single-parent households (461 men , 3,932 women ).
94.1% of residents of Muskegon speak English at home. of residents speak Spanish at home (68% speak English very well , 20% speak English well , 11% speak English not well , 2% don't speak English at all ).of residents speak other Indo-European language at home (93% speak English very well , 6% speak English well , 1% speak English not well ).of residents speak Asian or Pacific Island language at home (57% speak English very well , 43% speak English well ).of residents speak other language at home (24% speak English very well , 21% speak English well , 55% speak English not well ).
Foreign born population: 1,224 (3.2%)of them are naturalized citizens )
Median number of rooms in houses and condos:
Median number of rooms in apartments
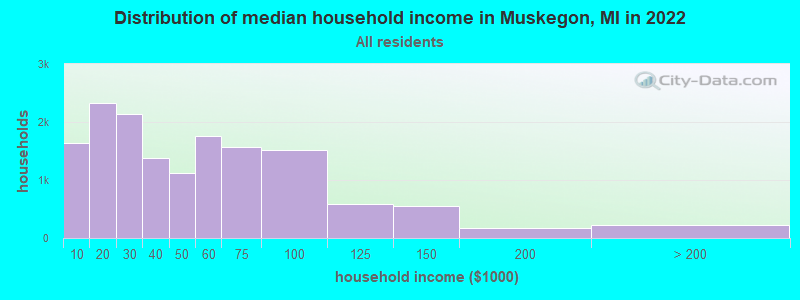
Muskegon, MI household income distribution 1,630 Less than $10,0002,323 $10,000 to $19,9992,136 $20,000 to $29,9991,383 $30,000 to $39,9991,115 $40,000 to $49,9991,759 $50,000 to $59,9991,566 $60,000 to $74,9991,513 $75,000 to $99,999578 $100,000 to $124,999556 $125,000 to $149,999164 $150,000 to $199,999216 $200,000 or more
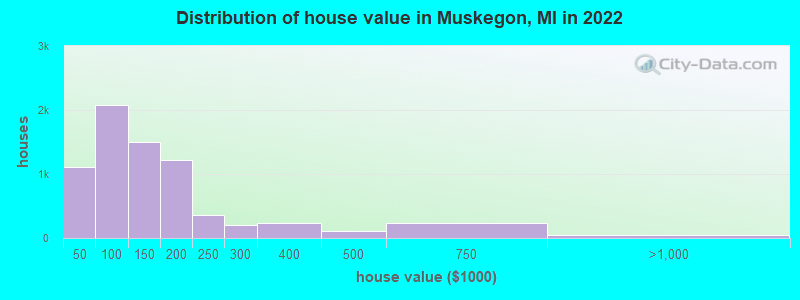
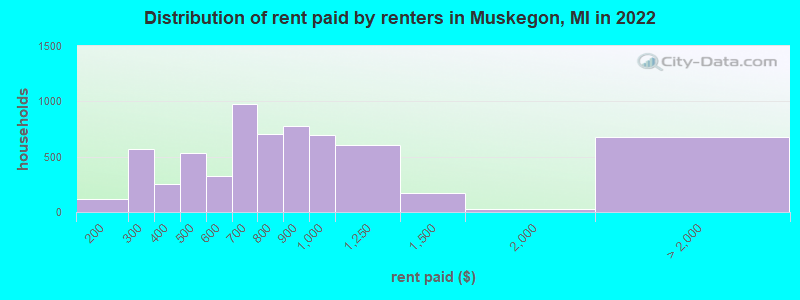
Home value of owner - occupied houses in 2022 in Muskegon, MI 52 Less than $10,000184 $10,000 to $14,99990 $15,000 to $19,999178 $20,000 to $24,99930 $25,000 to $29,999176 $30,000 to $34,999155 $35,000 to $39,999243 $40,000 to $49,999307 $50,000 to $59,999100 $60,000 to $69,999948 $70,000 to $79,999275 $80,000 to $89,999208 $90,000 to $99,999640 $100,000 to $124,999863 $125,000 to $149,999794 $150,000 to $174,999418 $175,000 to $199,999365 $200,000 to $249,999202 $250,000 to $299,999237 $300,000 to $399,999111 $400,000 to $499,999234 $500,000 to $749,9996 $750,000 to $999,99933 $1,000,000 to $1,499,999Rent paid by renters in 2022 in Muskegon, MI 117 $150 to $199413 $200 to $249153 $250 to $299157 $300 to $34991 $350 to $399103 $400 to $449426 $450 to $499119 $500 to $549204 $550 to $599599 $600 to $649374 $650 to $699424 $700 to $749277 $750 to $799780 $800 to $899696 $900 to $999608 $1,000 to $1,249174 $1,250 to $1,49924 $1,500 to $1,999118 $2,000 to $2,49913 $2,500 to $2,99914 $3,500 or more527 No cash rent
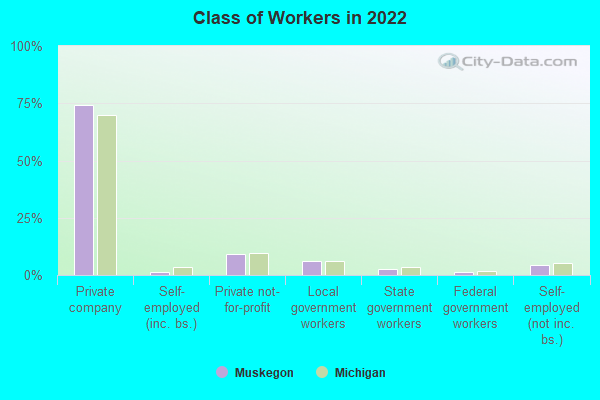
Percentage of workers working in this county: 69.5%Number of people working at home: 764 (5.5% of all workers )
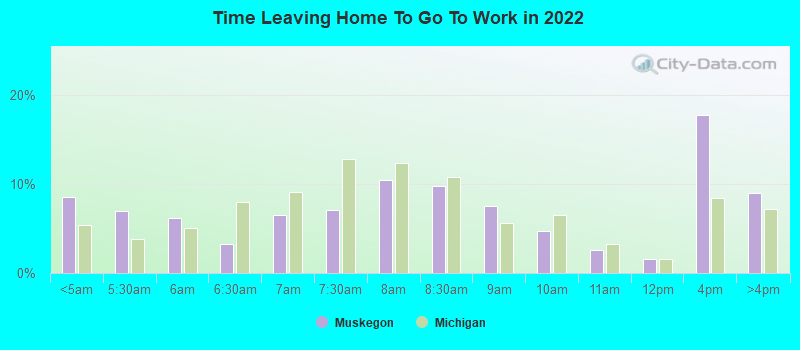
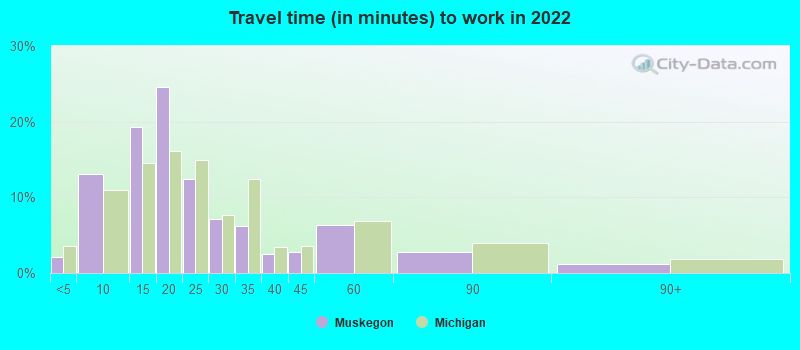
Travel time to work (commute)
Less than 5 minutes: 3295 to 9 minutes: 2,01810 to 14 minutes: 2,18915 to 19 minutes: 2,94220 to 24 minutes: 1,70825 to 29 minutes: 77730 to 34 minutes: 71635 to 39 minutes: 51540 to 44 minutes: 57345 to 59 minutes: 83260 to 89 minutes: 24190 or more minutes: 138
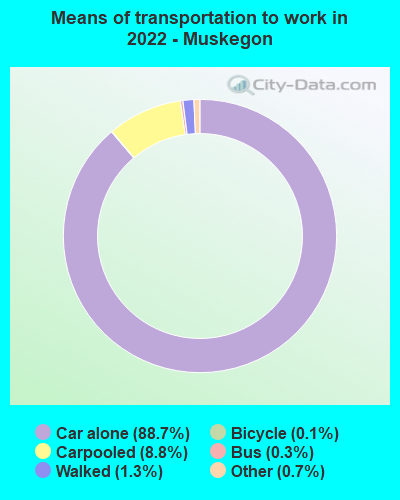
Means of transportation to work:
Drove a car alone: 20,972 (83.2%)Carpooled: 2,088 (8.3%)Bus : 63 (0.2%)Taxi: 210 (0.8%)Bicycle: 37 (0.1%)Walked: 314 (1.2%)Worked at home: 764 (3.0%)
Unemployment by race in 2022
Unemployment rate for White non-Hispanic residents 8.6% Males4.1% FemalesUnemployment rate for Black residents 10.3% Males11.2% FemalesUnemployment rate for Asian residents 42.9% FemalesUnemployment rate for other race residents 14.5% FemalesUnemployment rate for two or more race residents 14.6% Males6.8% FemalesUnemployment rate for Hispanic or Latino residents 12.8% Males13.2% Females
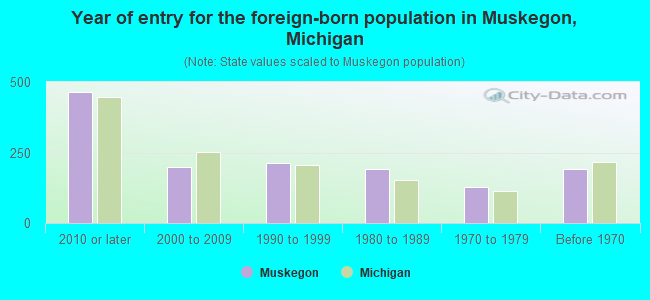
Year of entry for the foreign-born population in Muskegon, Michigan
466 2010 or later 200 2000 to 2009 213 1990 to 1999 192 1980 to 1989 127 1970 to 1979 192 Before 1970
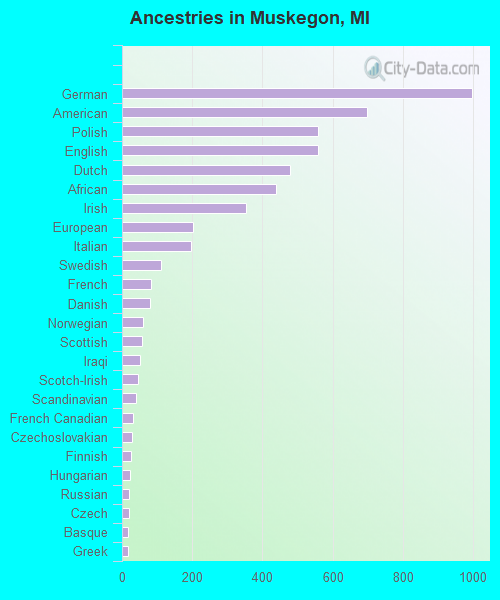
First ancestries reported:
German: 996 (5.8%)
American: 698 (4.1%)
Polish: 559 (3.3%)
English: 559 (3.3%)
Dutch: 478 (2.8%)
African: 438 (2.6%)
Irish: 353 (2.1%)
European: 201 (1.2%)
Italian: 197 (1.2%)
Swedish: 112 (0.7%)
French: 84 (0.5%)
Danish: 80 (0.5%)
Norwegian: 60 (0.4%)
Scottish: 57 (0.3%)
Iraqi: 52 (0.3%)
Scotch-Irish: 46 (0.3%)
Scandinavian: 39 (0.2%)
French Canadian: 30 (0.2%)
Czechoslovakian: 28 (0.2%)
Finnish: 25 (0.1%)
Hungarian: 24 (0.1%)
Russian: 20 (0.1%)
Czech: 19 (0.1%)
Basque: 18 (0.1%)
Greek: 17 (0.10%)
Slovene: 17 (0.10%)
Austrian: 16 (0.09%)
Australian: 14 (0.08%)
Yugoslavian: 14 (0.08%)
Slovak: 13 (0.08%)
Iranian: 10 (0.06%)
Swiss: 10 (0.06%)
Moroccan: 9 (0.05%)
Lithuanian: 8 (0.05%)
Celtic: 7 (0.04%)
Nigerian: 7 (0.04%)
British: 7 (0.04%)
Belgian: 6 (0.04%)
Eastern European: 6 (0.04%)
Trinidadian and Tobagonian: 3 (0.02%)
Romanian: 2 (0.01%) Most common places of birth for foreign-born residents (%): Mexico Muskegon:
46.2% (564)Michigan:
10.9% (75,965)
India Muskegon:
10.6% (129)Michigan:
11.1% (77,240)
Panama Muskegon:
5.5% (67)Michigan:
0.1% (833)
Costa Rica Muskegon:
5.2% (63)Michigan:
0.2% (1,062)
Canada Muskegon:
4.5% (55)Michigan:
5.0% (35,052)
Philippines Muskegon:
4.3% (52)Michigan:
2.8% (19,112)
Iraq Muskegon:
4.1% (50)Michigan:
8.1% (55,954)
Jamaica Muskegon:
4.1% (50)Michigan:
0.7% (4,645)
St. Lucia Muskegon:
2.7% (33)Michigan:
0.0% (78)
El Salvador Muskegon:
2.3% (28)Michigan:
0.4% (2,977)
Nicaragua Muskegon:
1.7% (21)Michigan:
0.1% (624)
Place of birth for U.S.-born residents:
This state: 31,775Other state: 5,305Northeast: 316Midwest: 1,872South: 2,770West: 505 78.0% of Muskegon residents lived in the same house 1 years ago.
Out of people who lived in different houses, 37.5% lived in this county.
Out of people who lived in different counties, 72.2% lived in Michigan.
Muskegon:
78.0%State average:
88.4%
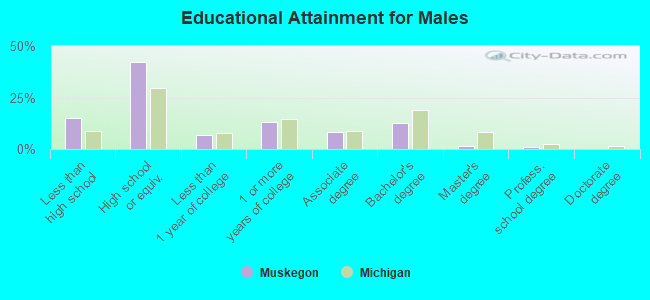
Education attainment for males 25 years and older:
No schooling: 287Nursery to 4th grade: 285th and 6th grade: 1347th and 8th grade: 1529th grade: 20510th grade: 19711th grade: 63112th grade, no diploma: 431High school graduate (or equivalency): 5,859Less than 1 year of college: 949Some college more than 1 year, no degree: 1,793Associate degree: 1,133Bachelor's degree: 1,737Master's degree: 233Professional school degree: 128Doctorate degree: 23
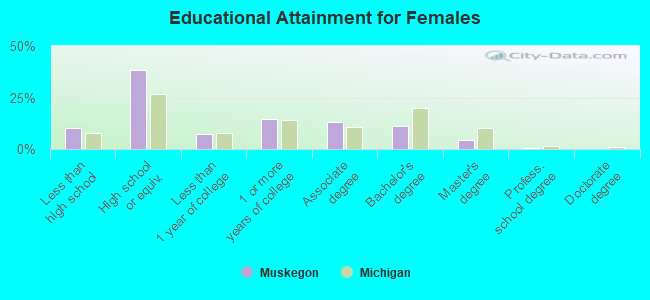
Education attainment for females 25 years and older:
No schooling: 254Nursery to 4th grade: 145th and 6th grade: 1117th and 8th grade: 1829th grade: 2810th grade: 21411th grade: 26312th grade, no diploma: 148High school graduate (or equivalency): 4,628Less than 1 year of college: 881Some college more than 1 year, no degree: 1,781Associate degree: 1,577Bachelor's degree: 1,353Master's degree: 543Professional school degree: 57Doctorate degree: 0
Housing units in structures:
One, detached: 11,177One, attached: 455Two: 1,1183 or 4: 8065 to 9: 51910 to 19: 71220 to 49: 82750 or more: 1,033Mobile homes: 156Median worth of mobile homes: $129,047
Housing units lacking complete plumbing facilities in 2022: 0.6%Housing units lacking complete kitchen facilities in 2022: 2.1%House/condo owner moved in on average 9 years ago
Renter moved in on average 2 years ago
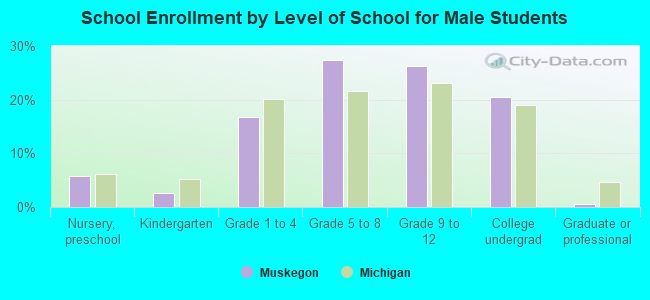
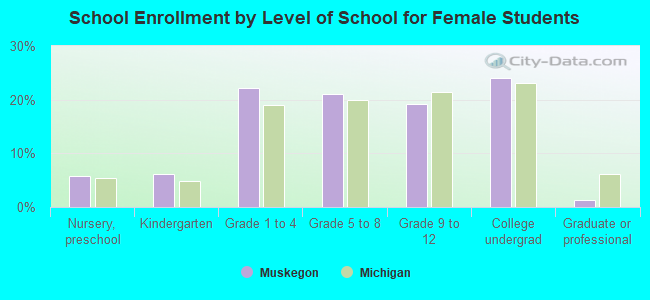
Private vs. public school enrollment:
Students in private schools in grades 1 to 8 (elementary and middle school): 88 Students in private schools in grades 9 to 12 (high school): 201 Students in private undergraduate colleges: 535