Muskogee, OK (Oklahoma) Houses and Residents
Estimated median house or condo value in 2022: $136,655 (it was $54,300 in 2000 )
Muskogee:
$136,655Oklahoma:
$191,700
Lower value quartile - upper value quartile: $79,786 - $202,030Total population: 38,616 (Urban population: 37,067 (all inside urban clusters), Rural population: 1,250 (42 farm, 1,208 nonfarm ))
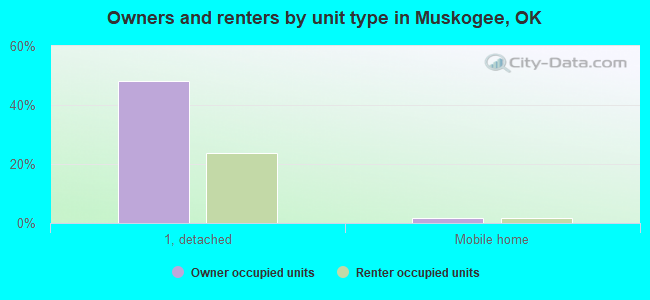
Houses: 17,012 (14,522 occupied: 8,171 owner occupied, 6,468 renter occupied )
% of renters here:
44%State:
35%
Housing density: 456 houses/condos per square mile
Median price asked for vacant for-sale houses and condos in 2022: $93,924.
Median contract rent in 2022: $631 (lower quartile is $520, upper quartile is $754)
Median rent asked for vacant for-rent units in 2022: $592
Median gross rent in Muskogee, OK in 2022: $822
Housing units in Muskogee with a mortgage: 3,823 (109 second mortgage, 5 home equity loan, 93 both second mortgage and home equity loan )Houses without a mortgage: 40
Median household income for houses/condos with a mortgage: $78,327
Median household income for apartments without a mortgage: $49,205
Median monthly housing costs: $793
Data:
Median house or condo value ($)
Median house or condo value ($ change since 2000)
Median house or condo value ($) - White
Median house or condo value ($) - Black or African American
Median house or condo value ($) - Asian
Median house or condo value ($) - Hispanic or Latino
Median house or condo value ($) - American Indian and Alaska Native
Median house or condo value ($) - Multirace
Median house or condo value ($) - Other Race
Median price asked for mobile homes ($)
Household density (households per square mile)
Mean house or condo value by units in structure - 1, detached ($)
Mean house or condo value by units in structure - 1, attached ($)
Mean house or condo value by units in structure - 2 ($)
Mean house or condo value by units in structure by units in structure - 3 or 4 ($)
Mean house or condo value by units in structure - 5 or more ($)
Mean house or condo value by units in structure - Boat, RV, van, etc. ($)
Mean house or condo value by units in structure - Mobile home ($)
Median contract rent ($)
Median contract rent - Lower quartile ($)
Median contract rent - Upper quartile ($)
Median gross rent ($)
Urban houses (%)
Rural houses (%)
Houses occupied (%)
Houses occupied (% change since 2000)
Houses owner occupied (%)
Houses owner occupied (% change since 2000)
Houses renter occupied (%)
Houses renter occupied (% change since 2000)
Vacant housing units - For rent (%)
Vacant housing units - For rent (% change since 2000)
Vacant housing units - For sale only (%)
Vacant housing units - For sale only (% change since 2000)
Vacant housing units - Rented or sold, not occupied (%)
Vacant housing units - Rented or sold, not occupied (% change since 2000)
Vacant housing units - For seasonal, recreational, or occasional use (%)
Vacant housing units - For seasonal, recreational, or occasional use (% change since 2000)
Vacant housing units - For migrant workers (%)
Vacant housing units - For migrant workers (% change since 2000)
Vacant housing units - Other vacant (%)
Vacant housing units - Other vacant (% change since 2000)
Median monthly housing costs ($)
Median household income for houses/condos with a mortgage ($)
Median household income for houses/condos without a mortgage ($)
Median household income ($)
Median household income ($) - White
Median household income ($) - Black or African American
Median household income ($) - Asian
Median household income ($) - Hispanic or Latino
Median household income ($) - American Indian and Alaska Native
Median household income ($) - Multirace
Median household income ($) - Other Race
Mortgage status - with mortgage (%)
Mortgage status - with second mortgage (%)
Mortgage status - with home equity loan (%)
Mortgage status - with both second mortgage and home equity loan (%)
Mortgage status - without a mortgage (%)
Median year house/condo built
Median year apartment built
Household type by relationship - Male householder living alone (%)
Household type by relationship - Male householder not living alone (%)
Household type by relationship - Female householder living alone (%)
Household type by relationship - Female householder not living alone (%)
Household type by relationship - Opposite-Sex spouse (%)
Household type by relationship - Same-Sex spouse (%)
Household type by relationship - Opposite-Sex unmarried partner (%)
Household type by relationship - Same-Sex unmarried partner (%)
Household type by relationship - In group quarters (%)
Size of family households - 2-person household (%)
Size of family households - 3-person household (%)
Size of family households - 4-person household (%)
Size of family households - 5-person household (%)
Size of family households - 6-person household (%)
Size of family households - 7-or-more-person household (%)
Size of nonfamily households - 1-person household (%)
Size of nonfamily households - 2-person household (%)
Size of nonfamily households - 3-person household (%)
Size of nonfamily households - 4-person household (%)
Size of nonfamily households - 5-person household (%)
Size of nonfamily households - 6-person household (%)
Size of nonfamily households - 7-or-moreperson household (%)
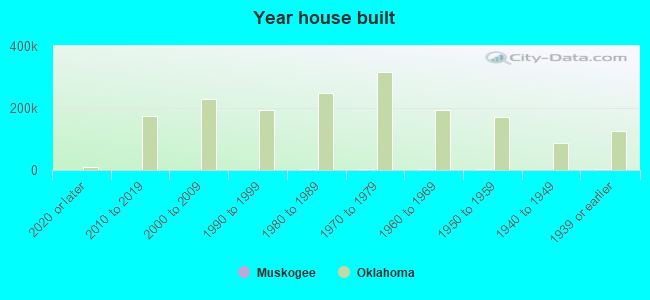
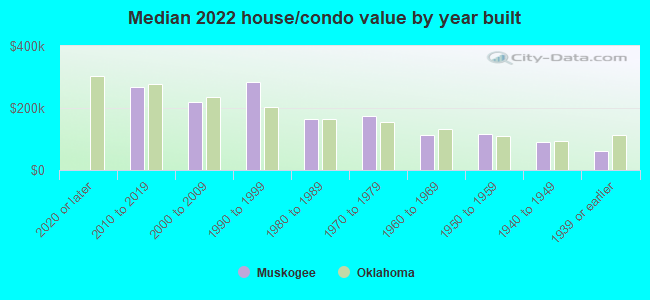
Year house built - Built 2010 or later (%)
Year house built - Built 2000 to 2009 (%)
Year house built - Built 1990 to 1999 (%)
Year house built - Built 1980 to 1989 (%)
Year house built - Built 1970 to 1979 (%)
Year house built - Built 1960 to 1969 (%)
Year house built - Built 1950 to 1959 (%)
Year house built - Built 1940 to 1949 (%)
Year house built - Built 1939 or earlier (%)
Median number of rooms in houses and condos
Median number of rooms in apartments
Median number of bedrooms in owner occupied houses
Mean number of bedrooms in owner occupied houses
Median number of bedrooms in renter occupied houses
Mean number of bedrooms in renter occupied houses
Median number of vehichles in owner occupied houses
Mean number of vehichles in owner occupied houses
Median number of vehichles in renter occupied houses
Mean number of vehichles in renter occupied houses
Rooms in owner-occupied houses - 1 room (%)
Rooms in owner-occupied houses - 2 rooms (%)
Rooms in owner-occupied houses - 3 rooms (%)
Rooms in owner-occupied houses - 4 rooms (%)
Rooms in owner-occupied houses - 5 rooms (%)
Rooms in owner-occupied houses - 6 rooms (%)
Rooms in owner-occupied houses - 7 rooms (%)
Rooms in owner-occupied houses - 8 rooms (%)
Rooms in owner-occupied houses - 9+ rooms (%)
Rooms in renter-occupied houses - 1 room (%)
Rooms in renter-occupied houses - 2 rooms (%)
Rooms in renter-occupied houses - 3 rooms (%)
Rooms in renter-occupied houses - 4 rooms (%)
Rooms in renter-occupied houses - 5 rooms (%)
Rooms in renter-occupied houses - 6 rooms (%)
Rooms in renter-occupied houses - 7 rooms (%)
Rooms in renter-occupied houses - 8 rooms (%)
Rooms in renter-occupied houses - 9+ rooms (%)
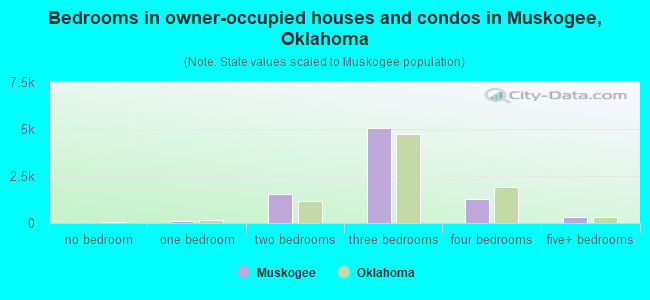
Bedrooms in owner-occupied houses - no bedrooms (%)
Bedrooms in owner-occupied houses - 1 bedroom (%)
Bedrooms in owner-occupied houses - 2 bedrooms (%)
Bedrooms in owner-occupied houses - 3 bedrooms (%)
Bedrooms in owner-occupied houses - 4 bedrooms (%)
Bedrooms in owner-occupied houses - 5+ bedrooms (%)
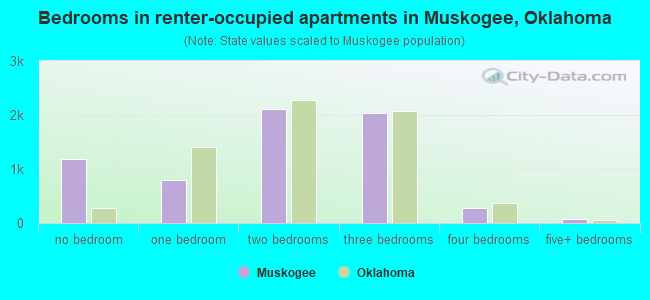
Bedrooms in renter-occupied houses - no bedrooms (%)
Bedrooms in renter-occupied houses - 1 bedroom (%)
Bedrooms in renter-occupied houses - 2 bedrooms (%)
Bedrooms in renter-occupied houses - 3 bedrooms (%)
Bedrooms in renter-occupied houses - 4 bedrooms (%)
Bedrooms in renter-occupied houses - 5+ bedrooms (%)
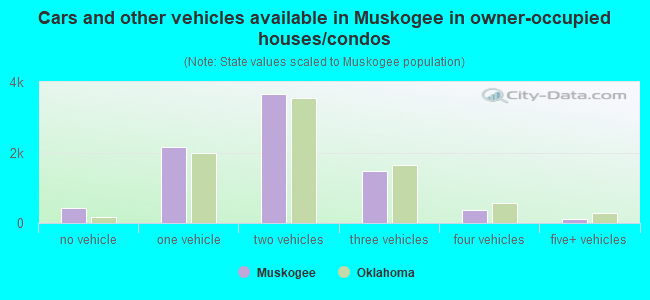
Vehicles available in owner-occupied houses - no vehicle available (%)
Vehicles available in owner-occupied houses - 1 vehicle available(%)
Vehicles available in owner-occupied houses - 2 Vehicles available (%)
Vehicles available in owner-occupied houses - 3 Vehicles available (%)
Vehicles available in owner-occupied houses - 4 Vehicles available (%)
Vehicles available in owner-occupied houses - 5+ Vehicles available (%)
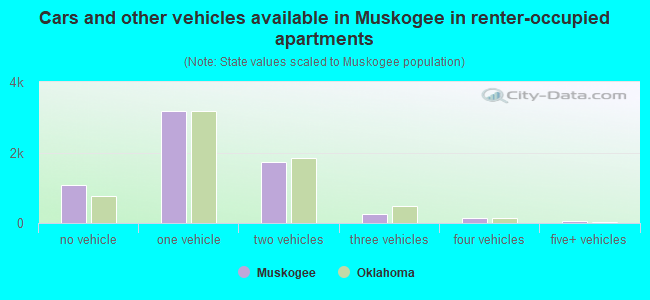
Vehicles available in renter-occupied houses - no vehicle available (%)
Vehicles available in renter-occupied houses - 1 vehicle available (%)
Vehicles available in renter-occupied houses - 2 Vehicles available (%)
Vehicles available in renter-occupied houses - 3 Vehicles available (%)
Vehicles available in renter-occupied houses - 4 Vehicles available (%)
Vehicles available in renter-occupied houses - 5+ Vehicles available (%)
Housing units in structures - 1, detached (%)
Housing units in structures - 1, attached (%)
Housing units in structures - 2 (%)
Housing units in structures - 3 or 4 (%)
Housing units in structures - 5 to 9 (%)
Housing units in structures - 10 to 19 (%)
Housing units in structures - 20 to 49 (%)
Housing units in structures - 50 or more (%)
Housing units in structures - Mobile home (%)
Housing units in structures - Boat, RV, van, etc. (%)
Housing units in structures - Owners - 1, detached (%)
Housing units in structures - Owners - 1, attached (%)
Housing units in structures - Owners - 2 (%)
Housing units in structures - Owners - 3 or 4 (%)
Housing units in structures - Owners - 5 to 9 (%)
Housing units in structures - Owners - 10 to 19 (%)
Housing units in structures - Owners - 20 to 49 (%)
Housing units in structures - Owners - 50 or more (%)
Housing units in structures - Owners - Mobile home (%)
Housing units in structures - Owners - Boat, RV, van, etc. (%)
Housing units in structures - Renters - 1, detached (%)
Housing units in structures - Renters - 1, attached (%)
Housing units in structures - Renters - 2 (%)
Housing units in structures - Renters - 3 or 4 (%)
Housing units in structures - Renters - 5 to 9 (%)
Housing units in structures - Renters - 10 to 19 (%)
Housing units in structures - Renters - 20 to 49 (%)
Housing units in structures - Renters - 50 or more (%)
Housing units in structures - Renters - Mobile home (%)
Housing units in structures - Renters - Boat, RV, van, etc. (%)
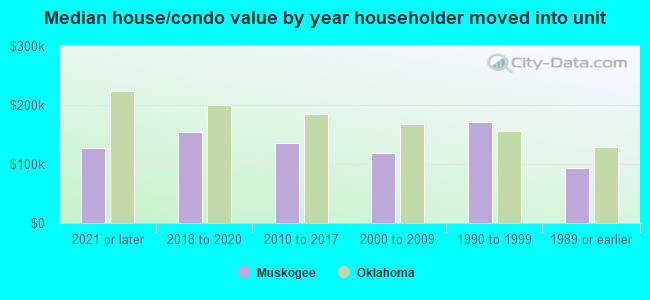
House/condo owner moved in on average (years ago)
Renter moved in on average (years ago)
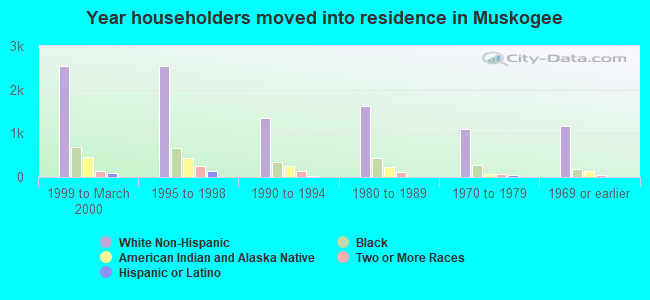
Year householder moved into unit - Moved in 1999 to March 2000 (%)
Year householder moved into unit - Moved in 1999 to March 2000 (%) - White
Year householder moved into unit - Moved in 1999 to March 2000 (%) - Black or African American
Year householder moved into unit - Moved in 1999 to March 2000 (%) - Asian
Year householder moved into unit - Moved in 1999 to March 2000 (%) - Hispanic or Latino
Year householder moved into unit - Moved in 1999 to March 2000 (%) - American Indian and Alaska Native
Year householder moved into unit - Moved in 1999 to March 2000 (%) - Multirace
Year householder moved into unit - Moved in 1999 to March 2000 (%) - Other Race
Year householder moved into unit - Moved in 1995 to 1998 (%)
Year householder moved into unit - Moved in 1995 to 1998 (%) - White
Year householder moved into unit - Moved in 1995 to 1998 (%) - Black or African American
Year householder moved into unit - Moved in 1995 to 1998 (%) - Asian
Year householder moved into unit - Moved in 1995 to 1998 (%) - Hispanic or Latino
Year householder moved into unit - Moved in 1995 to 1998 (%) - American Indian and Alaska Native
Year householder moved into unit - Moved in 1995 to 1998 (%) - Multirace
Year householder moved into unit - Moved in 1995 to 1998 (%) - Other Race
Year householder moved into unit - Moved in 1990 to 1994 (%)
Year householder moved into unit - Moved in 1990 to 1994 (%) - White
Year householder moved into unit - Moved in 1990 to 1994 (%) - Black or African American
Year householder moved into unit - Moved in 1990 to 1994 (%) - Asian
Year householder moved into unit - Moved in 1990 to 1994 (%) - Hispanic or Latino
Year householder moved into unit - Moved in 1990 to 1994 (%) - American Indian and Alaska Native
Year householder moved into unit - Moved in 1990 to 1994 (%) - Multirace
Year householder moved into unit - Moved in 1990 to 1994 (%) - Other Race
Year householder moved into unit - Moved in 1980 to 1989 (%)
Year householder moved into unit - Moved in 1980 to 1989 (%) - White
Year householder moved into unit - Moved in 1980 to 1989 (%) - Black or African American
Year householder moved into unit - Moved in 1980 to 1989 (%) - Asian
Year householder moved into unit - Moved in 1980 to 1989 (%) - Hispanic or Latino
Year householder moved into unit - Moved in 1980 to 1989 (%) - American Indian and Alaska Native
Year householder moved into unit - Moved in 1980 to 1989 (%) - Multirace
Year householder moved into unit - Moved in 1980 to 1989 (%) - Other Race
Year householder moved into unit - Moved in 1970 to 1979 (%)
Year householder moved into unit - Moved in 1970 to 1979 (%) - White
Year householder moved into unit - Moved in 1970 to 1979 (%) - Black or African American
Year householder moved into unit - Moved in 1970 to 1979 (%) - Asian
Year householder moved into unit - Moved in 1970 to 1979 (%) - Hispanic or Latino
Year householder moved into unit - Moved in 1970 to 1979 (%) - American Indian and Alaska Native
Year householder moved into unit - Moved in 1970 to 1979 (%) - Multirace
Year householder moved into unit - Moved in 1970 to 1979 (%) - Other Race
Year householder moved into unit - Moved in 1969 or earlier (%)
Year householder moved into unit - Moved in 1969 or earlier (%) - White
Year householder moved into unit - Moved in 1969 or earlier (%) - Black or African American
Year householder moved into unit - Moved in 1969 or earlier (%) - Asian
Year householder moved into unit - Moved in 1969 or earlier (%) - Hispanic or Latino
Year householder moved into unit - Moved in 1969 or earlier (%) - American Indian and Alaska Native
Year householder moved into unit - Moved in 1969 or earlier (%) - Multirace
Year householder moved into unit - Moved in 1969 or earlier (%) - Other Race
Housing units lacking complete plumbing facilities (%)
Housing units lacking complete kitchen facilities (%)
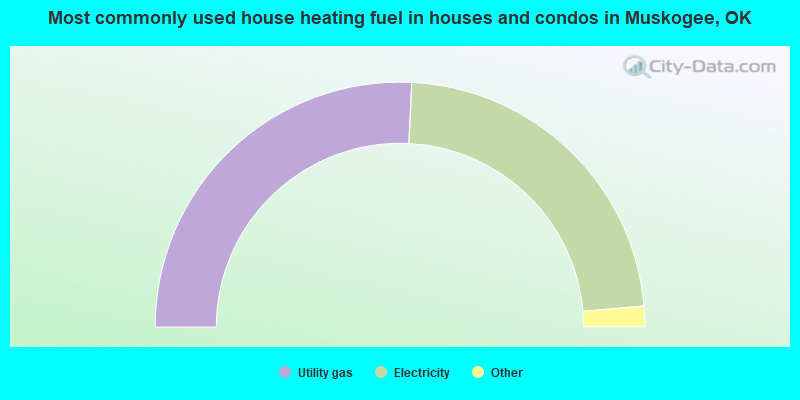
House heating fuel used in houses and condos - Utility gas (%)
House heating fuel used in houses and condos - Bottled, tank, or LP gas (%)
House heating fuel used in houses and condos - Electricity (%)
House heating fuel used in houses and condos - Fuel oil, kerosene, etc. (%)
House heating fuel used in houses and condos - Coal or coke (%)
House heating fuel used in houses and condos - Wood (%)
House heating fuel used in houses and condos - Solar energy (%)
House heating fuel used in houses and condos - Other fuel (%)
House heating fuel used in houses and condos - No fuel used (%)
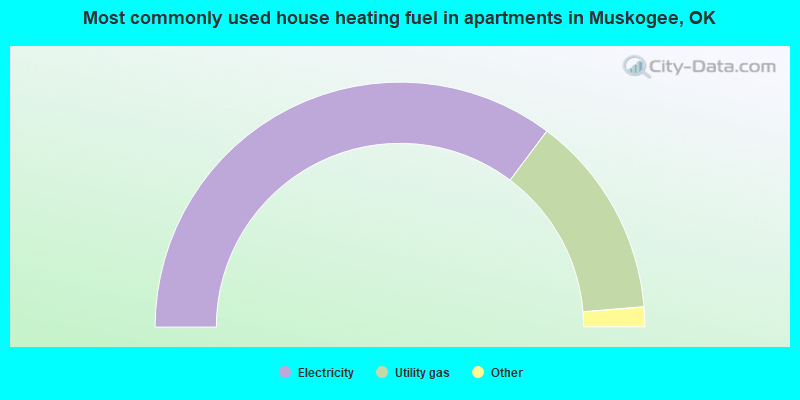
House heating fuel used in apartments - Utility gas (%)
House heating fuel used in apartments - Bottled, tank, or LP gas (%)
House heating fuel used in apartments - Electricity (%)
House heating fuel used in apartments - Fuel oil, kerosene, etc. (%)
House heating fuel used in apartments - Coal or coke (%)
House heating fuel used in apartments - Wood (%)
House heating fuel used in apartments - Solar energy (%)
House heating fuel used in apartments - Other fuel (%)
House heating fuel used in apartments - No fuel used (%)
Latest news about housing in Muskogee, OK collected exclusively by city-data.com from local newspapers, TV, and radio stations
Median year house/condo built: 1972Median year apartment built: 1975Household type by relationship:
Households: 36,793
Male householders: 6,557 (2,205 living alone ), Female householders: 7,940 (2,427 living alone )5,538 spouses (5,486 opposite-sex spouses ), 946 unmarried partners , (938 opposite-sex unmarried partners ), 10,620 children (9,630 natural , 363 adopted , 626 stepchildren ), 1,718 grandchildren , 391 brothers or sisters , 314 parents , 7 foster children , 518 other relatives , 747 non-relatives In group quarters: 1,491
Size of family households: 4,002 2-persons , 2,433 3-persons , 1,420 4-persons , 817 5-persons , 247 6-persons , 284 7-or-more-persons .
Size of nonfamily households: 4,581 1-person , 817 2-persons , 34 3-persons , 23 4-persons , 16 5-persons , 7 6-persons .
4,532 married couples with children. single-parent households (759 men , 2,875 women ).
92.5% of residents of Muskogee speak English at home. of residents speak Spanish at home (72% speak English very well , 13% speak English well , 13% speak English not well , 2% don't speak English at all ).of residents speak other Indo-European language at home (51% speak English very well , 38% speak English well , 10% speak English not well ).of residents speak Asian or Pacific Island language at home (42% speak English very well , 41% speak English well , 14% speak English not well , 3% don't speak English at all ).of residents speak other language at home (72% speak English very well , 9% speak English well , 18% speak English not well ).
Foreign born population: 1,209 (3.3%)of them are naturalized citizens )
Median number of rooms in houses and condos:
Median number of rooms in apartments
Owner-occupied Renter-occupied
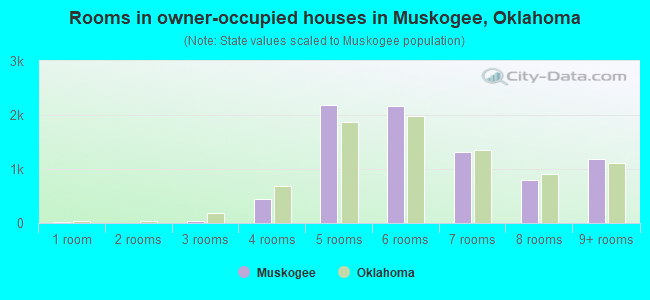
Rooms in owner-occupied houses in Muskogee, Oklahoma
13 1 room 9 2 rooms 46 3 rooms 451 4 rooms 2,184 5 rooms 2,170 6 rooms 1,323 7 rooms 790 8 rooms 1,186 9+ rooms
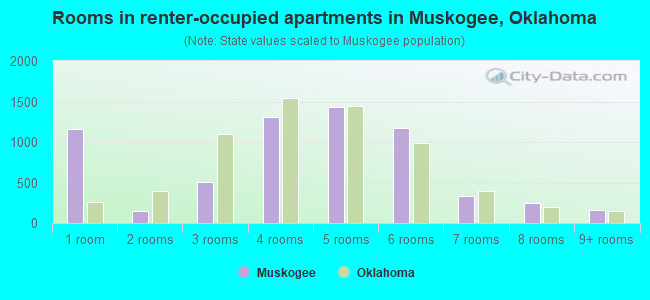
Rooms in renter-occupied apartments in Muskogee, Oklahoma
1,158 1 room 148 2 rooms 512 3 rooms 1,307 4 rooms 1,437 5 rooms 1,176 6 rooms 329 7 rooms 243 8 rooms 159 9+ rooms
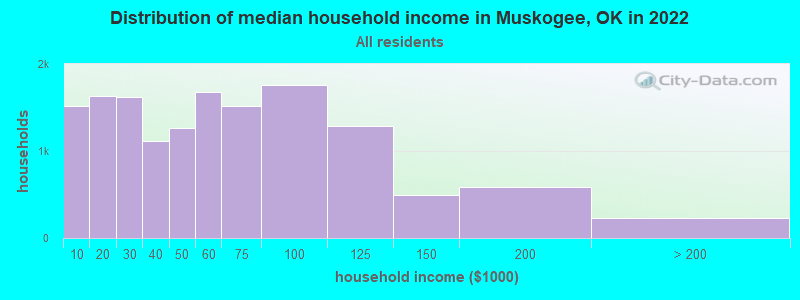
Muskogee, OK household income distribution 1,522 Less than $10,0001,637 $10,000 to $19,9991,615 $20,000 to $29,9991,115 $30,000 to $39,9991,261 $40,000 to $49,9991,681 $50,000 to $59,9991,519 $60,000 to $74,9991,755 $75,000 to $99,9991,282 $100,000 to $124,999499 $125,000 to $149,999587 $150,000 to $199,999233 $200,000 or more
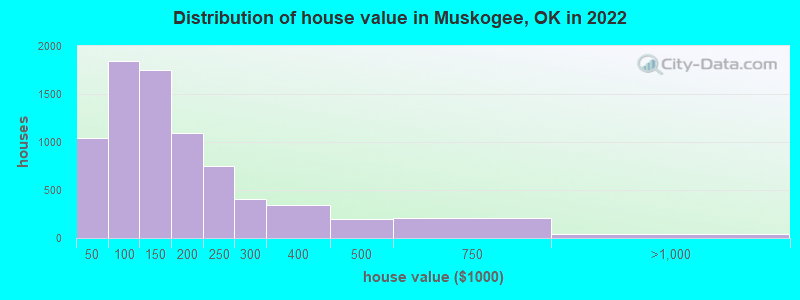
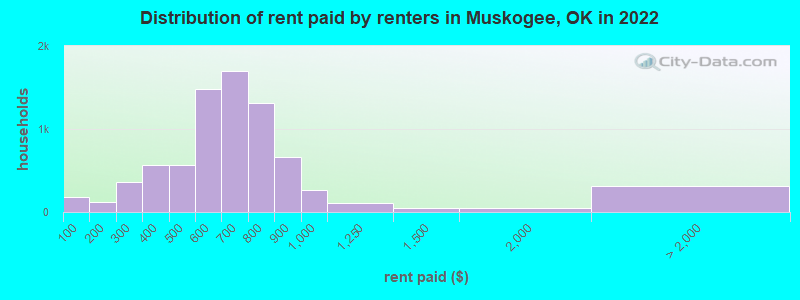
Home value of owner - occupied houses in 2022 in Muskogee, OK 86 Less than $10,000142 $10,000 to $14,999168 $15,000 to $19,99971 $20,000 to $24,99989 $25,000 to $29,999231 $30,000 to $34,99919 $35,000 to $39,999232 $40,000 to $49,999283 $50,000 to $59,999344 $60,000 to $69,999218 $70,000 to $79,999448 $80,000 to $89,999315 $90,000 to $99,999935 $100,000 to $124,999815 $125,000 to $149,999629 $150,000 to $174,999463 $175,000 to $199,999754 $200,000 to $249,999404 $250,000 to $299,999339 $300,000 to $399,999203 $400,000 to $499,999206 $500,000 to $749,99938 $750,000 to $999,9995 $2,000,000 or moreRent paid by renters in 2022 in Muskogee, OK 176 Less than $10087 $100 to $14932 $150 to $199111 $200 to $249252 $250 to $299257 $300 to $349311 $350 to $399322 $400 to $449243 $450 to $499940 $500 to $549539 $550 to $599921 $600 to $649778 $650 to $699621 $700 to $749686 $750 to $799663 $800 to $899265 $900 to $999109 $1,000 to $1,24946 $1,250 to $1,49952 $1,500 to $1,9997 $2,500 to $2,99929 $3,000 to $3,499282 No cash rent
Percentage of workers working in this county: 83.9%Number of people working at home: 1,034 (6.9% of all workers )
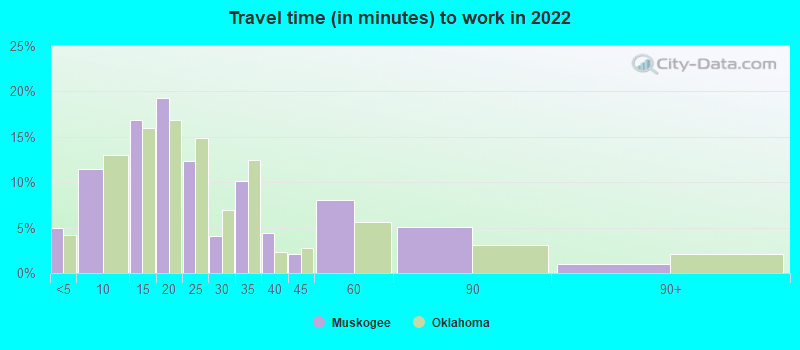
Travel time to work (commute)
Less than 5 minutes: 8915 to 9 minutes: 2,50410 to 14 minutes: 3,45515 to 19 minutes: 3,51020 to 24 minutes: 1,14625 to 29 minutes: 23730 to 34 minutes: 81135 to 39 minutes: 18440 to 44 minutes: 22945 to 59 minutes: 87960 to 89 minutes: 22990 or more minutes: 119
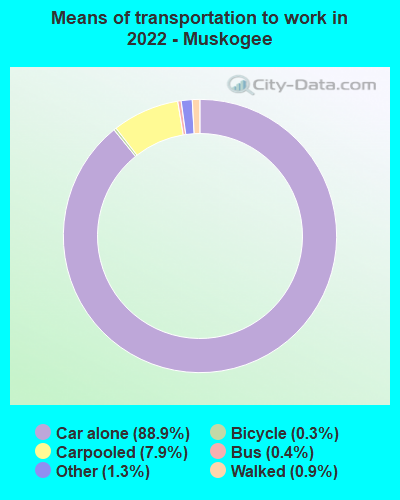
Means of transportation to work:
Drove a car alone: 18,316 (83.6%)Carpooled: 1,665 (7.6%)Bus : 75 (0.3%)Subway or elevated rail : 17 (0.1%)Taxi: 264 (1.2%)Bicycle: 70 (0.3%)Walked: 197 (0.9%)Worked at home: 1,034 (4.7%)
Unemployment by race in 2022
Unemployment rate for White non-Hispanic residents 5.9% Males8.0% FemalesUnemployment rate for Black residents 7.8% Males4.5% FemalesUnemployment rate for American Indian and Alaska Native residents 5.6% Males8.5% FemalesUnemployment rate for Asian residents 12.2% FemalesUnemployment rate for other race residents 1.9% Males3.9% FemalesUnemployment rate for two or more race residents 2.7% Males5.5% FemalesUnemployment rate for Hispanic or Latino residents 4.4% Males5.2% Females
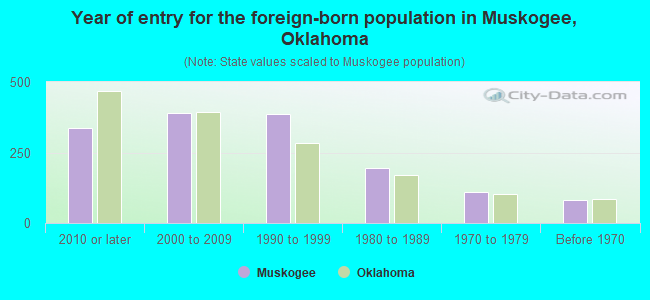
Year of entry for the foreign-born population in Muskogee, Oklahoma
337 2010 or later 391 2000 to 2009 385 1990 to 1999 195 1980 to 1989 111 1970 to 1979 83 Before 1970
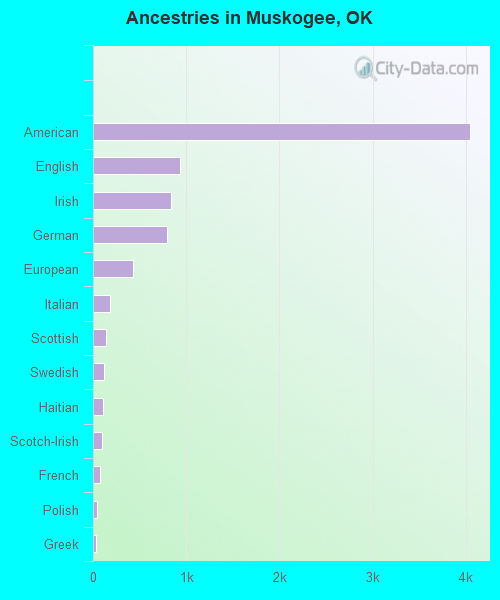
First ancestries reported:
American: 4,047 (19.2%)
English: 937 (4.5%)
Irish: 832 (4.0%)
German: 794 (3.8%)
European: 427 (2.0%)
Italian: 183 (0.9%)
Scottish: 142 (0.7%)
Swedish: 123 (0.6%)
Haitian: 111 (0.5%)
Scotch-Irish: 98 (0.5%)
French: 71 (0.3%)
Polish: 38 (0.2%)
Greek: 37 (0.2%)
Finnish: 26 (0.1%)
Israeli: 24 (0.1%)
Dutch West Indian: 21 (0.10%)
Danish: 18 (0.09%)
Eastern European: 18 (0.09%)
Welsh: 18 (0.09%)
Canadian: 17 (0.08%)
Lebanese: 16 (0.08%)
Dutch: 15 (0.07%)
Scandinavian: 12 (0.06%)
Celtic: 11 (0.05%)
African: 11 (0.05%)
Jamaican: 11 (0.05%)
British: 10 (0.05%)
French Canadian: 9 (0.04%)
Russian: 8 (0.04%)
Norwegian: 7 (0.03%)
Northern European: 4 (0.02%) Most common places of birth for foreign-born residents (%): Mexico Muskogee:
50.1% (689)Oklahoma:
42.4% (103,425)
Guatemala Muskogee:
11.9% (163)Oklahoma:
4.2% (10,287)
Vietnam Muskogee:
5.9% (81)Oklahoma:
5.6% (13,699)
Korea Muskogee:
4.5% (62)Oklahoma:
1.7% (4,140)
Haiti Muskogee:
3.8% (52)Oklahoma:
0.1% (209)
Philippines Muskogee:
3.5% (48)Oklahoma:
2.3% (5,671)
Honduras Muskogee:
2.2% (30)Oklahoma:
1.7% (4,239)
Taiwan Muskogee:
2.0% (27)Oklahoma:
0.4% (964)
Brazil Muskogee:
2.0% (27)Oklahoma:
0.6% (1,363)
Colombia Muskogee:
1.9% (26)Oklahoma:
0.8% (1,892)
Place of birth for U.S.-born residents:
This state: 24,653Other state: 10,607Northeast: 705Midwest: 2,440South: 4,124West: 3,330 84.4% of Muskogee residents lived in the same house 1 years ago.
Out of people who lived in different houses, 34.6% lived in this county.
Out of people who lived in different counties, 73.6% lived in Oklahoma.
Muskogee:
84.4%State average:
85.5%
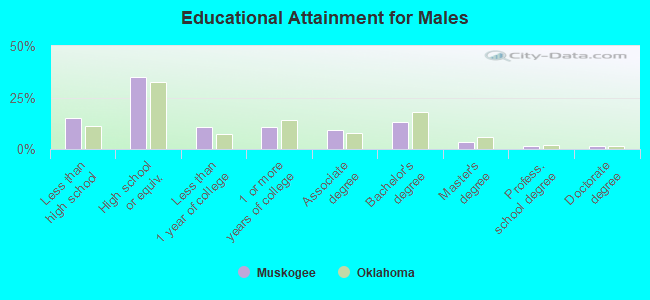
Education attainment for males 25 years and older:
No schooling: 258Nursery to 4th grade: 425th and 6th grade: 547th and 8th grade: 2349th grade: 14410th grade: 15911th grade: 32212th grade, no diploma: 495High school graduate (or equivalency): 3,920Less than 1 year of college: 1,216Some college more than 1 year, no degree: 1,193Associate degree: 1,008Bachelor's degree: 1,453Master's degree: 357Professional school degree: 184Doctorate degree: 149
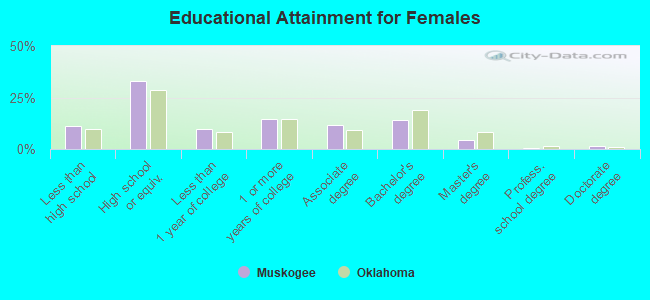
Education attainment for females 25 years and older:
No schooling: 132Nursery to 4th grade: 305th and 6th grade: 2117th and 8th grade: 1489th grade: 14210th grade: 18711th grade: 27712th grade, no diploma: 291High school graduate (or equivalency): 4,170Less than 1 year of college: 1,219Some college more than 1 year, no degree: 1,815Associate degree: 1,472Bachelor's degree: 1,766Master's degree: 526Professional school degree: 39Doctorate degree: 167
Housing units in structures:
One, detached: 12,664One, attached: 321Two: 3623 or 4: 4785 to 9: 65110 to 19: 73320 to 49: 54550 or more: 587Mobile homes: 652Boats, RVs, vans, etc.: 14Median worth of mobile homes: $40,662
Housing units lacking complete plumbing facilities in 2022: 5.9%Housing units lacking complete kitchen facilities in 2022: 5.4%House/condo owner moved in on average 11 years ago
Renter moved in on average 3 years ago
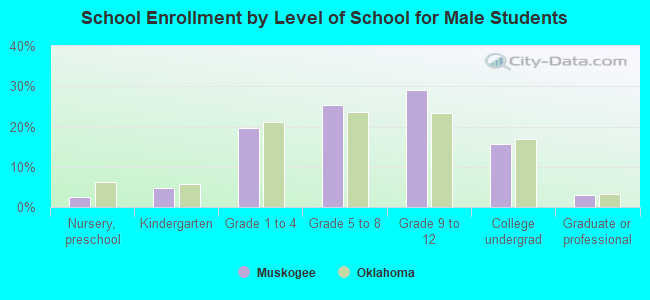
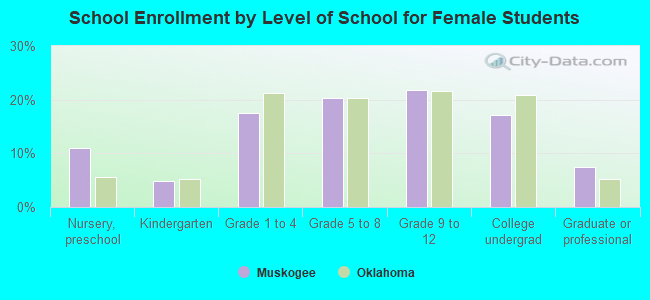
Private vs. public school enrollment:
Students in private schools in grades 1 to 8 (elementary and middle school): 255 Students in private schools in grades 9 to 12 (high school): 190 Students in private undergraduate colleges: 219