Nanticoke, PA (Pennsylvania) Houses and Residents
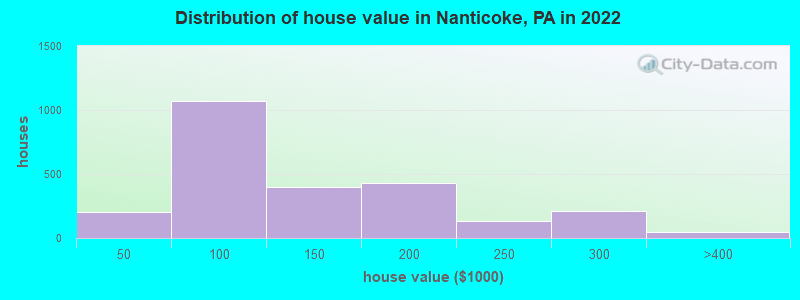
Estimated median house or condo value in 2022: $106,612 (it was $66,700 in 2000 )
Nanticoke:
$106,612Pennsylvania:
$245,500
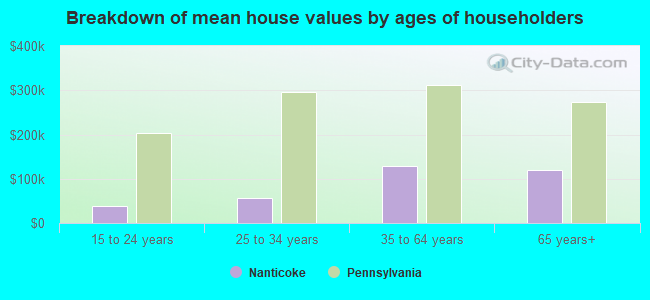
Lower value quartile - upper value quartile: $81,707 - $168,633Mean price in 2022: Detached houses: $132,663 Here:
$132,663State:
$317,202
Townhouses or other attached units: $87,281 Here:
$87,281State:
$254,369
In 2-unit structures: $45,804 Here:
$45,804State:
$249,182
In 3-to-4-unit structures: $159,535 Here:
$159,535State:
$297,446
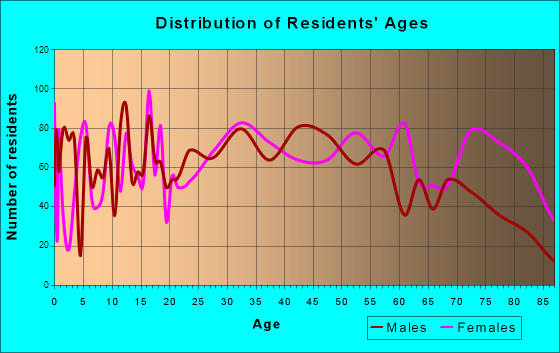
Total population: 10,301 (All urban)
Houses: 5,164 (4,410 occupied: 2,674 owner occupied, 1,796 renter occupied )
% of renters here:
40%State:
31%
Housing density: 1,473 houses/condos per square mile
Median price asked for vacant for-sale houses and condos in 2022: $466,262.
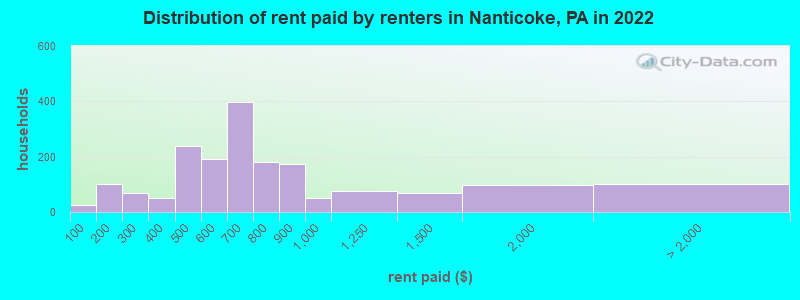
Median contract rent in 2022: $651 (lower quartile is $480, upper quartile is $832)
Median rent asked for vacant for-rent units in 2022: $696
Median gross rent in Nanticoke, PA in 2022: $802
Housing units in Nanticoke with a mortgage: 1,265 (133 second mortgage, 0 home equity loan, 103 both second mortgage and home equity loan )Houses without a mortgage: 80
Median household income for houses/condos with a mortgage: $86,263
Median household income for apartments without a mortgage: $56,837
Median monthly housing costs: $756
Data:
Median house or condo value ($)
Median house or condo value ($ change since 2000)
Median house or condo value ($) - White
Median house or condo value ($) - Black or African American
Median house or condo value ($) - Asian
Median house or condo value ($) - Hispanic or Latino
Median house or condo value ($) - American Indian and Alaska Native
Median house or condo value ($) - Multirace
Median house or condo value ($) - Other Race
Median price asked for mobile homes ($)
Household density (households per square mile)
Mean house or condo value by units in structure - 1, detached ($)
Mean house or condo value by units in structure - 1, attached ($)
Mean house or condo value by units in structure - 2 ($)
Mean house or condo value by units in structure by units in structure - 3 or 4 ($)
Mean house or condo value by units in structure - 5 or more ($)
Mean house or condo value by units in structure - Boat, RV, van, etc. ($)
Mean house or condo value by units in structure - Mobile home ($)
Median contract rent ($)
Median contract rent - Lower quartile ($)
Median contract rent - Upper quartile ($)
Median gross rent ($)
Urban houses (%)
Rural houses (%)
Houses occupied (%)
Houses occupied (% change since 2000)
Houses owner occupied (%)
Houses owner occupied (% change since 2000)
Houses renter occupied (%)
Houses renter occupied (% change since 2000)
Vacant housing units - For rent (%)
Vacant housing units - For rent (% change since 2000)
Vacant housing units - For sale only (%)
Vacant housing units - For sale only (% change since 2000)
Vacant housing units - Rented or sold, not occupied (%)
Vacant housing units - Rented or sold, not occupied (% change since 2000)
Vacant housing units - For seasonal, recreational, or occasional use (%)
Vacant housing units - For seasonal, recreational, or occasional use (% change since 2000)
Vacant housing units - For migrant workers (%)
Vacant housing units - For migrant workers (% change since 2000)
Vacant housing units - Other vacant (%)
Vacant housing units - Other vacant (% change since 2000)
Median monthly housing costs ($)
Median household income for houses/condos with a mortgage ($)
Median household income for houses/condos without a mortgage ($)
Median household income ($)
Median household income ($) - White
Median household income ($) - Black or African American
Median household income ($) - Asian
Median household income ($) - Hispanic or Latino
Median household income ($) - American Indian and Alaska Native
Median household income ($) - Multirace
Median household income ($) - Other Race
Mortgage status - with mortgage (%)
Mortgage status - with second mortgage (%)
Mortgage status - with home equity loan (%)
Mortgage status - with both second mortgage and home equity loan (%)
Mortgage status - without a mortgage (%)
Median year house/condo built
Median year apartment built
Household type by relationship - Male householder living alone (%)
Household type by relationship - Male householder not living alone (%)
Household type by relationship - Female householder living alone (%)
Household type by relationship - Female householder not living alone (%)
Household type by relationship - Opposite-Sex spouse (%)
Household type by relationship - Same-Sex spouse (%)
Household type by relationship - Opposite-Sex unmarried partner (%)
Household type by relationship - Same-Sex unmarried partner (%)
Household type by relationship - In group quarters (%)
Size of family households - 2-person household (%)
Size of family households - 3-person household (%)
Size of family households - 4-person household (%)
Size of family households - 5-person household (%)
Size of family households - 6-person household (%)
Size of family households - 7-or-more-person household (%)
Size of nonfamily households - 1-person household (%)
Size of nonfamily households - 2-person household (%)
Size of nonfamily households - 3-person household (%)
Size of nonfamily households - 4-person household (%)
Size of nonfamily households - 5-person household (%)
Size of nonfamily households - 6-person household (%)
Size of nonfamily households - 7-or-moreperson household (%)
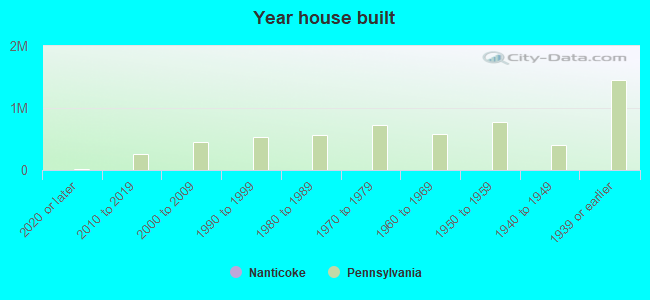
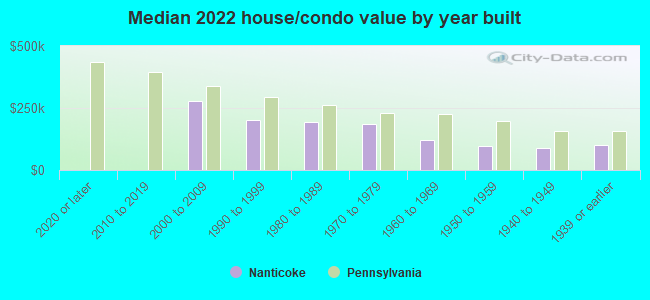
Year house built - Built 2010 or later (%)
Year house built - Built 2000 to 2009 (%)
Year house built - Built 1990 to 1999 (%)
Year house built - Built 1980 to 1989 (%)
Year house built - Built 1970 to 1979 (%)
Year house built - Built 1960 to 1969 (%)
Year house built - Built 1950 to 1959 (%)
Year house built - Built 1940 to 1949 (%)
Year house built - Built 1939 or earlier (%)
Median number of rooms in houses and condos
Median number of rooms in apartments
Median number of bedrooms in owner occupied houses
Mean number of bedrooms in owner occupied houses
Median number of bedrooms in renter occupied houses
Mean number of bedrooms in renter occupied houses
Median number of vehichles in owner occupied houses
Mean number of vehichles in owner occupied houses
Median number of vehichles in renter occupied houses
Mean number of vehichles in renter occupied houses
Rooms in owner-occupied houses - 1 room (%)
Rooms in owner-occupied houses - 2 rooms (%)
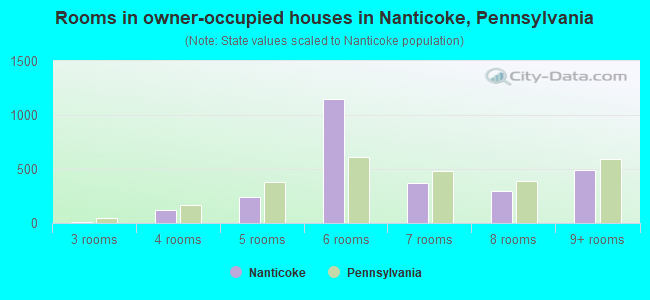
Rooms in owner-occupied houses - 3 rooms (%)
Rooms in owner-occupied houses - 4 rooms (%)
Rooms in owner-occupied houses - 5 rooms (%)
Rooms in owner-occupied houses - 6 rooms (%)
Rooms in owner-occupied houses - 7 rooms (%)
Rooms in owner-occupied houses - 8 rooms (%)
Rooms in owner-occupied houses - 9+ rooms (%)
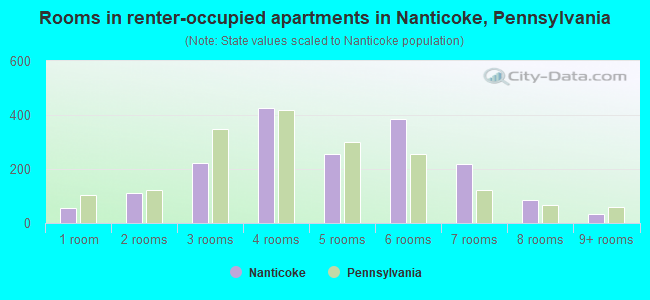
Rooms in renter-occupied houses - 1 room (%)
Rooms in renter-occupied houses - 2 rooms (%)
Rooms in renter-occupied houses - 3 rooms (%)
Rooms in renter-occupied houses - 4 rooms (%)
Rooms in renter-occupied houses - 5 rooms (%)
Rooms in renter-occupied houses - 6 rooms (%)
Rooms in renter-occupied houses - 7 rooms (%)
Rooms in renter-occupied houses - 8 rooms (%)
Rooms in renter-occupied houses - 9+ rooms (%)
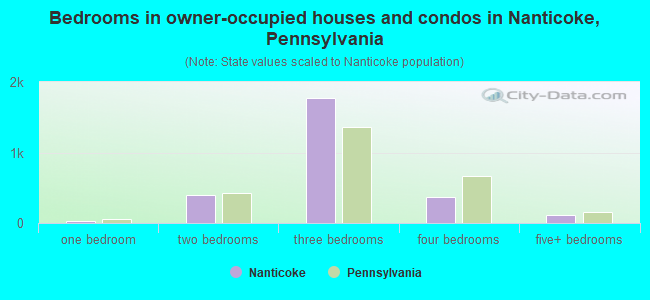
Bedrooms in owner-occupied houses - no bedrooms (%)
Bedrooms in owner-occupied houses - 1 bedroom (%)
Bedrooms in owner-occupied houses - 2 bedrooms (%)
Bedrooms in owner-occupied houses - 3 bedrooms (%)
Bedrooms in owner-occupied houses - 4 bedrooms (%)
Bedrooms in owner-occupied houses - 5+ bedrooms (%)
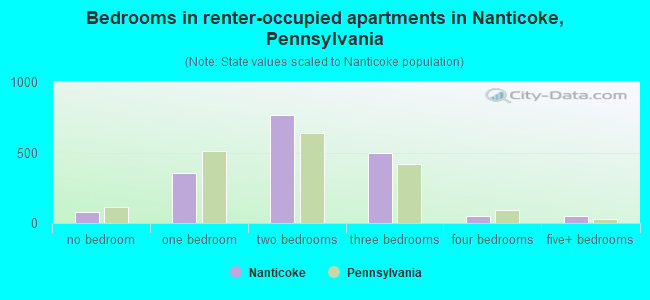
Bedrooms in renter-occupied houses - no bedrooms (%)
Bedrooms in renter-occupied houses - 1 bedroom (%)
Bedrooms in renter-occupied houses - 2 bedrooms (%)
Bedrooms in renter-occupied houses - 3 bedrooms (%)
Bedrooms in renter-occupied houses - 4 bedrooms (%)
Bedrooms in renter-occupied houses - 5+ bedrooms (%)
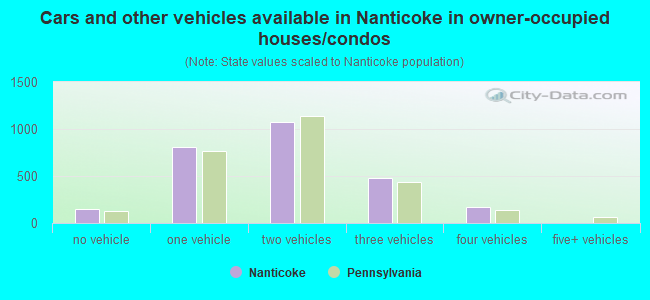
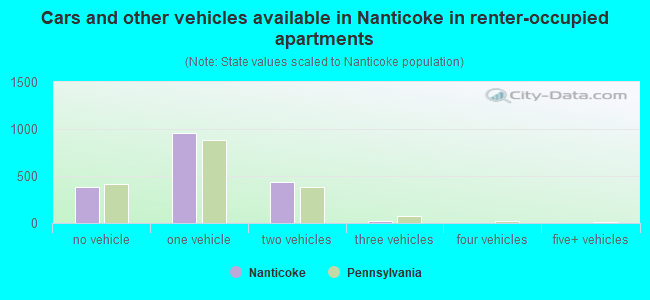
Vehicles available in owner-occupied houses - no vehicle available (%)
Vehicles available in owner-occupied houses - 1 vehicle available(%)
Vehicles available in owner-occupied houses - 2 Vehicles available (%)
Vehicles available in owner-occupied houses - 3 Vehicles available (%)
Vehicles available in owner-occupied houses - 4 Vehicles available (%)
Vehicles available in owner-occupied houses - 5+ Vehicles available (%)
Vehicles available in renter-occupied houses - no vehicle available (%)
Vehicles available in renter-occupied houses - 1 vehicle available (%)
Vehicles available in renter-occupied houses - 2 Vehicles available (%)
Vehicles available in renter-occupied houses - 3 Vehicles available (%)
Vehicles available in renter-occupied houses - 4 Vehicles available (%)
Vehicles available in renter-occupied houses - 5+ Vehicles available (%)
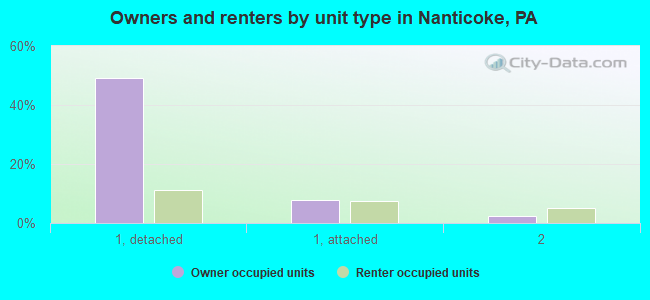
Housing units in structures - 1, detached (%)
Housing units in structures - 1, attached (%)
Housing units in structures - 2 (%)
Housing units in structures - 3 or 4 (%)
Housing units in structures - 5 to 9 (%)
Housing units in structures - 10 to 19 (%)
Housing units in structures - 20 to 49 (%)
Housing units in structures - 50 or more (%)
Housing units in structures - Mobile home (%)
Housing units in structures - Boat, RV, van, etc. (%)
Housing units in structures - Owners - 1, detached (%)
Housing units in structures - Owners - 1, attached (%)
Housing units in structures - Owners - 2 (%)
Housing units in structures - Owners - 3 or 4 (%)
Housing units in structures - Owners - 5 to 9 (%)
Housing units in structures - Owners - 10 to 19 (%)
Housing units in structures - Owners - 20 to 49 (%)
Housing units in structures - Owners - 50 or more (%)
Housing units in structures - Owners - Mobile home (%)
Housing units in structures - Owners - Boat, RV, van, etc. (%)
Housing units in structures - Renters - 1, detached (%)
Housing units in structures - Renters - 1, attached (%)
Housing units in structures - Renters - 2 (%)
Housing units in structures - Renters - 3 or 4 (%)
Housing units in structures - Renters - 5 to 9 (%)
Housing units in structures - Renters - 10 to 19 (%)
Housing units in structures - Renters - 20 to 49 (%)
Housing units in structures - Renters - 50 or more (%)
Housing units in structures - Renters - Mobile home (%)
Housing units in structures - Renters - Boat, RV, van, etc. (%)
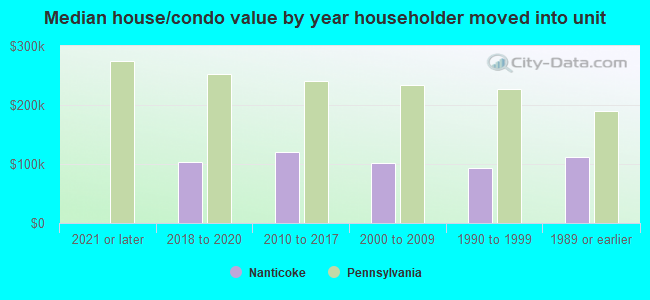
House/condo owner moved in on average (years ago)
Renter moved in on average (years ago)
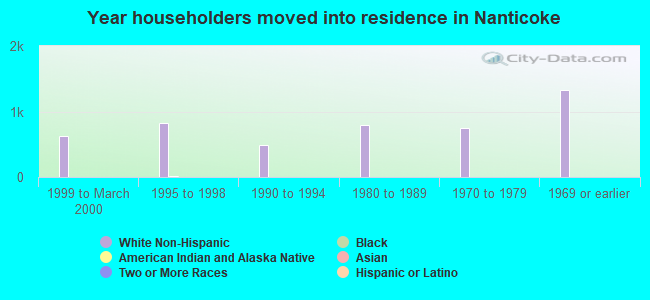
Year householder moved into unit - Moved in 1999 to March 2000 (%)
Year householder moved into unit - Moved in 1999 to March 2000 (%) - White
Year householder moved into unit - Moved in 1999 to March 2000 (%) - Black or African American
Year householder moved into unit - Moved in 1999 to March 2000 (%) - Asian
Year householder moved into unit - Moved in 1999 to March 2000 (%) - Hispanic or Latino
Year householder moved into unit - Moved in 1999 to March 2000 (%) - American Indian and Alaska Native
Year householder moved into unit - Moved in 1999 to March 2000 (%) - Multirace
Year householder moved into unit - Moved in 1999 to March 2000 (%) - Other Race
Year householder moved into unit - Moved in 1995 to 1998 (%)
Year householder moved into unit - Moved in 1995 to 1998 (%) - White
Year householder moved into unit - Moved in 1995 to 1998 (%) - Black or African American
Year householder moved into unit - Moved in 1995 to 1998 (%) - Asian
Year householder moved into unit - Moved in 1995 to 1998 (%) - Hispanic or Latino
Year householder moved into unit - Moved in 1995 to 1998 (%) - American Indian and Alaska Native
Year householder moved into unit - Moved in 1995 to 1998 (%) - Multirace
Year householder moved into unit - Moved in 1995 to 1998 (%) - Other Race
Year householder moved into unit - Moved in 1990 to 1994 (%)
Year householder moved into unit - Moved in 1990 to 1994 (%) - White
Year householder moved into unit - Moved in 1990 to 1994 (%) - Black or African American
Year householder moved into unit - Moved in 1990 to 1994 (%) - Asian
Year householder moved into unit - Moved in 1990 to 1994 (%) - Hispanic or Latino
Year householder moved into unit - Moved in 1990 to 1994 (%) - American Indian and Alaska Native
Year householder moved into unit - Moved in 1990 to 1994 (%) - Multirace
Year householder moved into unit - Moved in 1990 to 1994 (%) - Other Race
Year householder moved into unit - Moved in 1980 to 1989 (%)
Year householder moved into unit - Moved in 1980 to 1989 (%) - White
Year householder moved into unit - Moved in 1980 to 1989 (%) - Black or African American
Year householder moved into unit - Moved in 1980 to 1989 (%) - Asian
Year householder moved into unit - Moved in 1980 to 1989 (%) - Hispanic or Latino
Year householder moved into unit - Moved in 1980 to 1989 (%) - American Indian and Alaska Native
Year householder moved into unit - Moved in 1980 to 1989 (%) - Multirace
Year householder moved into unit - Moved in 1980 to 1989 (%) - Other Race
Year householder moved into unit - Moved in 1970 to 1979 (%)
Year householder moved into unit - Moved in 1970 to 1979 (%) - White
Year householder moved into unit - Moved in 1970 to 1979 (%) - Black or African American
Year householder moved into unit - Moved in 1970 to 1979 (%) - Asian
Year householder moved into unit - Moved in 1970 to 1979 (%) - Hispanic or Latino
Year householder moved into unit - Moved in 1970 to 1979 (%) - American Indian and Alaska Native
Year householder moved into unit - Moved in 1970 to 1979 (%) - Multirace
Year householder moved into unit - Moved in 1970 to 1979 (%) - Other Race
Year householder moved into unit - Moved in 1969 or earlier (%)
Year householder moved into unit - Moved in 1969 or earlier (%) - White
Year householder moved into unit - Moved in 1969 or earlier (%) - Black or African American
Year householder moved into unit - Moved in 1969 or earlier (%) - Asian
Year householder moved into unit - Moved in 1969 or earlier (%) - Hispanic or Latino
Year householder moved into unit - Moved in 1969 or earlier (%) - American Indian and Alaska Native
Year householder moved into unit - Moved in 1969 or earlier (%) - Multirace
Year householder moved into unit - Moved in 1969 or earlier (%) - Other Race
Housing units lacking complete plumbing facilities (%)
Housing units lacking complete kitchen facilities (%)
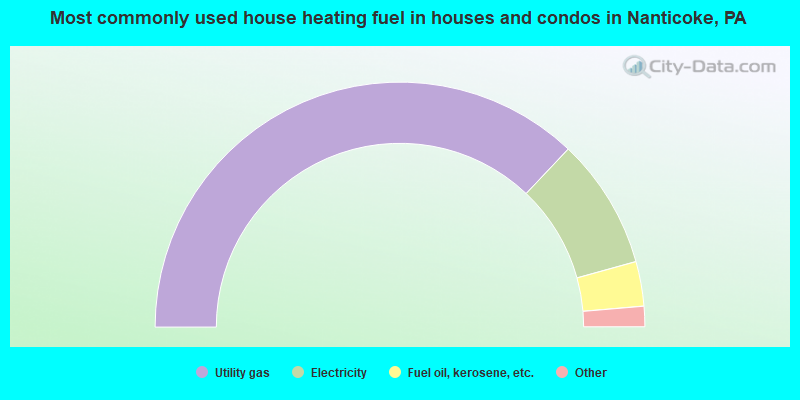
House heating fuel used in houses and condos - Utility gas (%)
House heating fuel used in houses and condos - Bottled, tank, or LP gas (%)
House heating fuel used in houses and condos - Electricity (%)
House heating fuel used in houses and condos - Fuel oil, kerosene, etc. (%)
House heating fuel used in houses and condos - Coal or coke (%)
House heating fuel used in houses and condos - Wood (%)
House heating fuel used in houses and condos - Solar energy (%)
House heating fuel used in houses and condos - Other fuel (%)
House heating fuel used in houses and condos - No fuel used (%)
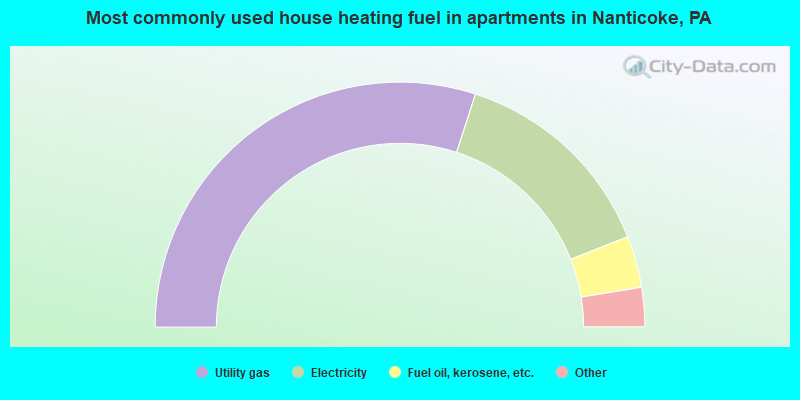
House heating fuel used in apartments - Utility gas (%)
House heating fuel used in apartments - Bottled, tank, or LP gas (%)
House heating fuel used in apartments - Electricity (%)
House heating fuel used in apartments - Fuel oil, kerosene, etc. (%)
House heating fuel used in apartments - Coal or coke (%)
House heating fuel used in apartments - Wood (%)
House heating fuel used in apartments - Solar energy (%)
House heating fuel used in apartments - Other fuel (%)
House heating fuel used in apartments - No fuel used (%)
Latest news about housing in Nanticoke, PA collected exclusively by city-data.com from local newspapers, TV, and radio stations
Median year house/condo built: 1940Median year apartment built: 1960Household type by relationship:
Households: 10,637
Male householders: 2,073 (661 living alone ), Female householders: 2,336 (678 living alone )1,623 spouses (1,554 opposite-sex spouses ), 466 unmarried partners , (444 opposite-sex unmarried partners ), 3,019 children (2,860 natural , 14 adopted , 144 stepchildren ), 251 grandchildren , 76 brothers or sisters , 215 parents , 30 foster children , 117 other relatives , 292 non-relatives In group quarters: 134
Size of family households: 1,190 2-persons , 815 3-persons , 382 4-persons , 239 5-persons , 59 6-persons , 31 7-or-more-persons .
Size of nonfamily households: 1,292 1-person , 368 2-persons , 48 3-persons , 6 4-persons , 18 6-persons .
841 married couples with children. single-parent households (481 men , 713 women ).
90.5% of residents of Nanticoke speak English at home. of residents speak Spanish at home (72% speak English very well , 11% speak English well , 16% speak English not well ).of residents speak other Indo-European language at home (89% speak English very well , 11% speak English well ).
Foreign born population: 387 (3.6%)of them are naturalized citizens )
Median number of rooms in houses and condos:
Median number of rooms in apartments
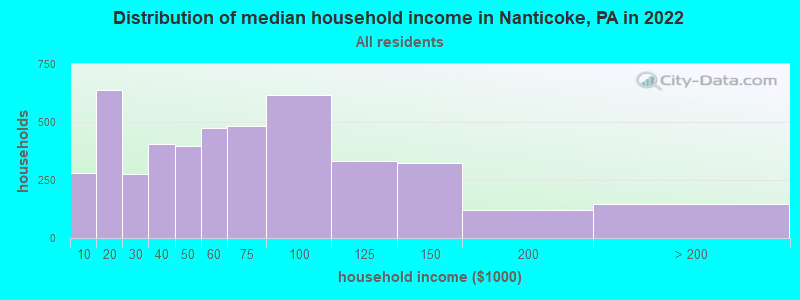
Nanticoke, PA household income distribution 279 Less than $10,000638 $10,000 to $19,999274 $20,000 to $29,999407 $30,000 to $39,999397 $40,000 to $49,999476 $50,000 to $59,999483 $60,000 to $74,999617 $75,000 to $99,999332 $100,000 to $124,999325 $125,000 to $149,999121 $150,000 to $199,999145 $200,000 or more
Home value of owner - occupied houses in 2022 in Nanticoke, PA 33 Less than $10,00017 $10,000 to $14,9996 $15,000 to $19,99931 $20,000 to $24,9999 $25,000 to $29,9993 $30,000 to $34,99917 $35,000 to $39,99981 $40,000 to $49,99995 $50,000 to $59,999125 $60,000 to $69,999294 $70,000 to $79,999203 $80,000 to $89,999265 $90,000 to $99,999288 $100,000 to $124,999110 $125,000 to $149,999299 $150,000 to $174,999129 $175,000 to $199,999129 $200,000 to $249,999212 $250,000 to $299,99949 $300,000 to $399,999Rent paid by renters in 2022 in Nanticoke, PA 27 Less than $10010 $100 to $14991 $150 to $19939 $200 to $24930 $250 to $29924 $300 to $34927 $350 to $399101 $400 to $449138 $450 to $499148 $500 to $54944 $550 to $599272 $600 to $649124 $650 to $699127 $700 to $74953 $750 to $799171 $800 to $89952 $900 to $99976 $1,000 to $1,24967 $1,250 to $1,49995 $1,500 to $1,999101 No cash rent
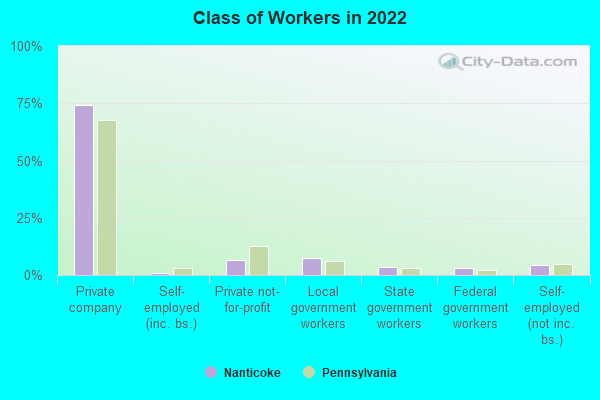
Percentage of workers working in this county: 89.0%Number of people working at home: 358 (7.2% of all workers )
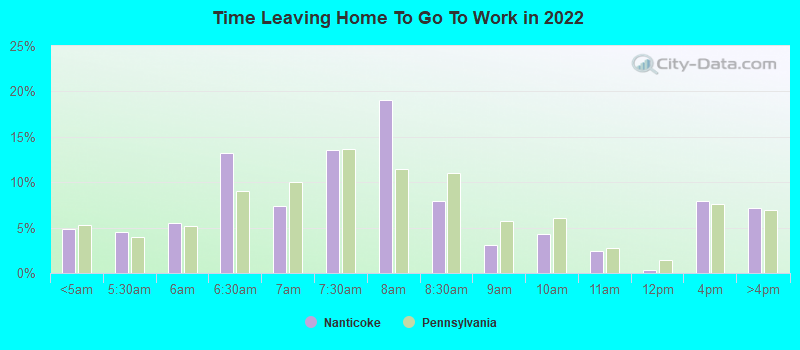
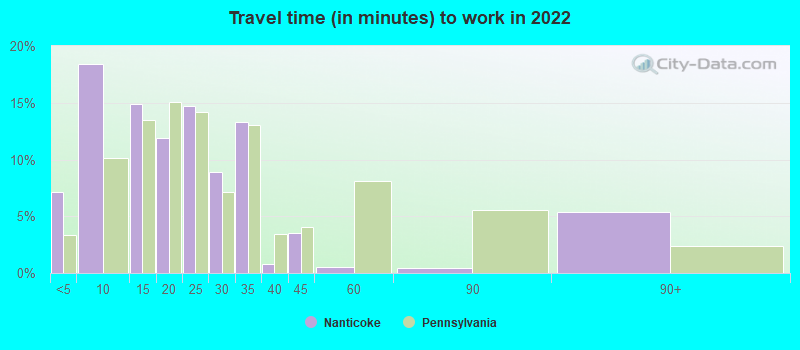
Travel time to work (commute)
Less than 5 minutes: 2265 to 9 minutes: 57710 to 14 minutes: 57215 to 19 minutes: 60420 to 24 minutes: 1,02625 to 29 minutes: 49930 to 34 minutes: 41235 to 39 minutes: 14140 to 44 minutes: 14745 to 59 minutes: 20260 to 89 minutes: 16890 or more minutes: 70
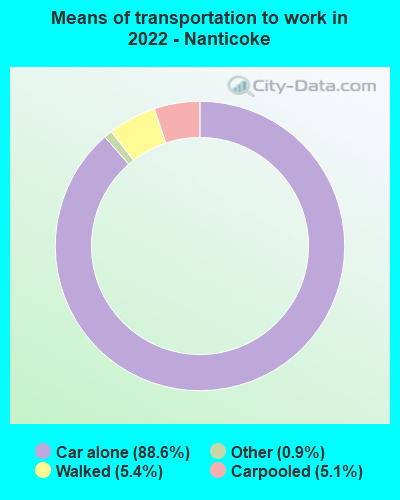
Means of transportation to work:
Drove a car alone: 1,974 (76.4%)Carpooled: 121 (4.7%)Taxi: 22 (0.9%)Walked: 113 (4.4%)Worked at home: 358 (13.9%)
Unemployment by race in 2022
Unemployment rate for White non-Hispanic residents 3.7% Males7.9% FemalesUnemployment rate for American Indian and Alaska Native residents 100.0% FemalesUnemployment rate for Hispanic or Latino residents 3.2% Males1.7% Females
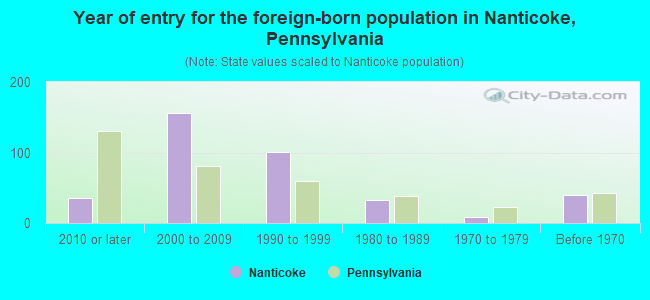
Year of entry for the foreign-born population in Nanticoke, Pennsylvania
36 2010 or later 156 2000 to 2009 101 1990 to 1999 33 1980 to 1989 9 1970 to 1979 40 Before 1970
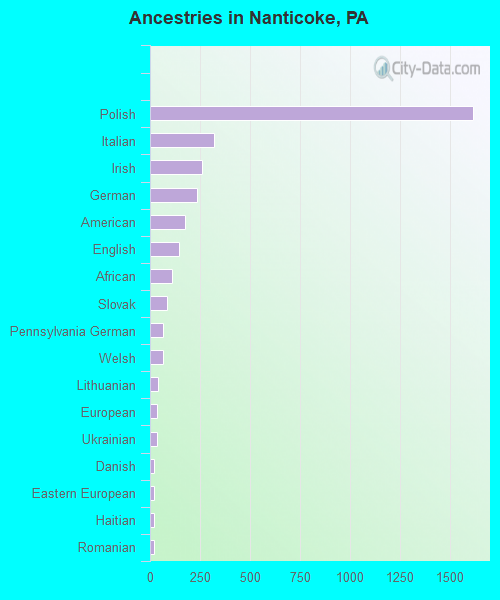
First ancestries reported:
Polish: 1,616 (38.0%)
Italian: 322 (7.6%)
Irish: 258 (6.1%)
German: 234 (5.5%)
American: 176 (4.1%)
English: 144 (3.4%)
African: 108 (2.5%)
Slovak: 83 (2.0%)
Pennsylvania German: 67 (1.6%)
Welsh: 67 (1.6%)
Lithuanian: 40 (0.9%)
European: 36 (0.8%)
Ukrainian: 34 (0.8%)
Danish: 21 (0.5%)
Eastern European: 21 (0.5%)
Haitian: 19 (0.4%)
Romanian: 18 (0.4%)
Dutch: 14 (0.3%)
Slovene: 13 (0.3%)
Yugoslavian: 12 (0.3%)
Norwegian: 8 (0.2%)
Portuguese: 8 (0.2%)
West Indian: 7 (0.2%)
Greek: 6 (0.1%)
British West Indian: 6 (0.1%)
Austrian: 4 (0.09%)
Hungarian: 3 (0.07%) Most common places of birth for foreign-born residents (%): Dominican Republic Nanticoke:
32.2% (124)Pennsylvania:
9.2% (86,544)
Colombia Nanticoke:
17.7% (68)Pennsylvania:
1.5% (13,823)
Mexico Nanticoke:
13.0% (50)Pennsylvania:
5.8% (54,190)
Honduras Nanticoke:
8.3% (32)Pennsylvania:
0.9% (8,463)
Ecuador Nanticoke:
8.3% (32)Pennsylvania:
1.1% (10,035)
Canada Nanticoke:
6.0% (23)Pennsylvania:
1.8% (17,032)
Haiti Nanticoke:
5.7% (22)Pennsylvania:
1.6% (15,224)
Nigeria Nanticoke:
4.9% (19)Pennsylvania:
1.1% (10,709)
Romania Nanticoke:
2.9% (11)Pennsylvania:
0.6% (5,598)
Poland Nanticoke:
2.3% (9)Pennsylvania:
1.3% (12,172)
Place of birth for U.S.-born residents:
This state: 8,309Other state: 1,696Northeast: 1,207Midwest: 96South: 279West: 111 85.8% of Nanticoke residents lived in the same house 1 years ago.
Out of people who lived in different houses, 32.4% lived in this county.
Out of people who lived in different counties, 50.1% lived in Pennsylvania.
Nanticoke:
85.8%State average:
89.3%
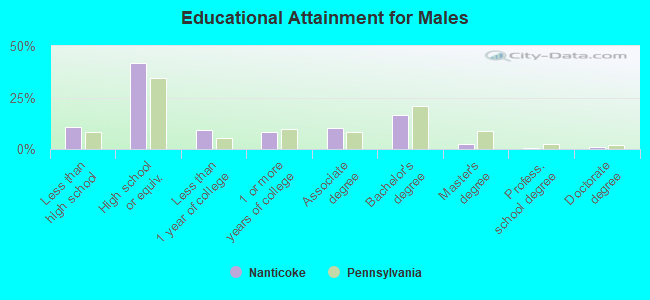
Education attainment for males 25 years and older:
No schooling: 80Nursery to 4th grade: 05th and 6th grade: 07th and 8th grade: 269th grade: 2010th grade: 1511th grade: 8712th grade, no diploma: 161High school graduate (or equivalency): 1,546Less than 1 year of college: 334Some college more than 1 year, no degree: 313Associate degree: 373Bachelor's degree: 618Master's degree: 90Professional school degree: 17Doctorate degree: 33
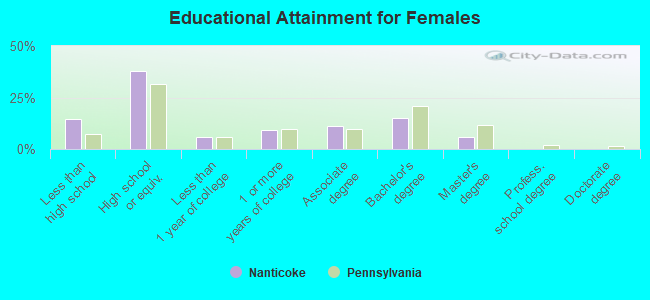
Education attainment for females 25 years and older:
No schooling: 143Nursery to 4th grade: 115th and 6th grade: 277th and 8th grade: 229th grade: 4910th grade: 10711th grade: 12512th grade, no diploma: 66High school graduate (or equivalency): 1,409Less than 1 year of college: 217Some college more than 1 year, no degree: 349Associate degree: 411Bachelor's degree: 568Master's degree: 211Professional school degree: 5Doctorate degree: 3
Housing units in structures:
One, detached: 2,872One, attached: 1,022Two: 3813 or 4: 4565 to 9: 9610 to 19: 5820 to 49: 11150 or more: 159Mobile homes: 7Housing units lacking complete plumbing facilities in 2022: 5.3%Housing units lacking complete kitchen facilities in 2022: 4.0%House/condo owner moved in on average 20 years ago
Renter moved in on average 3 years ago
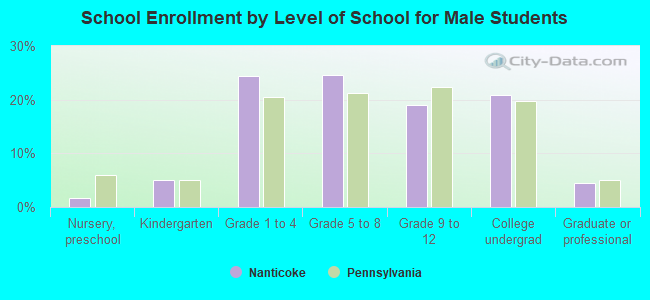
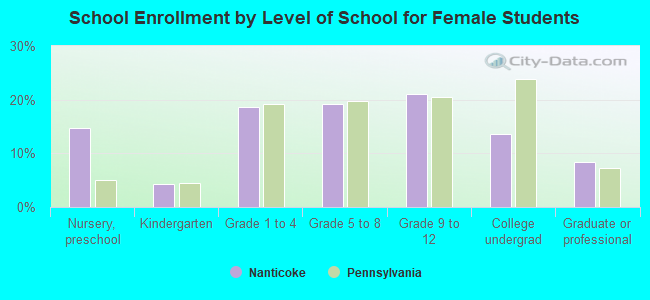
Private vs. public school enrollment:
Students in private schools in grades 1 to 8 (elementary and middle school): 123 Here:
12.1%Pennsylvania:
15.7%
Students in private schools in grades 9 to 12 (high school): 54 Here:
11.8%Pennsylvania:
13.4%
Students in private undergraduate colleges: 165 Here:
40.3%Pennsylvania:
39.8%