Napa, CA (California) Houses and Residents
| Napa: | $867,800 |
| California: | $715,900 |
Mean price in 2022:
Detached houses: $981,248
Here: $981,248 State: $988,808 Townhouses or other attached units: $714,967
Here: $714,967 State: $838,546 In 2-unit structures: $666,968
Here: $666,968 State: $1,138,100 In 3-to-4-unit structures: $600,054
Here: $600,054 State: $824,253 In 5-or-more-unit structures: $573,826
Here: $573,826 State: $730,996 Mobile homes: $274,057
Here: $274,057 State: $184,506
Total population: 80,011 (Urban population: 72,747, Rural population: 34 (all nonfarm))
Houses: 32,734 (30,632 occupied: 17,224 owner occupied, 13,408 renter occupied)
| % of renters here: | 44% |
| State: | 44% |
Housing density: 1,850 houses/condos per square mile
Median price asked for vacant for-sale houses and condos in 2022: $935,078.
Median contract rent in 2022: $1,913 (lower quartile is $1,530, upper quartile is over $2,000)
Median rent asked for vacant for-rent units in 2022: $3,400
Median gross rent in Napa, CA in 2022: over $2,000
Housing units in Napa with a mortgage: 11,545 (1,697 second mortgage, 0 home equity loan, 1,510 both second mortgage and home equity loan)
Houses without a mortgage: 81
Median household income for houses/condos with a mortgage: $143,160
Median household income for apartments without a mortgage: $86,905
Median monthly housing costs: $2,121
Compare current foreclosures in Napa, CA:
| Photo | Address | Area | Beds / Baths | Price | Details |
|---|---|---|---|---|---|

|
#1
Sugar Loaf Dr
Napa, CA 94558
|
- sq. feet
|
2 baths 3 beds |
$36,400
|
show details |

|
#2
Amanda Ct
Napa, CA 94559
|
1,823 sq. feet
|
3 baths 4 beds |
show details | |

|
#3
Terrace Dr
Napa, CA 94559
|
2,140 sq. feet
|
2 baths 4 beds |
show details | |

|
#4
Berry Ln
Napa, CA 94558
|
840 sq. feet
|
1 baths 3 beds |
show details | |

|
#5
Shoreline Dr
Napa, CA 94558
|
1,653 sq. feet
|
2 baths 3 beds |
show details | |

|
#6
Spencer St
Napa, CA 94559
|
- sq. feet
|
1 baths 2 beds |
show details | |

|
#7
Cross St
Napa, CA 94559
|
- sq. feet
|
1 baths 2 beds |
show details | |

|
#8
Ellen Way
Napa, CA 94558
|
- sq. feet
|
3 baths 4 beds |
show details | |

|
#9
Pine St
Napa, CA 94558
|
- sq. feet
|
1 baths 2 beds |
show details | |

|
#10
Dry Creek Rd
Napa, CA 94558
|
- sq. feet
|
1 baths 3 beds |
show details |
| Photo | Address | Area | Beds / Baths | Price | Details |
|---|---|---|---|---|---|

|
#11
Michelle Ct
Napa, CA 94558
|
- sq. feet
|
1 baths 2 beds |
show details | |

|
#12
Needles Ct
Napa, CA 94559
|
- sq. feet
|
2 baths 2 beds |
show details | |

|
#13
Catalpa Ct
Napa, CA 94558
|
- sq. feet
|
3 baths 3 beds |
show details | |

|
#14
Cornwall Ave
Napa, CA 94558
|
- sq. feet
|
1 baths 3 beds |
show details | |

|
#15
Cayetano Dr
Napa, CA 94559
|
- sq. feet
|
2 baths 3 beds |
show details | |

|
#16
Davis Ave
Napa, CA 94559
|
- sq. feet
|
1 baths 2 beds |
show details | |

|
#17
Palmer St
Napa, CA 94559
|
- sq. feet
|
3 baths 4 beds |
show details | |

|
#18
Atlas Peak Rd # 295
Napa, CA 94558
|
- sq. feet
|
2 baths 2 beds |
show details | |

|
#19
Dry Creek Rd
Napa, CA 94558
|
- sq. feet
|
2 baths 3 beds |
show details | |

|
#20
Atlas Peak Rd # 305
Napa, CA 94558
|
- sq. feet
|
2 baths 2 beds |
show details |
| Photo | Address | Area | Beds / Baths | Price | Details |
|---|---|---|---|---|---|

|
#21
Hemlock St
Napa, CA 94559
|
- sq. feet
|
1 baths 3 beds |
show details | |

|
#22
Minahen St
Napa, CA 94559
|
- sq. feet
|
2 baths 4 beds |
show details | |

|
#23
Lugo Ln
Napa, CA 94559
|
- sq. feet
|
1 baths 3 beds |
show details | |

|
#24
York St
Napa, CA 94559
|
- sq. feet
|
3 baths 3 beds |
show details | |

|
#25
Packard Ct
Napa, CA 94558
|
- sq. feet
|
2 baths 4 beds |
show details | |

|
#26
Soscol Ave Apt 118
Napa, CA 94558
|
- sq. feet
|
- baths - beds |
show details | |

|
#27
Rohlffs Way Apt 202
Napa, CA 94558
|
- sq. feet
|
- baths - beds |
show details | |

|
#28
Louisa St
Napa, CA 94558
|
- sq. feet
|
- baths - beds |
show details | |

|
#29
River Glen Dr Apt 122
Napa, CA 94558
|
- sq. feet
|
- baths - beds |
show details | |

|
#30
Silverado Trl # C
Napa, CA 94559
|
- sq. feet
|
- baths - beds |
show details |
| Photo | Address | Area | Beds / Baths | Price | Details |
|---|---|---|---|---|---|

|
#31
6th St
Napa, CA 94559
|
- sq. feet
|
- baths - beds |
show details | |

|
#32
Fairways Dr
Napa, CA 94558
|
- sq. feet
|
- baths - beds |
show details | |

|
#33
Hemings Ct
Napa, CA 94558
|
- sq. feet
|
- baths - beds |
show details | |

|
#34
Trancas St Apt 231
Napa, CA 94558
|
- sq. feet
|
- baths - beds |
show details | |

|
#35
White Fir Ct
Napa, CA 94558
|
- sq. feet
|
- baths - beds |
show details | |

|
#36
Laurel St Apt 78
Napa, CA 94558
|
- sq. feet
|
- baths - beds |
show details | |

|
#37
Tade Ct
Napa, CA 94559
|
- sq. feet
|
- baths - beds |
show details | |

|
#38
Funny Cide St Apt 201
Napa, CA 94559
|
- sq. feet
|
- baths - beds |
show details | |

|
#39
3rd St Apt 10
Napa, CA 94559
|
- sq. feet
|
- baths - beds |
show details | |

|
#40
Collier Blvd Apt 209
Napa, CA 94558
|
- sq. feet
|
- baths - beds |
show details |
| Photo | Address | Area | Beds / Baths | Price | Details |
|---|---|---|---|---|---|

|
#41
1st St # B204
Napa, CA 94558
|
- sq. feet
|
- baths - beds |
show details | |

|
#42
Old Sonoma Rd
Napa, CA 94559
|
- sq. feet
|
- baths - beds |
show details | |

|
#43
Longhorn Ridge Rd
Napa, CA 94558
|
- sq. feet
|
- baths - beds |
show details | |

|
#44
Wilkins Ave
Napa, CA 94559
|
- sq. feet
|
- baths - beds |
show details | |

|
#45
Eastridge Dr
Napa, CA 94558
|
- sq. feet
|
- baths - beds |
show details | |

|
#46
Young Ct
Napa, CA 94558
|
- sq. feet
|
- baths - beds |
show details | |

|
#47
Atlas Peak Rd
Napa, CA 94558
|
- sq. feet
|
- baths - beds |
show details | |

|
#48
Pueblo Ave, Trlr 145
Napa, CA 94558
|
- sq. feet
|
- baths - beds |
show details | |

|
Check over 1 million property listings on Foreclosure.com!
|
browse all offers | |||

Latest news about housing in Napa, CA collected exclusively by city-data.com from local newspapers, TV, and radio stations


Median year apartment built: 1974
Household type by relationship:
Households: 78,308- Male householders: 13,603 (3,951 living alone), Female householders: 17,029 (4,883 living alone)
14,799 spouses (14,692 opposite-sex spouses), 2,077 unmarried partners, (1,941 opposite-sex unmarried partners), 19,976 children (19,543 natural, 334 adopted, 99 stepchildren), 1,463 grandchildren, 1,856 brothers or sisters, 955 parents, 0 foster children, 2,065 other relatives, 3,171 non-relatives
- In group quarters: 1,314
Size of family households: 8,558 2-persons, 3,469 3-persons, 3,761 4-persons, 1,993 5-persons, 674 6-persons, 500 7-or-more-persons.
Size of nonfamily households: 8,834 1-person, 2,161 2-persons, 440 3-persons, 54 4-persons, 188 5-persons.
10,830 married couples with children.
2,982 single-parent households (855 men, 2,127 women).
64.8% of residents of Napa speak English at home.
30.9% of residents speak Spanish at home (49% speak English very well, 23% speak English well, 20% speak English not well, 8% don't speak English at all).
2.9% of residents speak other Indo-European language at home (77% speak English very well, 19% speak English well, 3% speak English not well).
1.1% of residents speak Asian or Pacific Island language at home (60% speak English very well, 28% speak English well, 10% speak English not well, 2% don't speak English at all).
0.1% of residents speak other language at home (83% speak English very well, 17% speak English well).
Foreign born population: 16,862 (21.5%)
(48.0% of them are naturalized citizens)
| Here: | 6.1 |
| State: | 6.0 |
| Here: | 4.0 |
| State: | 3.9 |

- Bedrooms in owner-occupied houses and condos in Napa, California
- 335no bedroom
- 2231 bedroom
- 3,8222 bedrooms
- 7,9673 bedrooms
- 4,1204 bedrooms
- 7575+ bedrooms

- Bedrooms in renter-occupied apartments in Napa, California
- 662no bedroom
- 4,0261 bedroom
- 5,0332 bedrooms
- 2,7073 bedrooms
- 8554 bedrooms
- 1255+ bedrooms

- Cars and other vehicles available in Napa in owner-occupied houses/condos
- 248no vehicle
- 4,1751 vehicle
- 7,9962 vehicles
- 2,9843 vehicles
- 1,1424 vehicles
- 6795+ vehicles

- Cars and other vehicles available in Napa in renter-occupied apartments
- 1,432no vehicle
- 4,2751 vehicle
- 5,0012 vehicles
- 1,3073 vehicles
- 6764 vehicles
- 7175+ vehicles

- Rooms in owner-occupied houses in Napa, California
- 2181 room
- 1172 rooms
- 5073 rooms
- 1,9664 rooms
- 3,6005 rooms
- 4,0076 rooms
- 2,6567 rooms
- 1,5648 rooms
- 2,5899+ rooms

- Rooms in renter-occupied apartments in Napa, California
- 6091 room
- 1,5362 rooms
- 3,1553 rooms
- 3,1174 rooms
- 1,9875 rooms
- 1,6306 rooms
- 8857 rooms
- 4488 rooms
- 419+ rooms


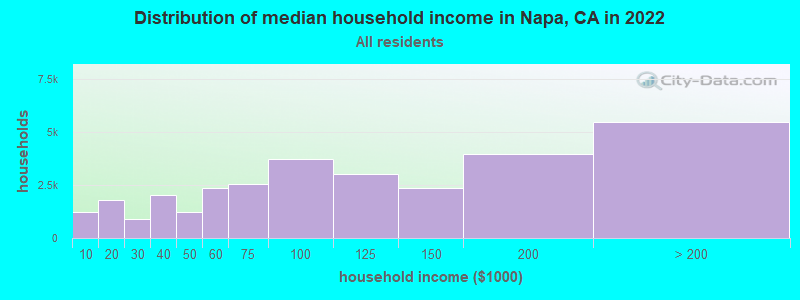
Napa, CA household income distribution

- 1,212Less than $10,000
- 1,777$10,000 to $19,999
- 900$20,000 to $29,999
- 2,027$30,000 to $39,999
- 1,223$40,000 to $49,999
- 2,351$50,000 to $59,999
- 2,556$60,000 to $74,999
- 3,719$75,000 to $99,999
- 3,038$100,000 to $124,999
- 2,367$125,000 to $149,999
- 3,987$150,000 to $199,999
- 5,475$200,000 or more
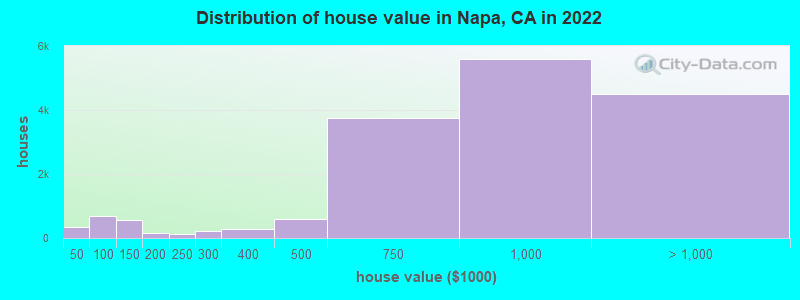
Home value of owner - occupied houses in 2022 in Napa, CA
-
- 255Less than $10,000
- 2$20,000 to $24,999
- 19$30,000 to $34,999
- 49$35,000 to $39,999
- 21$40,000 to $49,999
- 400$50,000 to $59,999
- 132$60,000 to $69,999
- 78$70,000 to $79,999
- 28$80,000 to $89,999
- 20$90,000 to $99,999
- 501$100,000 to $124,999
- 47$125,000 to $149,999
- 47$150,000 to $174,999
- 117$175,000 to $199,999
- 128$200,000 to $249,999
- 229$250,000 to $299,999
- 276$300,000 to $399,999
- 590$400,000 to $499,999
- 3,762$500,000 to $749,999
- 5,580$750,000 to $999,999
- 3,264$1,000,000 to $1,499,999
- 723$1,500,000 to $1,999,999
- 519$2,000,000 or more
Rent paid by renters in 2022 in Napa, CA
-
- 14$100 to $149
- 23$150 to $199
- 33$200 to $249
- 152$250 to $299
- 346$300 to $349
- 30$350 to $399
- 29$400 to $449
- 39$450 to $499
- 34$500 to $549
- 97$550 to $599
- 54$600 to $649
- 42$650 to $699
- 22$700 to $749
- 115$750 to $799
- 173$800 to $899
- 208$900 to $999
- 631$1,000 to $1,249
- 1,237$1,250 to $1,499
- 3,901$1,500 to $1,999
- 2,394$2,000 to $2,499
- 2,324$2,500 to $2,999
- 747$3,000 to $3,499
- 258$3,500 or more
- 534No cash rent


Percentage of workers working in this county: 86.6%
Number of people working at home: 4,175 (11.1% of all workers)
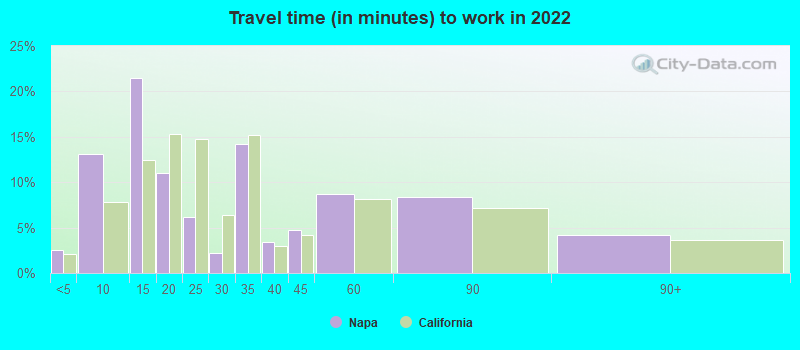
Travel time to work (commute)
- Less than 5 minutes: 664
- 5 to 9 minutes: 4,439
- 10 to 14 minutes: 7,416
- 15 to 19 minutes: 7,105
- 20 to 24 minutes: 2,927
- 25 to 29 minutes: 1,469
- 30 to 34 minutes: 4,029
- 35 to 39 minutes: 778
- 40 to 44 minutes: 837
- 45 to 59 minutes: 1,759
- 60 to 89 minutes: 1,559
- 90 or more minutes: 925
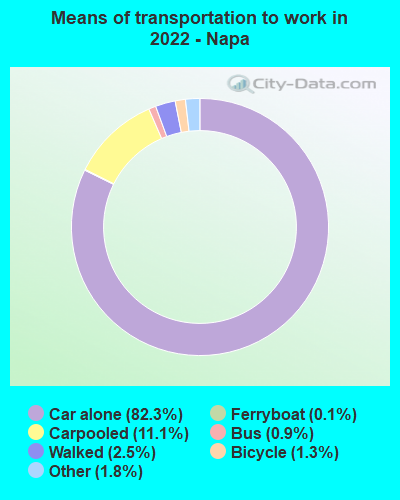
Means of transportation to work:
- Drove a car alone: 25,326 (70.8%)
- Carpooled: 4,080 (11.4%)
- Bus: 179 (0.5%)
- Subway or elevated rail: 2 (0.0%)
- Ferryboat: 23 (0.1%)
- Taxi: 705 (2.0%)
- Bicycle: 517 (1.4%)
- Walked: 786 (2.2%)
- Worked at home: 4,175 (11.7%)

- Unemployment by race in 2022
- Unemployment rate for White non-Hispanic residents
- 6.5%Males
- 4.1%Females
- Unemployment rate for Black residents
- 4.5%Females
- Unemployment rate for American Indian and Alaska Native residents
- 1.1%Males
- Unemployment rate for Asian residents
- 17.8%Males
- 4.7%Females
- Unemployment rate for other race residents
- 6.2%Males
- 9.3%Females
- Unemployment rate for two or more race residents
- 5.1%Males
- 3.9%Females
- Unemployment rate for Hispanic or Latino residents
- 6.9%Males
- 11.9%Females

- Year of entry for the foreign-born population in Napa, California
- 2,9462010 or later
- 4,0572000 to 2009
- 4,3931990 to 1999
- 4,0041980 to 1989
- 1,6511970 to 1979
- 1,888Before 1970

First ancestries reported:
- European: 2,999 (7.3%)
- English: 1,981 (4.9%)
- German: 1,967 (4.8%)
- Irish: 1,609 (3.9%)
- American: 1,531 (3.7%)
- Italian: 1,417 (3.5%)
- Scottish: 402 (1.0%)
- Norwegian: 348 (0.9%)
- Northern European: 292 (0.7%)
- British: 238 (0.6%)
- Swedish: 237 (0.6%)
- Danish: 207 (0.5%)
- Portuguese: 206 (0.5%)
- Canadian: 187 (0.5%)
- Polish: 171 (0.4%)
- French: 165 (0.4%)
- Eastern European: 156 (0.4%)
- Greek: 99 (0.2%)
- Iranian: 96 (0.2%)
- Armenian: 95 (0.2%)
- Scotch-Irish: 95 (0.2%)
- Finnish: 91 (0.2%)
- French Canadian: 80 (0.2%)
- Dutch: 73 (0.2%)
- Russian: 69 (0.2%)
- Hungarian: 68 (0.2%)
- Jamaican: 66 (0.2%)
- Welsh: 56 (0.1%)
- Swiss: 51 (0.1%)
- Basque: 45 (0.1%)
- Arab: 35 (0.09%)
- Turkish: 34 (0.08%)
- Scandinavian: 29 (0.07%)
- Ukrainian: 26 (0.06%)
- Lebanese: 23 (0.06%)
- Syrian: 19 (0.05%)
- Czech: 15 (0.04%)
- Slavic: 15 (0.04%)
- Slovene: 12 (0.03%)
- Estonian: 11 (0.03%)
- Lithuanian: 11 (0.03%)
- Macedonian: 10 (0.02%)
- Romanian: 6 (0.01%)
- Croatian: 5 (0.01%)
- Palestinian: 4 (0.01%)
- Czechoslovakian: 4 (0.01%)
- Brazilian: 4 (0.01%)
- Assyrian: 4 (0.01%)
Most common places of birth for foreign-born residents (%):
| Napa: | 72.2% (11,814) |
| California: | 37.2% (3,881,193) |
| Napa: | 3.0% (495) |
| California: | 7.8% (818,297) |
| Napa: | 2.7% (438) |
| California: | 2.8% (290,436) |
| Napa: | 2.4% (391) |
| California: | 1.2% (127,477) |
| Napa: | 2.2% (356) |
| California: | 5.2% (539,184) |
| Napa: | 1.5% (246) |
| California: | 0.2% (16,541) |
Place of birth for U.S.-born residents:
- This state: 48,054
- Other state: 12,618
- Northeast: 3,304
- Midwest: 4,196
- South: 2,741
- West: 2,377
91.4% of Napa residents lived in the same house 1 years ago.
Out of people who lived in different houses, 33.6% lived in this county.
Out of people who lived in different counties, 74.6% lived in California.
| Napa: | 91.4% |
| State average: | 88.9% |
Education attainment for males 25 years and older:
- No schooling: 1,238
- Nursery to 4th grade: 289
- 5th and 6th grade: 712
- 7th and 8th grade: 1,093
- 9th grade: 58
- 10th grade: 162
- 11th grade: 47
- 12th grade, no diploma: 1,258
- High school graduate (or equivalency): 5,977
- Less than 1 year of college: 1,081
- Some college more than 1 year, no degree: 3,433
- Associate degree: 1,686
- Bachelor's degree: 6,296
- Master's degree: 2,960
- Professional school degree: 1,113
- Doctorate degree: 425

Education attainment for females 25 years and older:
- No schooling: 1,077
- Nursery to 4th grade: 231
- 5th and 6th grade: 1,217
- 7th and 8th grade: 1,008
- 9th grade: 157
- 10th grade: 54
- 11th grade: 220
- 12th grade, no diploma: 1,024
- High school graduate (or equivalency): 3,745
- Less than 1 year of college: 997
- Some college more than 1 year, no degree: 4,085
- Associate degree: 3,656
- Bachelor's degree: 6,444
- Master's degree: 3,301
- Professional school degree: 878
- Doctorate degree: 409


Housing units in structures:
- One, detached: 21,677
- One, attached: 2,487
- Two: 943
- 3 or 4: 1,073
- 5 to 9: 1,329
- 10 to 19: 1,145
- 20 to 49: 1,329
- 50 or more: 1,907
- Mobile homes: 844
Median worth of mobile homes: $117,000
Housing units lacking complete kitchen facilities in 2022: 1.0%
House/condo owner moved in on average 12 years ago
Renter moved in on average 4 years ago

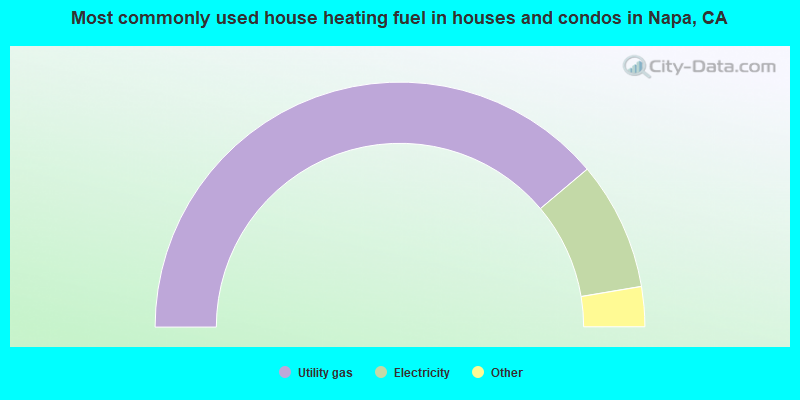
- 77.8%Utility gas
- 17.0%Electricity
- 2.1%Bottled, tank, or LP gas
- 1.4%Wood
- 1.2%Solar energy
- 0.3%No fuel used
- 0.2%Other fuel
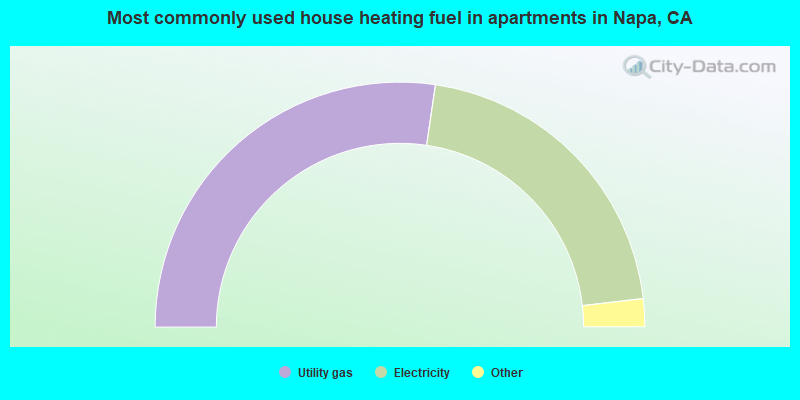
- 54.6%Utility gas
- 41.6%Electricity
- 1.7%Bottled, tank, or LP gas
- 1.4%No fuel used
- 0.2%Fuel oil, kerosene, etc.
- 0.2%Solar energy
- 0.2%Wood
Private vs. public school enrollment:
| Here: | 20.8% |
| California: | 10.5% |
| Here: | 12.1% |
| California: | 8.5% |
| Here: | 16.0% |
| California: | 15.9% |


