Napili-Honokowai, HI (Hawaii) Houses and Residents
| Napili-Honokowai: | $873,111 |
| Hawaii: | $820,100 |
Mean price in 2022:
Detached houses: $1,396,639
Here: $1,396,639 State: $1,035,348 Townhouses or other attached units: $1,944,006
Here: $1,944,006 State: $976,474 In 2-unit structures: $1,302,449
Here: $1,302,449 State: $928,739 In 3-to-4-unit structures: $589,102
Here: $589,102 State: $758,960 In 5-or-more-unit structures: $559,269
Here: $559,269 State: $584,974
Total population: 7,261 (Urban population: 6,758 (all inside urban clusters), Rural population: 24 (all nonfarm))
Houses: 4,044 (2,389 occupied: 1,242 owner occupied, 1,221 renter occupied)
| % of renters here: | 50% |
| State: | 37% |
Housing density: 687 houses/condos per square mile
Median price asked for vacant for-sale houses and condos in 2022 in this county: $686,165.
Median contract rent in 2022: $1,776 (lower quartile is $1,303, upper quartile is over $2,000)
Median rent asked for vacant for-rent units in 2022: $2,037
Median gross rent in Napili-Honokowai, HI in 2022: $1,947
Housing units in Napili-Honokowai with a mortgage: 808 (140 second mortgage, 0 home equity loan, 90 both second mortgage and home equity loan)
Houses without a mortgage: 0
Median household income for houses/condos with a mortgage: $133,221
Median household income for apartments without a mortgage: $93,851
Median monthly housing costs: $1,981
Compare current foreclosures near Napili-Honokowai, HI:
| Photo | Address | Area | Beds / Baths | Price | Details |
|---|---|---|---|---|---|

|
#1
Lower Honoapiilani Rd
Lahaina, HI 96761
|
1,929 sq. feet
|
2 baths 3 beds |
show details | |

|
#2
Komo Ohia St
Wailuku, HI 96793
|
1,416 sq. feet
|
2 baths 3 beds |
show details | |

|
#3
Makalii St
Kahului, HI 96732
|
2,332 sq. feet
|
2 baths 5 beds |
show details | |

|
#4
Lono Ave
Kahului, HI 96732
|
1,252 sq. feet
|
2 baths 4 beds |
show details | |

|
#5
Hoomoku Loop
Kahului, HI 96732
|
1,422 sq. feet
|
2 baths 4 beds |
show details | |

|
#6
W Kane St
Kahului, HI 96732
|
1,036 sq. feet
|
2 baths 5 beds |
show details | |

|
#7
Niihau St
Kahului, HI 96732
|
1,714 sq. feet
|
3 baths 5 beds |
show details | |

|
#8
S Kamehameha Ave
Kahului, HI 96732
|
1,584 sq. feet
|
2 baths 5 beds |
show details | |

|
#9
Ano St
Kahului, HI 96732
|
1,122 sq. feet
|
2 baths 3 beds |
show details | |

|
#10
Maalo St
Kahului, HI 96732
|
1,074 sq. feet
|
3 baths 5 beds |
show details |
| Photo | Address | Area | Beds / Baths | Price | Details |
|---|---|---|---|---|---|

|
#11
Pue Pl
Kahului, HI 96732
|
3,909 sq. feet
|
5 baths 8 beds |
show details | |

|
#12
Kunihi Ln Apt 322
Kahului, HI 96732
|
772 sq. feet
|
2 baths 2 beds |
show details | |

|
#13
Meakanu Ln Apt 204
Wailuku, HI 96793
|
935 sq. feet
|
2 baths 2 beds |
show details | |

|
#14
Kalawi Pl
Wailuku, HI 96793
|
1,042 sq. feet
|
1 baths 3 beds |
show details | |

|
#15
Ainaola St
Wailuku, HI 96793
|
3,351 sq. feet
|
4 baths 6 beds |
show details | |

|
#16
Maunaleo St
Wailuku, HI 96793
|
2,279 sq. feet
|
3 baths 4 beds |
show details | |

|
#17
S Puunene Ave
Kahului, HI 96732
|
2,815 sq. feet
|
4 baths 5 beds |
show details | |

|
#18
Akaiki Pl
Wailuku, HI 96793
|
1,231 sq. feet
|
2 baths 3 beds |
show details | |

|
#19
Kanakea Loop
Lahaina, HI 96761
|
1,025 sq. feet
|
1 baths 3 beds |
show details | |

|
#20
Pauoa St
Lahaina, HI 96761
|
1,688 sq. feet
|
2 baths 4 beds |
show details |
| Photo | Address | Area | Beds / Baths | Price | Details |
|---|---|---|---|---|---|

|
#21
Haunani Pl
Wailuku, HI 96793
|
2,632 sq. feet
|
2 baths 3 beds |
show details | |

|
#22
Akaiki Pl
Wailuku, HI 96793
|
2,526 sq. feet
|
4 baths 6 beds |
show details | |

|
#23
Puuloa St
Wailuku, HI 96793
|
1,000 sq. feet
|
1 baths 3 beds |
show details | |

|
#24
Hilinai St
Wailuku, HI 96793
|
1,082 sq. feet
|
2 baths 3 beds |
show details | |

|
#25
Hoomau St
Wailuku, HI 96793
|
1,621 sq. feet
|
3 baths 5 beds |
show details | |

|
#26
Upalu St
Wailuku, HI 96793
|
960 sq. feet
|
2 baths 3 beds |
show details | |

|
#27
Makua St
Wailuku, HI 96793
|
- sq. feet
|
- baths - beds |
show details | |

|
#28
Wells St Apt 103
Wailuku, HI 96793
|
- sq. feet
|
- baths - beds |
show details | |

|
#29
E Kamehameha Ave # 509
Kahului, HI 96732
|
- sq. feet
|
- baths - beds |
show details | |

|
#30
Ihumai Pl
Wailuku, HI 96793
|
- sq. feet
|
- baths - beds |
show details |
| Photo | Address | Area | Beds / Baths | Price | Details |
|---|---|---|---|---|---|

|
#31
Anamuli St
Kahului, HI 96732
|
- sq. feet
|
- baths - beds |
show details | |

|
#32
S Kamehameha Ave
Kahului, HI 96732
|
- sq. feet
|
- baths - beds |
show details | |

|
#33
Alake St
Kahului, HI 96732
|
- sq. feet
|
- baths - beds |
show details | |

|
#34
Kamahao St
Wailuku, HI 96793
|
1,452 sq. feet
|
- baths - beds |
show details | |

|
#35
Kahului Beach Rd Apt D210
Kahului, HI 96732
|
- sq. feet
|
- baths - beds |
show details | |

|
#36
Piha Poepoe Way, Unit 102
Wailuku, HI 96793
|
- sq. feet
|
- baths - beds |
show details | |

|
#37
Wailani St Apt F
Wailuku, HI 96793
|
- sq. feet
|
- baths - beds |
show details | |

|
#38
Ohana Hana Pl
Wailuku, HI 96793
|
- sq. feet
|
- baths - beds |
show details | |

|
#39
Lower Honoapiilani Rd Apt 701
Lahaina, HI 96761
|
- sq. feet
|
- baths - beds |
show details | |

|
#40
E Makaukau Loop
Wailuku, HI 96793
|
1,662 sq. feet
|
- baths - beds |
show details |
| Photo | Address | Area | Beds / Baths | Price | Details |
|---|---|---|---|---|---|

|
#41
Palama Dr
Kahului, HI 96732
|
- sq. feet
|
- baths - beds |
show details | |

|
#42
Makua St
Wailuku, HI 96793
|
- sq. feet
|
- baths - beds |
show details | |

|
#43
Wili Pa Loop Ste 3b
Wailuku, HI 96793
|
- sq. feet
|
- baths - beds |
show details | |

|
#44
Kahekili Hwy
Wailuku, HI 96793
|
- sq. feet
|
- baths - beds |
show details | |

|
Check over 1 million property listings on Foreclosure.com!
|
browse all offers | |||


Median year apartment built: 1980
Household type by relationship:
Households: 6,762- Male householders: 827 (288 living alone), Female householders: 1,518 (318 living alone)
1,045 spouses (1,029 opposite-sex spouses), 271 unmarried partners, (265 opposite-sex unmarried partners), 1,940 children (1,744 natural, 122 adopted, 72 stepchildren), 322 grandchildren, 101 brothers or sisters, 79 parents, 0 foster children, 332 other relatives, 312 non-relatives
- In group quarters: 10
Size of family households: 699 2-persons, 531 3-persons, 220 4-persons, 76 5-persons, 59 6-persons, 119 7-or-more-persons.
Size of nonfamily households: 638 1-person, 135 2-persons, 6 3-persons.
542 married couples with children.
661 single-parent households (229 men, 432 women).
83.1% of residents of Napili-Honokowai speak English at home.
7.6% of residents speak Spanish at home (35% speak English very well, 40% speak English well, 19% speak English not well, 5% don't speak English at all).
0.3% of residents speak other Indo-European language at home (89% speak English very well, 11% speak English well).
9.3% of residents speak Asian or Pacific Island language at home (54% speak English very well, 40% speak English well, 7% speak English not well).
Foreign born population: 918 (13.6%)
(60.8% of them are naturalized citizens)
| Here: | 4.6 |
| State: | 5.5 |
| Here: | 2.9 |
| State: | 3.9 |

- Bedrooms in owner-occupied houses and condos in Napili-Honokowai, Hawaii
- 70no bedroom
- 1301 bedroom
- 2322 bedrooms
- 5873 bedrooms
- 1454 bedrooms
- 805+ bedrooms

- Bedrooms in renter-occupied apartments in Napili-Honokowai, Hawaii
- 116no bedroom
- 5041 bedroom
- 3852 bedrooms
- 1413 bedrooms
- 754 bedrooms
- 05+ bedrooms

- Cars and other vehicles available in Napili-Honokowai in owner-occupied houses/condos
- 9no vehicle
- 3441 vehicle
- 5222 vehicles
- 1793 vehicles
- 1084 vehicles
- 815+ vehicles

- Cars and other vehicles available in Napili-Honokowai in renter-occupied apartments
- 206no vehicle
- 4441 vehicle
- 3982 vehicles
- 973 vehicles
- 614 vehicles
- 155+ vehicles

- Rooms in owner-occupied houses in Napili-Honokowai, Hawaii
- 701 room
- 592 rooms
- 2173 rooms
- 2724 rooms
- 1785 rooms
- 1586 rooms
- 897 rooms
- 908 rooms
- 1099+ rooms

- Rooms in renter-occupied apartments in Napili-Honokowai, Hawaii
- 1131 room
- 3022 rooms
- 3563 rooms
- 1854 rooms
- 1625 rooms
- 756 rooms
- 57 rooms
- 08 rooms
- 229+ rooms


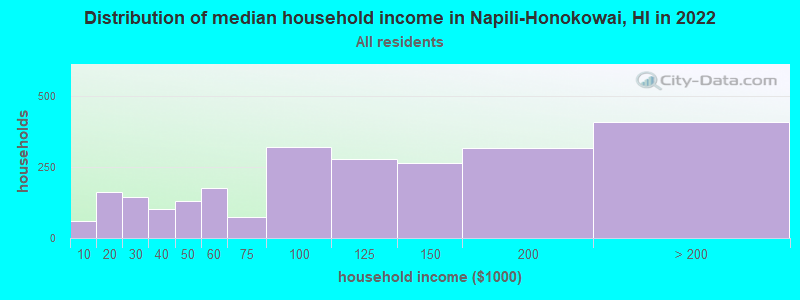
Napili-Honokowai, HI household income distribution

- 60Less than $10,000
- 161$10,000 to $19,999
- 144$20,000 to $29,999
- 104$30,000 to $39,999
- 130$40,000 to $49,999
- 175$50,000 to $59,999
- 75$60,000 to $74,999
- 322$75,000 to $99,999
- 279$100,000 to $124,999
- 266$125,000 to $149,999
- 317$150,000 to $199,999
- 409$200,000 or more
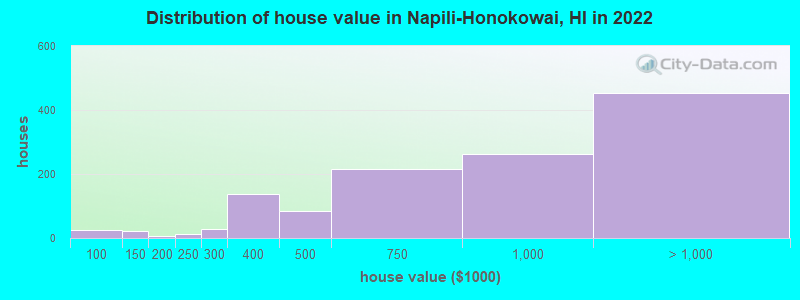
Home value of owner - occupied houses in 2022 in Napili-Honokowai, HI
-
- 15$80,000 to $89,999
- 10$90,000 to $99,999
- 23$125,000 to $149,999
- 5$175,000 to $199,999
- 10$200,000 to $249,999
- 27$250,000 to $299,999
- 137$300,000 to $399,999
- 83$400,000 to $499,999
- 217$500,000 to $749,999
- 264$750,000 to $999,999
- 98$1,000,000 to $1,499,999
- 96$1,500,000 to $1,999,999
- 257$2,000,000 or more
Rent paid by renters in 2022 in Napili-Honokowai, HI
-
- 17Less than $100
- 14$150 to $199
- 7$200 to $249
- 21$250 to $299
- 12$300 to $349
- 17$450 to $499
- 37$800 to $899
- 33$900 to $999
- 18$1,000 to $1,249
- 133$1,250 to $1,499
- 310$1,500 to $1,999
- 361$2,000 to $2,499
- 43$2,500 to $2,999
- 9$3,000 to $3,499
- 137$3,500 or more
- 30No cash rent

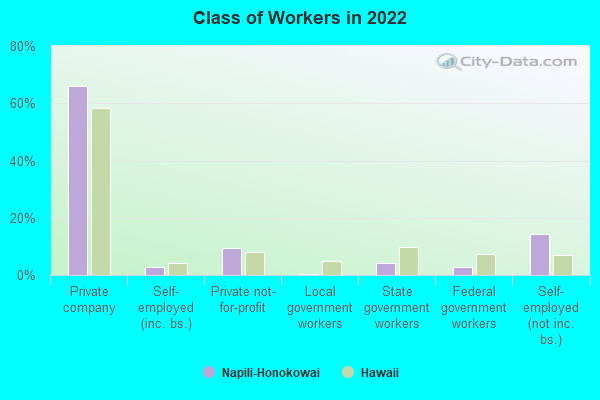
Percentage of workers working in this county: 100.1%
Number of people working at home: 418 (10.3% of all workers)
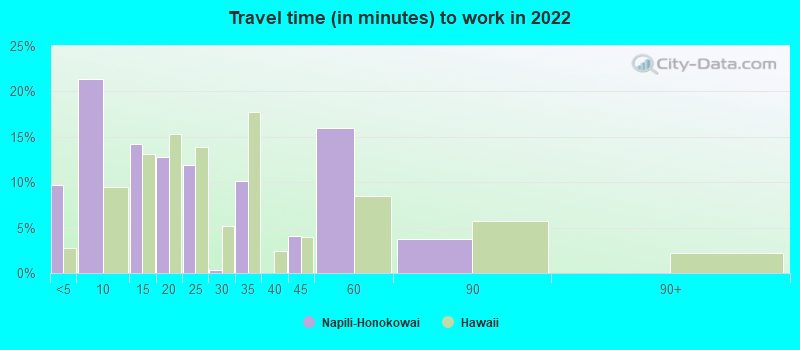
Travel time to work (commute)
- Less than 5 minutes: 212
- 5 to 9 minutes: 623
- 10 to 14 minutes: 1,056
- 15 to 19 minutes: 781
- 20 to 24 minutes: 313
- 25 to 29 minutes: 67
- 30 to 34 minutes: 65
- 35 to 39 minutes: 17
- 40 to 44 minutes: 48
- 45 to 59 minutes: 155
- 60 to 89 minutes: 323
- 90 or more minutes: 29
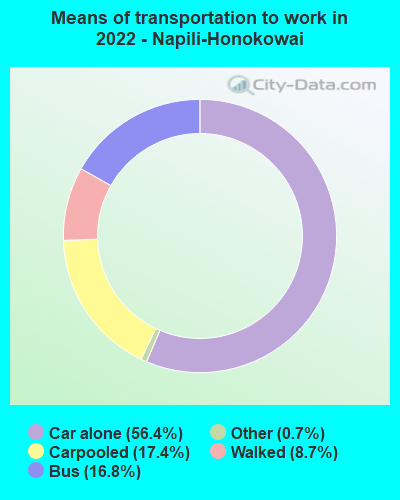
Means of transportation to work:
- Drove a car alone: 590 (42.1%)
- Carpooled: 190 (13.6%)
- Bus: 83 (5.9%)
- Taxi: 5 (0.4%)
- Walked: 111 (7.9%)
- Worked at home: 418 (29.8%)
- Unemployment by race in 2022
- Unemployment rate for White non-Hispanic residents
- 4.4%Males
- 7.1%Females
- Unemployment rate for two or more race residents
- 12.9%Males
- 4.7%Females
- Unemployment rate for Hispanic or Latino residents
- 2.4%Females

- Year of entry for the foreign-born population in Napili-Honokowai, Hawaii
- 2162010 or later
- 2192000 to 2009
- 2571990 to 1999
- 5521980 to 1989
- 2731970 to 1979
- 236Before 1970
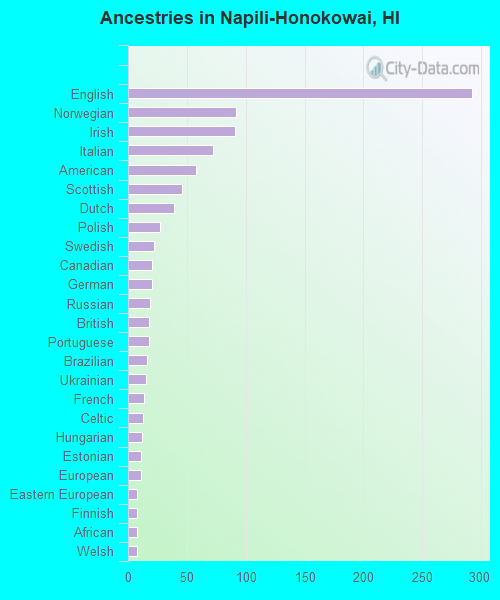
First ancestries reported:
- English: 292 (10.7%)
- Norwegian: 92 (3.4%)
- Irish: 91 (3.3%)
- Italian: 72 (2.6%)
- American: 58 (2.1%)
- Scottish: 46 (1.7%)
- Dutch: 39 (1.4%)
- Polish: 27 (1.0%)
- Swedish: 22 (0.8%)
- Canadian: 20 (0.7%)
- German: 20 (0.7%)
- Russian: 19 (0.7%)
- British: 18 (0.7%)
- Portuguese: 18 (0.7%)
- Brazilian: 16 (0.6%)
- Ukrainian: 15 (0.5%)
- French: 14 (0.5%)
- Celtic: 13 (0.5%)
- Hungarian: 12 (0.4%)
- Estonian: 11 (0.4%)
- European: 11 (0.4%)
- Eastern European: 8 (0.3%)
- Finnish: 8 (0.3%)
- African: 8 (0.3%)
- Welsh: 8 (0.3%)
- Slovak: 6 (0.2%)
- Swiss: 3 (0.1%)
Most common places of birth for foreign-born residents (%):
| Napili-Honokowai: | 34.4% (402) |
| Hawaii: | 44.3% (115,679) |
| Napili-Honokowai: | 18.5% (216) |
| Hawaii: | 1.8% (4,752) |
| Napili-Honokowai: | 10.5% (122) |
| Hawaii: | 0.6% (1,617) |
| Napili-Honokowai: | 6.9% (80) |
| Hawaii: | 1.8% (4,635) |
| Napili-Honokowai: | 4.6% (54) |
| Hawaii: | 0.2% (504) |
| Napili-Honokowai: | 4.4% (51) |
| Hawaii: | 0.1% (152) |
| Napili-Honokowai: | 4.1% (48) |
| Hawaii: | 3.6% (9,389) |
| Napili-Honokowai: | 2.6% (30) |
| Hawaii: | 0.3% (726) |
| Napili-Honokowai: | 2.6% (30) |
| Hawaii: | 0.1% (282) |
| Napili-Honokowai: | 2.5% (29) |
| Hawaii: | 8.5% (22,321) |
| Napili-Honokowai: | 1.6% (19) |
| Hawaii: | 3.7% (9,622) |
| Napili-Honokowai: | 1.6% (19) |
| Hawaii: | 0.1% (314) |
Place of birth for U.S.-born residents:
- This state: 2,675
- Other state: 2,928
- Northeast: 436
- Midwest: 501
- South: 420
- West: 1,562
88.5% of Napili-Honokowai residents lived in the same house 1 years ago.
Out of people who lived in different houses, 33.0% lived in this county.
Out of people who lived in different counties, 10.9% lived in Hawaii.
| Napili-Honokowai: | 88.5% |
| State average: | 87.8% |
Education attainment for males 25 years and older:
- No schooling: 27
- Nursery to 4th grade: 0
- 5th and 6th grade: 0
- 7th and 8th grade: 28
- 9th grade: 0
- 10th grade: 27
- 11th grade: 26
- 12th grade, no diploma: 65
- High school graduate (or equivalency): 983
- Less than 1 year of college: 340
- Some college more than 1 year, no degree: 214
- Associate degree: 238
- Bachelor's degree: 373
- Master's degree: 72
- Professional school degree: 71
- Doctorate degree: 0

Education attainment for females 25 years and older:
- No schooling: 0
- Nursery to 4th grade: 0
- 5th and 6th grade: 5
- 7th and 8th grade: 0
- 9th grade: 0
- 10th grade: 6
- 11th grade: 11
- 12th grade, no diploma: 20
- High school graduate (or equivalency): 743
- Less than 1 year of college: 169
- Some college more than 1 year, no degree: 411
- Associate degree: 598
- Bachelor's degree: 444
- Master's degree: 187
- Professional school degree: 24
- Doctorate degree: 47


Housing units in structures:
- One, detached: 1,028
- One, attached: 104
- Two: 183
- 3 or 4: 214
- 5 to 9: 314
- 10 to 19: 351
- 20 to 49: 1,059
- 50 or more: 778
- Mobile homes: 9
House/condo owner moved in on average 14 years ago
Renter moved in on average 2 years ago

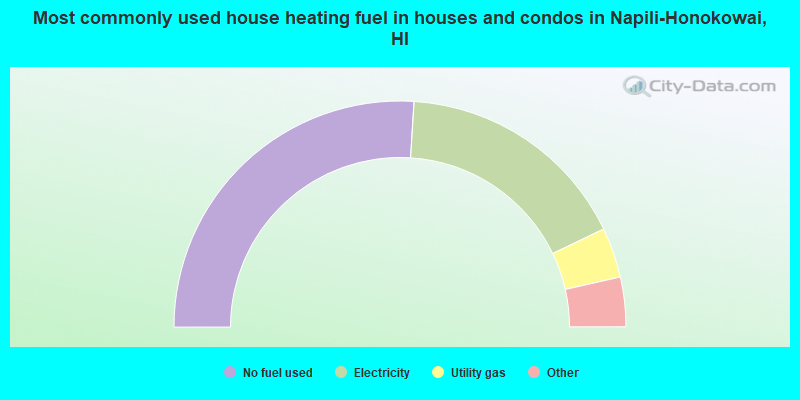
- 52.1%No fuel used
- 33.8%Electricity
- 7.2%Utility gas
- 3.4%Bottled, tank, or LP gas
- 3.0%Solar energy
- 0.5%Other fuel
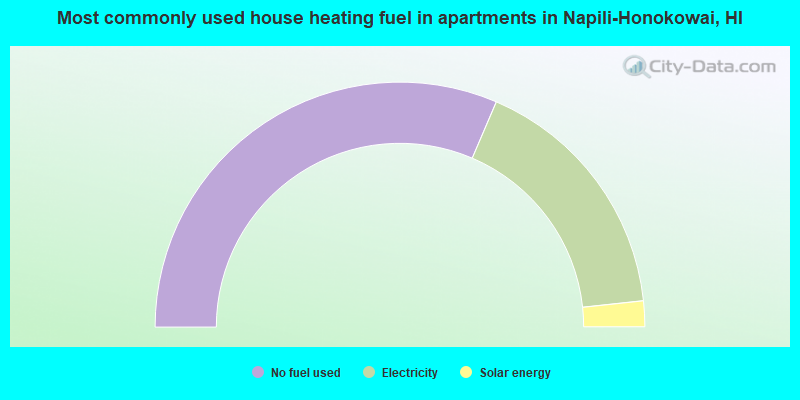
- 62.9%No fuel used
- 33.7%Electricity
- 3.4%Solar energy
Private vs. public school enrollment:
| Here: | 21.5% |
| Hawaii: | 21.6% |
| Here: | 16.1% |
| Hawaii: | 21.5% |
| Here: | 10.8% |
| Hawaii: | 23.3% |


