Nash, TX (Texas) Houses and Residents
| Nash: | $164,842 |
| Texas: | $275,400 |
Mean price in 2022:
Detached houses: $184,870
Here: $184,870 State: $369,058 Mobile homes: $97,805
Here: $97,805 State: $124,413
Total population: 3,142 (Urban population: 2,072, Rural population: 37 (all nonfarm))
Houses: 1,563 (1,398 occupied: 885 owner occupied, 539 renter occupied)
| % of renters here: | 38% |
| State: | 38% |
Housing density: 554 houses/condos per square mile
Median price asked for vacant for-sale houses and condos in 2022 in this county: $343,473.
Median contract rent in 2022: $684 (lower quartile is $638, upper quartile is $803)
Median rent asked for vacant for-rent units in 2022: $679
Median gross rent in Nash, TX in 2022: $878
Housing units in Nash with a mortgage: 533 (0 second mortgage, 0 home equity loan, 0 both second mortgage and home equity loan)
Houses without a mortgage: 0
Median household income for houses/condos with a mortgage: $44,952
Median household income for apartments without a mortgage: $34,076
Median monthly housing costs: $887
Compare current foreclosures near Nash, TX:
| Photo | Address | Area | Beds / Baths | Price | Details |
|---|---|---|---|---|---|

|
#1
N Pecan St
Nash, TX 75569
|
1,914 sq. feet
|
- baths - beds |
show details | |

|
#2
Peter Alan
Nash, TX 75569
|
- sq. feet
|
- baths - beds |
show details | |

|
#3
Watts St
Nash, TX 75569
|
- sq. feet
|
- baths - beds |
show details | |

|
#4
Highway 32 W
Ashdown, AR 71822
|
1,670 sq. feet
|
2 baths 3 beds |
$199,900
|
show details |

|
#5
Mc 28
Texarkana, AR 71854
|
2,432 sq. feet
|
3 baths 3 beds |
$219,900
|
show details |

|
#6
Highway 71
Fouke, AR 71837
|
1,778 sq. feet
|
2 baths 3 beds |
$200,000
|
show details |

|
#7
Grove St
Texarkana, AR 71854
|
1,325 sq. feet
|
1 baths - beds |
$19,900
|
show details |

|
#8
Co Rd 3784
Queen City, TX 75572
|
884 sq. feet
|
1 baths 2 beds |
show details | |

|
#9
Rosetta Ln
Texarkana, AR 71854
|
1,160 sq. feet
|
1 baths 3 beds |
show details | |

|
#10
E 32nd St
Texarkana, AR 71854
|
1,403 sq. feet
|
1 baths 3 beds |
show details |
| Photo | Address | Area | Beds / Baths | Price | Details |
|---|---|---|---|---|---|

|
#11
County Road 1116
Maud, TX 75567
|
1,512 sq. feet
|
2 baths 3 beds |
show details | |

|
#12
Hudson Pl
Texarkana, AR 71854
|
1,977 sq. feet
|
2 baths - beds |
show details | |

|
#13
Lr 17
Ashdown, AR 71822
|
1,060 sq. feet
|
1 baths - beds |
show details | |

|
#14
Harner St
Texarkana, AR 71854
|
1,242 sq. feet
|
1 baths - beds |
show details | |

|
#15
Central Pl
Texarkana, AR 71854
|
2,674 sq. feet
|
1 baths - beds |
show details | |

|
#16
Garden St
Texarkana, AR 71854
|
1,370 sq. feet
|
1 baths - beds |
show details | |

|
#17
Mcdonald Ln
Texarkana, AR 71854
|
2,301 sq. feet
|
2 baths - beds |
show details | |

|
#18
E Castleridge Dr
Texarkana, AR 71854
|
1,757 sq. feet
|
2 baths - beds |
show details | |

|
#19
Circle View Dr
Texarkana, AR 71854
|
1,649 sq. feet
|
2 baths - beds |
show details | |

|
#20
Georgian Ter
Texarkana, AR 71854
|
2,927 sq. feet
|
3 baths - beds |
show details |
| Photo | Address | Area | Beds / Baths | Price | Details |
|---|---|---|---|---|---|

|
#21
E Short 21st St
Texarkana, AR 71854
|
1,378 sq. feet
|
1 baths - beds |
show details | |

|
#22
E 22nd St
Texarkana, AR 71854
|
1,064 sq. feet
|
1 baths - beds |
show details | |

|
#23
Embassy Ln
Texarkana, AR 71854
|
1,490 sq. feet
|
1 baths - beds |
show details | |

|
#24
Fernwood Dr
Texarkana, AR 71854
|
1,342 sq. feet
|
2 baths - beds |
show details | |

|
#25
Senator St
Texarkana, AR 71854
|
1,015 sq. feet
|
1 baths - beds |
show details | |

|
#26
Garland Ave
Texarkana, AR 71854
|
1,400 sq. feet
|
2 baths - beds |
show details | |

|
#27
Miller County 17
Texarkana, AR 71854
|
1,248 sq. feet
|
2 baths - beds |
show details | |

|
#28
Savannah Cir
Texarkana, AR 71854
|
1,205 sq. feet
|
2 baths - beds |
show details | |

|
#29
Beech St
Texarkana, AR 71854
|
1,327 sq. feet
|
2 baths - beds |
show details | |

|
#30
Beech St
Texarkana, AR 71854
|
1,152 sq. feet
|
1 baths - beds |
show details |
| Photo | Address | Area | Beds / Baths | Price | Details |
|---|---|---|---|---|---|

|
#31
Beech St
Texarkana, AR 71854
|
962 sq. feet
|
1 baths - beds |
show details | |

|
#32
Forest Bend Ln
Texarkana, AR 71854
|
1,870 sq. feet
|
2 baths - beds |
show details | |

|
#33
Blackman Ferry Rd
Texarkana, AR 71854
|
2,000 sq. feet
|
2 baths - beds |
show details | |

|
#34
Timbercreek Dr
Texarkana, AR 71854
|
2,034 sq. feet
|
2 baths - beds |
show details | |

|
#35
Blakely Dr
Ashdown, AR 71822
|
1,368 sq. feet
|
1 baths - beds |
show details | |

|
#36
Baker St
Ashdown, AR 71822
|
1,720 sq. feet
|
2 baths - beds |
show details | |

|
#37
N Walker St
Ashdown, AR 71822
|
1,328 sq. feet
|
1 baths - beds |
show details | |

|
#38
Miller County 62 # 62
Texarkana, AR 71854
|
1,740 sq. feet
|
2 baths - beds |
show details | |

|
#39
N Park Ave
Ashdown, AR 71822
|
2,244 sq. feet
|
2 baths - beds |
show details | |

|
#40
Rankin St
Ashdown, AR 71822
|
1,911 sq. feet
|
1 baths - beds |
show details |
| Photo | Address | Area | Beds / Baths | Price | Details |
|---|---|---|---|---|---|

|
#41
Rankin St
Ashdown, AR 71822
|
1,958 sq. feet
|
2 baths - beds |
show details | |

|
#42
S Locust St
Ashdown, AR 71822
|
1,721 sq. feet
|
2 baths - beds |
show details | |

|
#43
W Cowling St
Ashdown, AR 71822
|
984 sq. feet
|
1 baths - beds |
show details | |

|
#44
W Pine St
Ashdown, AR 71822
|
912 sq. feet
|
1 baths - beds |
show details | |

|
#45
Highway 71
Fouke, AR 71837
|
1,560 sq. feet
|
2 baths - beds |
show details | |

|
#46
Miller County 422
Texarkana, AR 71854
|
1,736 sq. feet
|
1 baths - beds |
show details | |

|
#47
Sanderson Ln
Texarkana, AR 71854
|
2,070 sq. feet
|
2 baths - beds |
show details | |

|
#48
Lemley Ln
Fouke, AR 71837
|
2,240 sq. feet
|
1 baths - beds |
show details | |

|
#49
Tennessee Rd
Texarkana, AR 71854
|
1,180 sq. feet
|
2 baths - beds |
show details | |

|
Check over 1 million property listings on Foreclosure.com!
|
browse all offers | |||

Latest news about housing in Nash, TX collected exclusively by city-data.com from local newspapers, TV, and radio stations

 | lifelong renter buying a house (89 replies) |
| Private School Admissions - 2019 (425 replies) |
| New Doctor coming to FW, have no idea what I'm doing (housing) (17 replies) |
| WSJ: Texas Electric Bills Were $28 Billion Higher Under Deregulation (35 replies) |
| Considering Buying Home in 'Marginal' Neighborhood. Thoughts? (34 replies) |
| Copperfield (8 replies) |

Median year apartment built: 1987
Household type by relationship:
Households: 3,821- Male householders: 398 (121 living alone), Female householders: 976 (277 living alone)
438 spouses (438 opposite-sex spouses), 0 unmarried partners, (0 opposite-sex unmarried partners), 1,491 children (1,491 natural, 0 adopted, 0 stepchildren), 33 grandchildren, 0 brothers or sisters, 82 parents, 17 foster children, 122 other relatives, 257 non-relatives
- In group quarters: 2
Size of family households: 389 2-persons, 196 3-persons, 228 4-persons, 56 5-persons, 36 6-persons, 29 7-or-more-persons.
Size of nonfamily households: 458 1-person.
484 married couples with children.
664 single-parent households (101 men, 563 women).
90.3% of residents of Nash speak English at home.
8.9% of residents speak Spanish at home (68% speak English very well, 20% speak English well, 12% speak English not well).
0.1% of residents speak Asian or Pacific Island language at home (100% speak English very well).
Foreign born population: 208 (5.4%)
(3.8% of them are naturalized citizens)
| Here: | 5.8 |
| State: | 6.3 |
| Here: | 4.0 |
| State: | 4.0 |

- Bedrooms in owner-occupied houses and condos in Nash, Texas
- 72no bedroom
- 451 bedroom
- 712 bedrooms
- 6383 bedrooms
- 354 bedrooms
- 255+ bedrooms

- Bedrooms in renter-occupied apartments in Nash, Texas
- 20no bedroom
- 321 bedroom
- 2802 bedrooms
- 1733 bedrooms
- 364 bedrooms
- 05+ bedrooms

- Cars and other vehicles available in Nash in owner-occupied houses/condos
- 0no vehicle
- 3781 vehicle
- 3612 vehicles
- 393 vehicles
- 1074 vehicles
- 05+ vehicles

- Cars and other vehicles available in Nash in renter-occupied apartments
- 6no vehicle
- 3461 vehicle
- 792 vehicles
- 943 vehicles
- 154 vehicles
- 05+ vehicles

- Rooms in owner-occupied houses in Nash, Texas
- 721 room
- 02 rooms
- 243 rooms
- 574 rooms
- 1725 rooms
- 4396 rooms
- 507 rooms
- 228 rooms
- 509+ rooms

- Rooms in renter-occupied apartments in Nash, Texas
- 01 room
- 452 rooms
- 493 rooms
- 2134 rooms
- 1545 rooms
- 376 rooms
- 07 rooms
- 418 rooms
- 09+ rooms


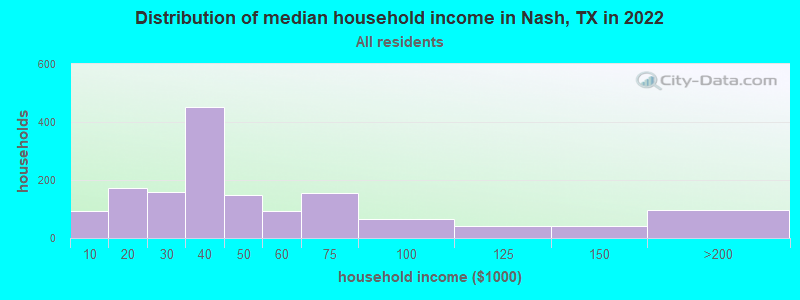
Nash, TX household income distribution

- 92Less than $10,000
- 171$10,000 to $19,999
- 158$20,000 to $29,999
- 452$30,000 to $39,999
- 148$40,000 to $49,999
- 93$50,000 to $59,999
- 155$60,000 to $74,999
- 65$75,000 to $99,999
- 42$100,000 to $124,999
- 42$125,000 to $149,999
- 92$150,000 to $199,999
- 6$200,000 or more
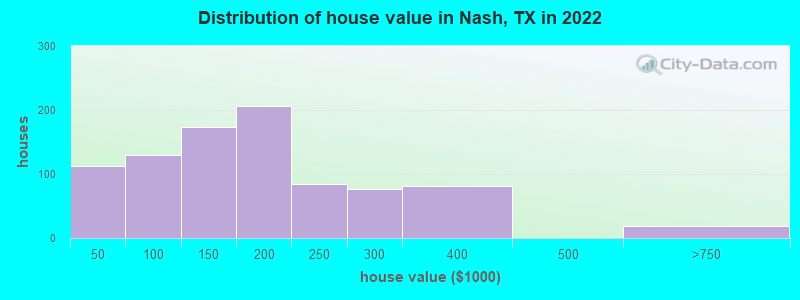
Home value of owner - occupied houses in 2022 in Nash, TX
-
- 50Less than $10,000
- 43$15,000 to $19,999
- 18$25,000 to $29,999
- 19$50,000 to $59,999
- 62$70,000 to $79,999
- 9$80,000 to $89,999
- 37$90,000 to $99,999
- 123$100,000 to $124,999
- 51$125,000 to $149,999
- 201$150,000 to $174,999
- 5$175,000 to $199,999
- 84$200,000 to $249,999
- 77$250,000 to $299,999
- 81$300,000 to $399,999
- 17$500,000 to $749,999
Rent paid by renters in 2022 in Nash, TX
-
- 18$400 to $449
- 64$550 to $599
- 49$600 to $649
- 45$650 to $699
- 106$700 to $749
- 35$750 to $799
- 90$800 to $899
- 47$900 to $999
- 13$1,000 to $1,249
- 29$1,500 to $1,999
- 2No cash rent


Percentage of workers working in this county: 86.6%
Number of people working at home: 20 (1.1% of all workers)
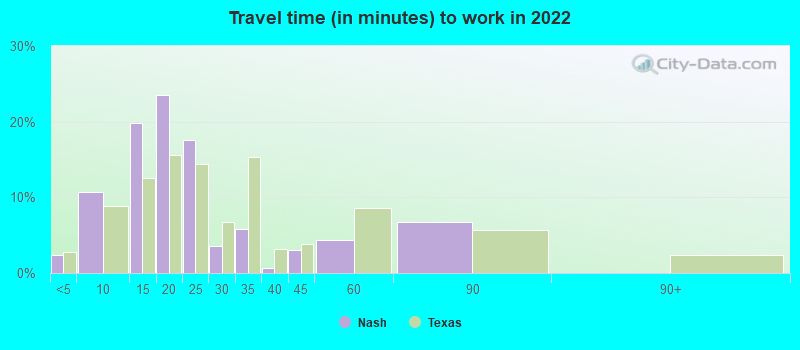
Travel time to work (commute)
- Less than 5 minutes: 56
- 5 to 9 minutes: 195
- 10 to 14 minutes: 601
- 15 to 19 minutes: 241
- 20 to 24 minutes: 155
- 25 to 29 minutes: 13
- 30 to 34 minutes: 172
- 35 to 39 minutes: 0
- 40 to 44 minutes: 0
- 45 to 59 minutes: 6
- 60 to 89 minutes: 33
- 90 or more minutes: 41
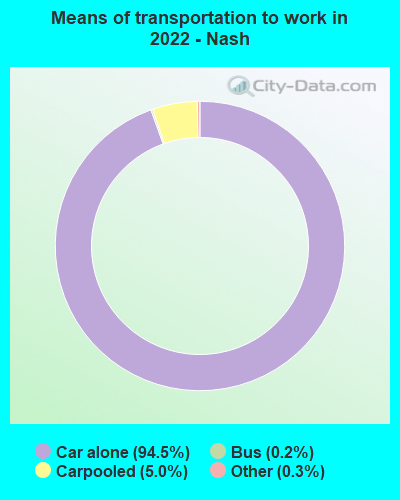
Means of transportation to work:
- Drove a car alone: 1,939 (89.0%)
- Carpooled: 111 (5.1%)
- Bus: 3 (0.1%)
- Taxi: 7 (0.3%)
- Worked at home: 20 (0.9%)

- Unemployment by race in 2022
- Unemployment rate for Black residents
- 3.6%Males
- 2.7%Females
- Unemployment rate for other race residents
- 46.7%Females
- Unemployment rate for Hispanic or Latino residents
- 19.8%Females

- Year of entry for the foreign-born population in Nash, Texas
- 262010 or later
- 1572000 to 2009
- 111990 to 1999
- 51980 to 1989
- 01970 to 1979
- 15Before 1970

First ancestries reported:
- American: 1,241 (38.3%)
- African: 271 (8.4%)
- English: 66 (2.0%)
- Scottish: 66 (2.0%)
- Irish: 51 (1.6%)
- German: 42 (1.3%)
- European: 26 (0.8%)
Most common places of birth for foreign-born residents (%):
| Nash: | 93.4% (214) |
| Texas: | 48.4% (2,411,723) |
| Nash: | 1.7% (4) |
| Texas: | 2.3% (115,558) |
Place of birth for U.S.-born residents:
- This state: 2,207
- Other state: 1,378
- Northeast: 6
- Midwest: 212
- South: 951
- West: 195
90.0% of Nash residents lived in the same house 1 years ago.
Out of people who lived in different houses, 19.7% lived in this county.
Out of people who lived in different counties, 5.8% lived in Texas.
| Nash: | 90.0% |
| State average: | 85.7% |
Education attainment for males 25 years and older:
- No schooling: 0
- Nursery to 4th grade: 0
- 5th and 6th grade: 13
- 7th and 8th grade: 28
- 9th grade: 0
- 10th grade: 0
- 11th grade: 3
- 12th grade, no diploma: 5
- High school graduate (or equivalency): 492
- Less than 1 year of college: 8
- Some college more than 1 year, no degree: 181
- Associate degree: 75
- Bachelor's degree: 45
- Master's degree: 9
- Professional school degree: 0
- Doctorate degree: 0

Education attainment for females 25 years and older:
- No schooling: 0
- Nursery to 4th grade: 0
- 5th and 6th grade: 46
- 7th and 8th grade: 0
- 9th grade: 14
- 10th grade: 0
- 11th grade: 4
- 12th grade, no diploma: 0
- High school graduate (or equivalency): 257
- Less than 1 year of college: 191
- Some college more than 1 year, no degree: 215
- Associate degree: 278
- Bachelor's degree: 101
- Master's degree: 148
- Professional school degree: 0
- Doctorate degree: 4


Housing units in structures:
- One, detached: 991
- One, attached: 20
- Two: 148
- 5 to 9: 30
- 10 to 19: 47
- 20 to 49: 27
- 50 or more: 39
- Mobile homes: 259
Median worth of mobile homes: $56,388
Housing units lacking complete kitchen facilities in 2022: 1.8%
House/condo owner moved in on average 5 years ago
Renter moved in on average 2 years ago

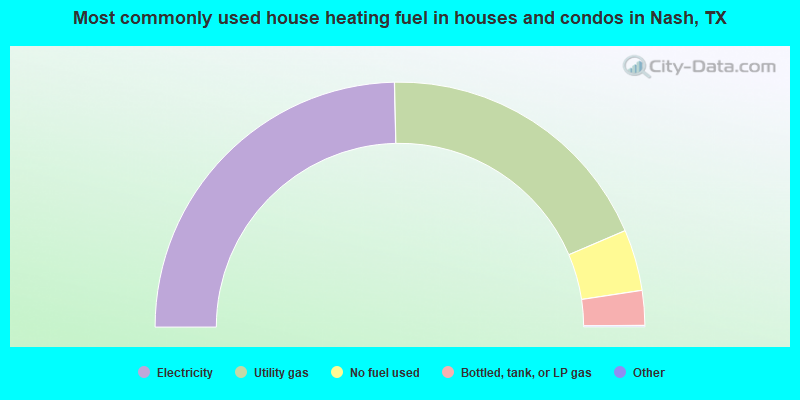
- 49.4%Electricity
- 37.9%Utility gas
- 8.1%No fuel used
- 4.6%Bottled, tank, or LP gas
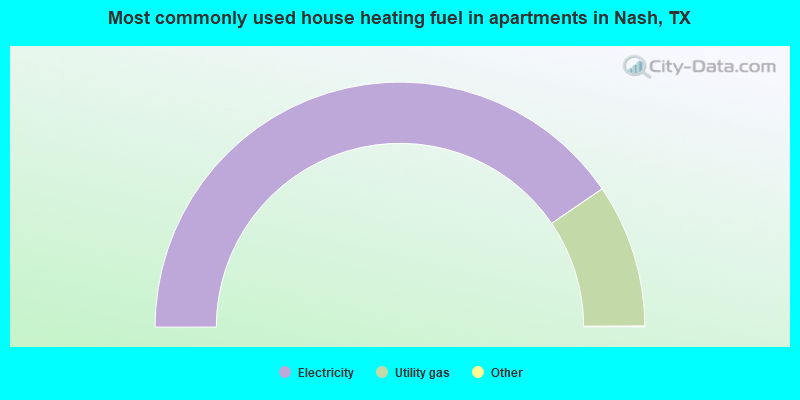
- 81.0%Electricity
- 19.0%Utility gas
Private vs. public school enrollment:
| Here: | 0.0% |
| Texas: | 8.8% |
| Here: | 9.5% |
| Texas: | 8.0% |
| Here: | 11.6% |
| Texas: | 16.2% |


