Naval Academy, MD (Maryland) Houses and Residents
| Naval Academy: | |
| Maryland: |
Total population: 4,802 (Urban population: 4,264, Rural population: 0)
Houses: 177 (150 occupied: 0 owner occupied, 151 renter occupied)
| % of renters here: | 100% |
| State: | 32% |
Housing density: 320 houses/condos per square mile
Median price asked for vacant for-sale houses and condos in 2022 in this county: $157,543.
Median contract rent in 2022: over $2,000 (lower quartile is over $2,000, upper quartile is over $2,000)
Median rent asked for vacant for-rent units in 2022: $401
Median gross rent in Naval Academy, MD in 2022: over $2,000
Housing units in Naval Academy with a mortgage: 21 (0 second mortgage, 7 home equity loan, 0 both second mortgage and home equity loan)
Houses without a mortgage: 7
Compare current foreclosures near Naval Academy, MD:
| Photo | Address | Area | Beds / Baths | Price | Details |
|---|---|---|---|---|---|

|
#1
Elkhorn Ln
Bowie, MD 20716
|
1,514 sq. feet
|
2 baths 3 beds |
$415,000
|
show details |

|
#2
Heming Ln
Bowie, MD 20716
|
1,800 sq. feet
|
2 baths 3 beds |
$400,000
|
show details |

|
#3
Bay Ridge Rd
Edgewater, MD 21037
|
2,951 sq. feet
|
3 baths 3 beds |
$615,000
|
show details |

|
#4
Silverwood Cir Apt 2
Annapolis, MD 21403
|
1,312 sq. feet
|
2 baths 2 beds |
$249,600
|
show details |

|
#5
Braden Loop
Glen Burnie, MD 21061
|
2,513 sq. feet
|
2 baths 3 beds |
show details | |

|
#6
Newton Ct
Upper Marlboro, MD 20772
|
1,092 sq. feet
|
2 baths 3 beds |
show details | |

|
#7
Arundel Rd
Pasadena, MD 21122
|
1,568 sq. feet
|
1 baths 3 beds |
show details | |

|
#8
Deale Rd
Tracys Landing, MD 20779
|
1,472 sq. feet
|
1 baths 3 beds |
show details | |

|
#9
Castle Harbour Way Unit 3d
Glen Burnie, MD 21060
|
994 sq. feet
|
2 baths 2 beds |
show details | |

|
#10
Dennis Rd
Shady Side, MD 20764
|
1,376 sq. feet
|
2 baths 3 beds |
show details |
| Photo | Address | Area | Beds / Baths | Price | Details |
|---|---|---|---|---|---|

|
#11
Scaffold Way
Odenton, MD 21113
|
1,664 sq. feet
|
4 baths 4 beds |
show details | |

|
#12
Parke West Dr
Glen Burnie, MD 21061
|
1,488 sq. feet
|
2 baths 3 beds |
show details | |

|
#13
S Meadow Dr
Glen Burnie, MD 21060
|
1,238 sq. feet
|
2 baths 4 beds |
show details | |

|
#14
Myrtle Ave
Bowie, MD 20720
|
3,436 sq. feet
|
2 baths 4 beds |
show details | |

|
#15
Sampson Ln
Grasonville, MD 21638
|
2,445 sq. feet
|
2 baths 4 beds |
show details | |

|
#16
Water Fountain Ct Unit 302
Glen Burnie, MD 21060
|
1,100 sq. feet
|
2 baths 3 beds |
show details | |

|
#17
Henderson Chapel Ln
Bowie, MD 20720
|
4,002 sq. feet
|
3 baths 4 beds |
show details | |

|
#18
Eddy Rd
Crownsville, MD 21032
|
1,100 sq. feet
|
2 baths 2 beds |
show details | |

|
#19
Steamboat Rd
Shady Side, MD 20764
|
1,240 sq. feet
|
1 baths - beds |
show details | |

|
#20
Oaklawn Ave
Annapolis, MD 21401
|
696 sq. feet
|
1 baths - beds |
show details |
| Photo | Address | Area | Beds / Baths | Price | Details |
|---|---|---|---|---|---|

|
#21
Deering Rd
Pasadena, MD 21122
|
1,026 sq. feet
|
1 baths 2 beds |
show details | |

|
#22
Lions Gate Ln
Odenton, MD 21113
|
1,262 sq. feet
|
3 baths - beds |
show details | |

|
#23
Eleanor Ln
Upper Marlboro, MD 20774
|
5,786 sq. feet
|
4 baths - beds |
show details | |

|
#24
Clark Station Rd
Severn, MD 21144
|
1,648 sq. feet
|
2 baths - beds |
show details | |

|
#25
River Park Rd
Bowie, MD 20715
|
3,596 sq. feet
|
2 baths - beds |
show details | |

|
#26
Heather Stone Loop
Glen Burnie, MD 21061
|
1,194 sq. feet
|
2 baths - beds |
show details | |

|
#27
Westphalia Ct
Glen Burnie, MD 21061
|
1,120 sq. feet
|
1 baths - beds |
show details | |

|
#28
Langston Dr
Bowie, MD 20715
|
1,256 sq. feet
|
1 baths - beds |
show details | |

|
#29
Meadow Drive
Glen Burnie, MD 21060
|
1,512 sq. feet
|
1 baths - beds |
show details | |

|
#30
W B And A Rd
Severn, MD 21144
|
995 sq. feet
|
1 baths - beds |
show details |
| Photo | Address | Area | Beds / Baths | Price | Details |
|---|---|---|---|---|---|

|
#31
Whipoorwill Dr
Deale, MD 20751
|
1,916 sq. feet
|
2 baths - beds |
show details | |

|
#32
Colonial Park Dr
Severn, MD 21144
|
3,040 sq. feet
|
3 baths - beds |
show details | |

|
#33
Binsted Rd
Glen Burnie, MD 21060
|
1,482 sq. feet
|
2 baths - beds |
show details | |

|
#34
Pembridge Ct
Bowie, MD 20716
|
2,734 sq. feet
|
2 baths - beds |
show details | |

|
#35
Red Ridge Pl
Bowie, MD 20715
|
2,056 sq. feet
|
2 baths - beds |
show details | |

|
#36
Lexington Dr
Severn, MD 21144
|
1,630 sq. feet
|
2 baths - beds |
show details | |

|
#37
Piller Ln
Bowie, MD 20716
|
1,160 sq. feet
|
1 baths - beds |
show details | |

|
#38
Manor Rd
Glen Burnie, MD 21061
|
1,575 sq. feet
|
2 baths - beds |
show details | |

|
#39
Nivelle Ct
Bowie, MD 20716
|
1,532 sq. feet
|
1 baths - beds |
show details | |

|
#40
Teton Dr
Lothian, MD 20711
|
1,125 sq. feet
|
1 baths - beds |
show details |
| Photo | Address | Area | Beds / Baths | Price | Details |
|---|---|---|---|---|---|

|
#41
Delmar Ave
Glen Burnie, MD 21061
|
1,392 sq. feet
|
1 baths - beds |
show details | |

|
#42
Pointer Ridge Dr
Bowie, MD 20716
|
1,269 sq. feet
|
3 baths - beds |
show details | |

|
#43
Old Stage Rd
Glen Burnie, MD 21061
|
1,344 sq. feet
|
1 baths - beds |
show details | |

|
#44
Lillian Ave
Severn, MD 21144
|
1,508 sq. feet
|
2 baths - beds |
show details | |

|
#45
Perkins Ln
Bowie, MD 20716
|
1,834 sq. feet
|
2 baths - beds |
show details | |

|
#46
Pernell Ct
Bowie, MD 20716
|
1,575 sq. feet
|
2 baths - beds |
show details | |

|
#47
Emory Ct
Bowie, MD 20716
|
1,434 sq. feet
|
2 baths - beds |
show details | |

|
#48
James Rd
Glen Burnie, MD 21061
|
1,704 sq. feet
|
1 baths - beds |
show details | |

|
#49
London Ln
Bowie, MD 20715
|
1,200 sq. feet
|
2 baths - beds |
show details | |

|
Check over 1 million property listings on Foreclosure.com!
|
browse all offers | |||


 | Comparing Crownsville, Gambrills and Davidsonville (15 replies) |
| Cool stuff to see in Maryland 'burbs? (13 replies) |
| Maryland the odd one (68 replies) |
| 2024 Olympics In Baltimore-Washington? (33 replies) |

Household type by relationship:
Households: 2,033- Male householders: 106 (41 living alone), Female householders: 42 (8 living alone)
87 spouses (87 opposite-sex spouses), 11 unmarried partners, (11 opposite-sex unmarried partners), 175 children (155 natural, 0 adopted, 20 stepchildren), 0 grandchildren, 0 brothers or sisters, 0 parents, 0 foster children, 0 other relatives, 5 non-relatives
- In group quarters: 1,605
Size of family households: 24 2-persons, 10 3-persons, 36 4-persons, 21 5-persons.
Size of nonfamily households: 51 1-person, 6 3-persons.
149 married couples with children.
16 single-parent households (0 men, 16 women).
86.0% of residents of Naval Academy speak English at home.
8.4% of residents speak Spanish at home (88% speak English very well, 12% speak English well).
0.6% of residents speak other Indo-European language at home (100% speak English very well).
2.8% of residents speak Asian or Pacific Island language at home (87% speak English very well, 13% speak English well).
0.2% of residents speak other language at home (100% speak English very well).
Foreign born population: 81 (4.0%)
(61.7% of them are naturalized citizens)
| Here: | -666666666.0 |
| State: | 7.3 |
| Here: | 5.2 |
| State: | 4.2 |

- Bedrooms in renter-occupied apartments in Naval Academy, Maryland
- 0no bedroom
- 01 bedroom
- 692 bedrooms
- 593 bedrooms
- 04 bedrooms
- 225+ bedrooms

- Cars and other vehicles available in Naval Academy in renter-occupied apartments
- 4no vehicle
- 701 vehicle
- 662 vehicles
- 103 vehicles
- 04 vehicles
- 05+ vehicles

- Rooms in renter-occupied apartments in Naval Academy, Maryland
- 01 room
- 02 rooms
- 423 rooms
- 134 rooms
- 55 rooms
- 386 rooms
- 147 rooms
- 168 rooms
- 229+ rooms

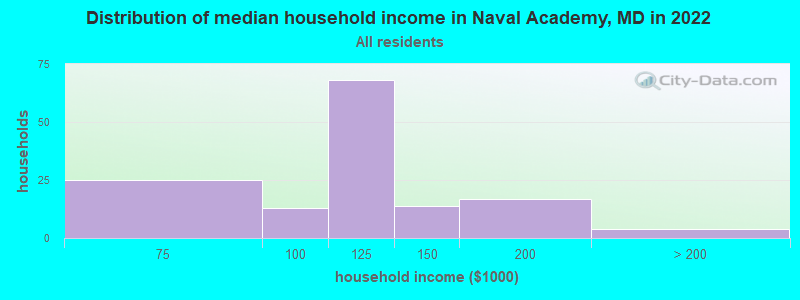
Naval Academy, MD household income distribution

- 25$60,000 to $74,999
- 13$75,000 to $99,999
- 68$100,000 to $124,999
- 14$125,000 to $149,999
- 17$150,000 to $199,999
- 4$200,000 or more
Rent paid by renters in 2022 in Naval Academy, MD
-
- 8$1,500 to $1,999
- 41$2,000 to $2,499
- 76$2,500 to $2,999
- 14$3,000 to $3,499
- 5$3,500 or more


Percentage of workers working in this county: 100.7%
Number of people working at home: 422 (25.1% of all workers)
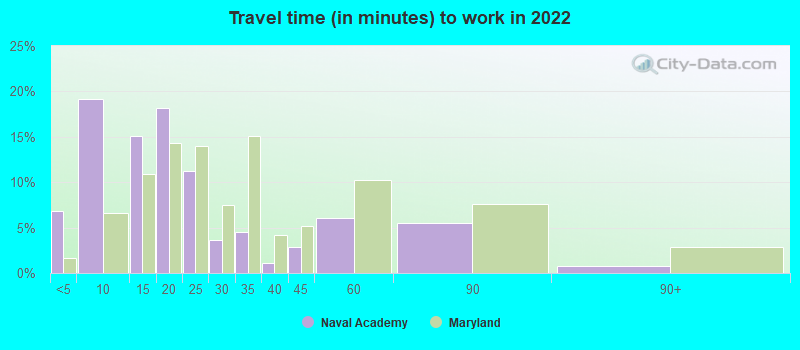
Travel time to work (commute)
- Less than 5 minutes: 227
- 5 to 9 minutes: 482
- 10 to 14 minutes: 220
- 15 to 19 minutes: 125
- 20 to 24 minutes: 18
- 25 to 29 minutes: 5
- 30 to 34 minutes: 69
- 35 to 39 minutes: 0
- 40 to 44 minutes: 0
- 45 to 59 minutes: 21
- 60 to 89 minutes: 4
- 90 or more minutes: 0
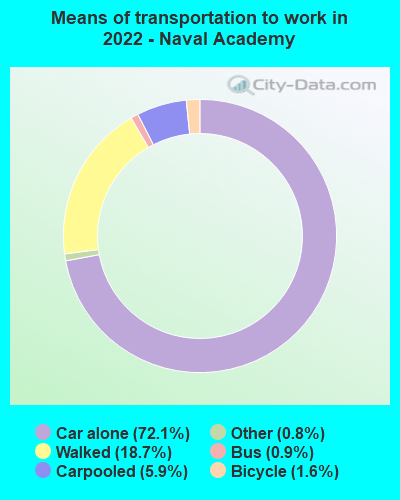
Means of transportation to work:
- Drove a car alone: 2,179 (62.2%)
- Carpooled: 180 (5.1%)
- Bus: 15 (0.4%)
- Taxi: 29 (0.8%)
- Bicycle: 54 (1.5%)
- Walked: 575 (16.4%)
- Worked at home: 422 (12.0%)

- Unemployment by race in 2022
- Unemployment rate for White non-Hispanic residents
- 3.5%Females

- Year of entry for the foreign-born population in Naval Academy, Maryland
- 392010 or later
- 322000 to 2009
- 131990 to 1999
- 481980 to 1989
- 01970 to 1979
- 5Before 1970

First ancestries reported:
- American: 146 (15.0%)
- German: 56 (5.7%)
- Irish: 45 (4.6%)
- Polish: 39 (4.0%)
- French: 35 (3.6%)
- European: 28 (2.9%)
- Northern European: 24 (2.5%)
- African: 20 (2.1%)
- Scottish: 18 (1.8%)
- Italian: 17 (1.7%)
- English: 16 (1.6%)
- Scotch-Irish: 14 (1.4%)
- Swedish: 10 (1.0%)
- Haitian: 10 (1.0%)
- Austrian: 8 (0.8%)
- British: 5 (0.5%)
- Russian: 4 (0.4%)
Most common places of birth for foreign-born residents (%):
| Naval Academy: | 21.4% (18) |
| Maryland: | 2.5% (24,026) |
| Naval Academy: | 16.7% (14) |
| Maryland: | 0.3% (3,203) |
| Naval Academy: | 11.9% (10) |
| Maryland: | 0.5% (4,901) |
| Naval Academy: | 10.7% (9) |
| Maryland: | 4.6% (44,742) |
| Naval Academy: | 9.5% (8) |
| Maryland: | 3.4% (32,635) |
| Naval Academy: | 9.5% (8) |
| Maryland: | 2.8% (27,444) |
| Naval Academy: | 8.3% (7) |
| Maryland: | 0.8% (8,109) |
| Naval Academy: | 6.0% (5) |
| Maryland: | 1.0% (9,481) |
| Naval Academy: | 3.6% (3) |
| Maryland: | 0.4% (3,418) |
| Naval Academy: | 3.6% (3) |
| Maryland: | 0.1% (1,098) |
| Naval Academy: | 2.4% (2) |
| Maryland: | 1.8% (17,774) |
Place of birth for U.S.-born residents:
- This state: 125
- Other state: 1,761
- Northeast: 337
- Midwest: 374
- South: 632
- West: 431
61.9% of Naval Academy residents lived in the same house 1 years ago.
Out of people who lived in different houses, 6.9% lived in this county.
Out of people who lived in different counties, 8.4% lived in Maryland.
| Naval Academy: | 61.9% |
| State average: | 88.5% |
Education attainment for males 25 years and older:
- No schooling: 0
- Nursery to 4th grade: 0
- 5th and 6th grade: 0
- 7th and 8th grade: 0
- 9th grade: 7
- 10th grade: 0
- 11th grade: 0
- 12th grade, no diploma: 0
- High school graduate (or equivalency): 122
- Less than 1 year of college: 20
- Some college more than 1 year, no degree: 50
- Associate degree: 63
- Bachelor's degree: 44
- Master's degree: 44
- Professional school degree: 0
- Doctorate degree: 6

Education attainment for females 25 years and older:
- No schooling: 0
- Nursery to 4th grade: 0
- 5th and 6th grade: 0
- 7th and 8th grade: 0
- 9th grade: 0
- 10th grade: 0
- 11th grade: 0
- 12th grade, no diploma: 0
- High school graduate (or equivalency): 19
- Less than 1 year of college: 16
- Some college more than 1 year, no degree: 8
- Associate degree: 10
- Bachelor's degree: 49
- Master's degree: 31
- Professional school degree: 0
- Doctorate degree: 5


Housing units in structures:
- One, detached: 13
- One, attached: 62
- 3 or 4: 13
- 5 to 9: 84
- 50 or more: 4

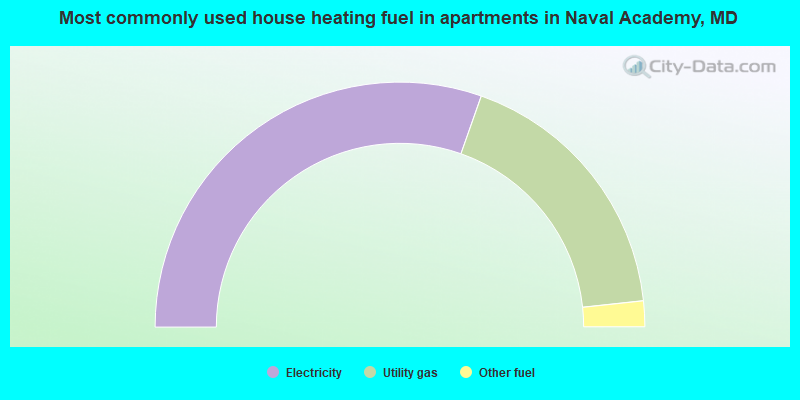
- 60.8%Electricity
- 35.8%Utility gas
- 3.4%Other fuel
Private vs. public school enrollment:
| Here: | 32.8% |
| Maryland: | 15.2% |
| Here: | 14.3% |
| Maryland: | 14.4% |
| Here: | 8.2% |
| Maryland: | 20.2% |

