Nebo Center, CA (California) Houses and Residents
| Nebo Center: | $262,498 |
| California: | $715,900 |
Total population: 1,361 (Urban population: 1,219 (all inside urban clusters), Rural population: 51 (all nonfarm))
Houses: 422 (372 occupied: 8 owner occupied, 364 renter occupied)
| % of renters here: | 98% |
| State: | 44% |
Housing density: 166 houses/condos per square mile
Median price asked for vacant for-sale houses and condos in 2022 in this county: $446,573.
Median contract rent in 2022: $1,487 (lower quartile is $1,272, upper quartile is $1,695)
Median rent asked for vacant for-rent units in 2022: $1,378
Median gross rent in Nebo Center, CA in 2022: $1,497
Housing units in Nebo Center with a mortgage: 0 (0 second mortgage, 0 home equity loan, 0 both second mortgage and home equity loan)
Houses without a mortgage: 8
Compare current foreclosures near Nebo Center, CA:
| Photo | Address | Area | Beds / Baths | Price | Details |
|---|---|---|---|---|---|

|
#1
Mirage Dr
Barstow, CA 92311
|
1,277 sq. feet
|
2 baths 3 beds |
$259,900
|
show details |

|
#2
W Buena Vista St
Barstow, CA 92311
|
1,418 sq. feet
|
1 baths 3 beds |
show details | |

|
#3
Cedar Rd
Barstow, CA 92311
|
2,274 sq. feet
|
1 baths 4 beds |
show details | |

|
#4
Pine Ave
Barstow, CA 92311
|
1,760 sq. feet
|
2 baths 3 beds |
show details | |

|
#5
E Fredricks St
Barstow, CA 92311
|
908 sq. feet
|
1 baths 1 beds |
show details | |

|
#6
Orchid St
Barstow, CA 92311
|
1,088 sq. feet
|
1 baths 3 beds |
show details | |

|
#7
Sierra Linda Dr
Barstow, CA 92311
|
1,268 sq. feet
|
2 baths 3 beds |
show details | |

|
#8
Neuman Rd
Barstow, CA 92311
|
804 sq. feet
|
1 baths 2 beds |
show details | |

|
#9
W Main St Spc 120
Barstow, CA 92311
|
1,344 sq. feet
|
2 baths 3 beds |
show details | |

|
#10
W Main St Spc 238
Barstow, CA 92311
|
1,152 sq. feet
|
2 baths 3 beds |
show details |
| Photo | Address | Area | Beds / Baths | Price | Details |
|---|---|---|---|---|---|

|
#11
W Main St Spc 95
Barstow, CA 92311
|
1,152 sq. feet
|
2 baths 2 beds |
show details | |

|
#12
Cinnabar Rd
Barstow, CA 92311
|
1,466 sq. feet
|
2 baths 3 beds |
show details | |

|
#13
Kelly Dr
Barstow, CA 92311
|
1,196 sq. feet
|
2 baths 4 beds |
show details | |

|
#14
Palermo St
Barstow, CA 92311
|
1,114 sq. feet
|
2 baths 3 beds |
show details | |

|
#15
Garnet Ave
Barstow, CA 92311
|
1,370 sq. feet
|
2 baths 3 beds |
show details | |

|
#16
Wisteria Ave
Barstow, CA 92311
|
1,902 sq. feet
|
2 baths 4 beds |
show details | |

|
#17
Frances Dr
Barstow, CA 92311
|
1,452 sq. feet
|
2 baths 4 beds |
show details | |

|
#18
Fenmore Dr
Barstow, CA 92311
|
1,168 sq. feet
|
2 baths 3 beds |
show details | |

|
#19
Palo Verde Dr
Barstow, CA 92311
|
1,630 sq. feet
|
2 baths 3 beds |
show details | |

|
#20
Tonopah St
Newberry Springs, CA 92365
|
2,339 sq. feet
|
3 baths 2 beds |
show details |
| Photo | Address | Area | Beds / Baths | Price | Details |
|---|---|---|---|---|---|

|
#21
Corral St
Yermo, CA 92398
|
- sq. feet
|
- baths - beds |
show details | |

|
#22
E Fredricks St
Barstow, CA 92311
|
- sq. feet
|
- baths - beds |
show details | |

|
#23
Berkeley Dr
Barstow, CA 92311
|
- sq. feet
|
- baths - beds |
show details | |

|
#24
Jellico St
Yermo, CA 92398
|
- sq. feet
|
- baths - beds |
show details | |

|
#25
E Virginia Way
Barstow, CA 92311
|
- sq. feet
|
- baths - beds |
show details | |

|
#26
Sylvan Ave
Barstow, CA 92311
|
- sq. feet
|
- baths - beds |
show details | |

|
#27
W Main St Spc 34
Barstow, CA 92311
|
- sq. feet
|
- baths - beds |
show details | |

|
#28
W Main 89
Barstow, CA 92311
|
- sq. feet
|
- baths - beds |
show details | |

|
#29
4th St
Yermo, CA 92398
|
- sq. feet
|
- baths - beds |
show details | |

|
Check over 1 million property listings on Foreclosure.com!
|
browse all offers | |||


Household type by relationship:
Households: 1,995,156- In family households: 1,806,692 (316,621 male householders, 153,819 female householders)
326,927 spouses, 702,690 children (651,870 natural, 13,840 adopted, 36,980 stepchildren), 77,808 grandchildren, 33,924 brothers or sisters, 32,128 parents, foster children, 57,507 other relatives, 76,592 non-relatives
- In nonfamily households: 188,464 (69,504 male householders (50,015 living alone)), 71,674 female householders (58,080 living alone)), 47,286 nonrelatives
- In group quarters: 40,054 (25,654 institutionalized population)
347,453 married couples with children.
128,727 single-parent households (32,391 men, 96,336 women).
84.7% of residents of Nebo Center speak English at home.
9.2% of residents speak Spanish at home (86% speak English very well, 14% speak English well).
2.9% of residents speak other Indo-European language at home (100% speak English very well).
2.7% of residents speak Asian or Pacific Island language at home (83% speak English very well, 17% speak English well).
0.5% of residents speak other language at home (100% speak English very well).
Foreign born population: 143 (8.8%)
(89.5% of them are naturalized citizens)
| Here: | 7.3 |
| State: | 6.0 |
| Here: | 5.4 |
| State: | 3.9 |

- Bedrooms in owner-occupied houses and condos in Nebo Center, California
- 0no bedroom
- 01 bedroom
- 02 bedrooms
- 83 bedrooms
- 04 bedrooms
- 05+ bedrooms

- Bedrooms in renter-occupied apartments in Nebo Center, California
- 0no bedroom
- 381 bedroom
- 1442 bedrooms
- 1033 bedrooms
- 794 bedrooms
- 05+ bedrooms

- Cars and other vehicles available in Nebo Center in owner-occupied houses/condos
- 0no vehicle
- 01 vehicle
- 82 vehicles
- 03 vehicles
- 04 vehicles
- 05+ vehicles

- Cars and other vehicles available in Nebo Center in renter-occupied apartments
- 0no vehicle
- 1411 vehicle
- 2032 vehicles
- 133 vehicles
- 74 vehicles
- 05+ vehicles

- Rooms in owner-occupied houses in Nebo Center, California
- 01 room
- 02 rooms
- 03 rooms
- 04 rooms
- 05 rooms
- 86 rooms
- 07 rooms
- 08 rooms
- 09+ rooms

- Rooms in renter-occupied apartments in Nebo Center, California
- 01 room
- 232 rooms
- 613 rooms
- 214 rooms
- 1485 rooms
- 386 rooms
- 457 rooms
- 288 rooms
- 09+ rooms

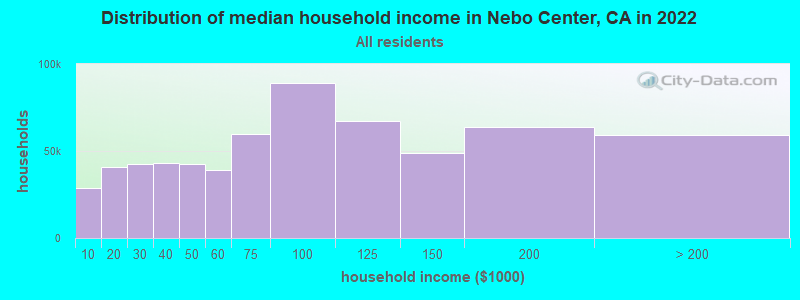
Nebo Center, CA household income distribution

- 28,500Less than $10,000
- 41,009$10,000 to $19,999
- 42,517$20,000 to $29,999
- 43,233$30,000 to $39,999
- 42,780$40,000 to $49,999
- 39,316$50,000 to $59,999
- 59,905$60,000 to $74,999
- 89,289$75,000 to $99,999
- 67,157$100,000 to $124,999
- 48,922$125,000 to $149,999
- 63,733$150,000 to $199,999
- 59,139$200,000 or more
Percentage of workers working in this county: 104.9%
Number of people working at home: 105 (10.9% of all workers)
Travel time to work (commute)
- Less than 5 minutes: 17
- 5 to 9 minutes: 141
- 10 to 14 minutes: 136
- 15 to 19 minutes: 107
- 20 to 24 minutes: 27
- 25 to 29 minutes: 0
- 30 to 34 minutes: 21
- 35 to 39 minutes: 28
- 40 to 44 minutes: 16
- 45 to 59 minutes: 153
- 60 to 89 minutes: 4
- 90 or more minutes: 0
Means of transportation to work:
- Drove a car alone: 430 (66.2%)
- Carpooled: 120 (18.5%)
- Motorcycle: 8 (1.2%)
- Bicycle: 16 (2.5%)
- Walked: 76 (11.7%)


- Year of entry for the foreign-born population in Nebo Center, California
- 51995 to March 2000
- 251990 to 1994
- 101985 to 1989
- 251980 to 1984
- 121975 to 1979
- 121970 to 1974
- 01965 to 1969
- 8Before 1965

First ancestries reported:
- Other: 726 (56.8%)
- English: 133 (10.4%)
- German: 92 (7.2%)
- United States: 65 (5.1%)
- Irish: 39 (3.1%)
- Italian: 36 (2.8%)
- French: 33 (2.6%)
- Subsaharan African: 29 (2.3%)
- West Indian: 28 (2.2%)
- Scottish: 23 (1.8%)
- Scotch-Irish: 16 (1.3%)
- Polish: 14 (1.1%)
- Welsh: 13 (1.0%)
- Swiss: 10 (0.8%)
- Russian: 9 (0.7%)
- Dutch: 6 (0.5%)
- Swedish: 6 (0.5%)
Most common places of birth for foreign-born residents (%):
| Nebo Center: | 16.5% (16) |
| California: | 44.3% (3,928,701) |
| Nebo Center: | 11.3% (11) |
| California: | 2.2% (198,201) |
| Nebo Center: | 11.3% (11) |
| California: | 0.1% (11,669) |
| Nebo Center: | 8.2% (8) |
| California: | 1.1% (98,160) |
| Nebo Center: | 8.2% (8) |
| California: | 0.1% (12,122) |
| Nebo Center: | 7.2% (7) |
| California: | 0.2% (15,712) |
| Nebo Center: | 6.2% (6) |
| California: | 0.7% (62,114) |
| Nebo Center: | 6.2% (6) |
| California: | 0.1% (6,717) |
| Nebo Center: | 5.2% (5) |
| California: | 0.1% (7,530) |
| Nebo Center: | 5.2% (5) |
| California: | 7.5% (664,935) |
| Nebo Center: | 5.2% (5) |
| California: | 0.2% (16,944) |
| Nebo Center: | 5.2% (5) |
| California: | 0.6% (53,250) |
| Nebo Center: | 4.1% (4) |
| California: | 2.4% (211,458) |
Place of birth for U.S.-born residents:
- This state: 389
- Other state: 651
- Northeast: 66
- Midwest: 127
- South: 279
- West: 179
10% of Nebo Center residents lived in the same house 5 years ago.
Out of people who lived in different houses, 9% lived in this county.
Out of people who lived in different counties, 30% lived in California.
Education attainment for males 25 years and older:
- No schooling: 0
- Nursery to 4th grade: 0
- 5th and 6th grade: 0
- 7th and 8th grade: 0
- 9th grade: 0
- 10th grade: 0
- 11th grade: 0
- 12th grade, no diploma: 4
- High school graduate (or equivalency): 74
- Less than 1 year of college: 43
- Some college more than 1 year, no degree: 61
- Associate degree: 45
- Bachelor's degree: 35
- Master's degree: 8
- Professional school degree: 9
- Doctorate degree: 0

Education attainment for females 25 years and older:
- No schooling: 0
- Nursery to 4th grade: 0
- 5th and 6th grade: 0
- 7th and 8th grade: 0
- 9th grade: 9
- 10th grade: 6
- 11th grade: 9
- 12th grade, no diploma: 0
- High school graduate (or equivalency): 98
- Less than 1 year of college: 50
- Some college more than 1 year, no degree: 27
- Associate degree: 15
- Bachelor's degree: 8
- Master's degree: 6
- Professional school degree: 5
- Doctorate degree: 0


Housing units in structures:
- One, detached: 189
- One, attached: 201
- Two: 7
- 3 or 4: 14
- 10 to 19: 11
Housing units lacking complete kitchen facilities: 3.6%

Private vs. public school enrollment:
| Here: | 2.8% |
| California: | 9.9% |
| Here: | 8.2% |
| California: | 7.8% |
| Here: | 9.9% |
| California: | 15.4% |


