Nederland, TX (Texas) Houses and Residents
| Nederland: | $185,318 |
| Texas: | $275,400 |
Total population: 17,108 (All urban)
Houses: 8,226 (7,365 occupied: 5,430 owner occupied, 2,074 renter occupied)
| % of renters here: | 28% |
| State: | 38% |
Housing density: 1,446 houses/condos per square mile
Median price asked for vacant for-sale houses and condos in 2022: $345,921.
Median contract rent in 2022: $1,048 (lower quartile is $844, upper quartile is $1,507)
Median rent asked for vacant for-rent units in 2022: $1,500
Median gross rent in Nederland, TX in 2022: $1,266
Housing units in Nederland with a mortgage: 2,816 (174 second mortgage, 10 home equity loan, 91 both second mortgage and home equity loan)
Houses without a mortgage: 152
Median household income for houses/condos with a mortgage: $112,492
Median household income for apartments without a mortgage: $60,689
Median monthly housing costs: $1,175
Compare current foreclosures in Nederland, TX:
| Photo | Address | Area | Beds / Baths | Price | Details |
|---|---|---|---|---|---|

|
#1
S 2nd St
Nederland, TX 77627
|
1,000 sq. feet
|
- baths - beds |
show details | |

|
#2
Shannon Ln
Nederland, TX 77627
|
1,816 sq. feet
|
- baths - beds |
show details | |

|
#3
Nederland Ave
Nederland, TX 77627
|
- sq. feet
|
- baths - beds |
show details | |

|
#4
Boston Ave
Nederland, TX 77627
|
- sq. feet
|
- baths - beds |
show details | |

|
#5
N 22nd St
Nederland, TX 77627
|
1,440 sq. feet
|
- baths - beds |
show details | |

|
#6
Avenue H
Nederland, TX 77627
|
- sq. feet
|
- baths - beds |
show details | |

|
#7
Knickerbocker Dr
Nederland, TX 77627
|
1,436 sq. feet
|
- baths - beds |
show details | |

|
#8
N 32nd St
Nederland, TX 77627
|
1,030 sq. feet
|
- baths - beds |
show details | |

|
#9
N 27th St
Nederland, TX 77627
|
2,927 sq. feet
|
- baths - beds |
show details | |

|
#10
Allan Ct
Nederland, TX 77627
|
2,877 sq. feet
|
- baths - beds |
show details |
| Photo | Address | Area | Beds / Baths | Price | Details |
|---|---|---|---|---|---|

|
#11
Central Blvd
Nederland, TX 77627
|
- sq. feet
|
- baths - beds |
show details | |

|
#12
S 29th St Apt 102
Nederland, TX 77627
|
- sq. feet
|
- baths - beds |
show details | |

|
#13
S 5th 1/2 St
Nederland, TX 77627
|
1,788 sq. feet
|
- baths - beds |
show details | |

|
#14
Avenue E
Nederland, TX 77627
|
1,650 sq. feet
|
- baths - beds |
show details | |

|
#15
Nederland Ave
Nederland, TX 77627
|
- sq. feet
|
- baths - beds |
show details | |

|
#16
Atlanta Ave
Nederland, TX 77627
|
768 sq. feet
|
- baths - beds |
show details | |

|
#17
S 10th 1/2 St
Nederland, TX 77627
|
1,494 sq. feet
|
- baths - beds |
show details | |

|
#18
Lamar Ave
Nederland, TX 77627
|
1,015 sq. feet
|
- baths - beds |
show details | |

|
#19
S 37th St
Nederland, TX 77627
|
1,016 sq. feet
|
- baths - beds |
show details | |

|
#20
S 3rd 1/2 St
Nederland, TX 77627
|
- sq. feet
|
- baths - beds |
show details |
| Photo | Address | Area | Beds / Baths | Price | Details |
|---|---|---|---|---|---|

|
#21
Avenue G
Nederland, TX 77627
|
1,682 sq. feet
|
- baths - beds |
show details | |

|
#22
S 15th St
Nederland, TX 77627
|
- sq. feet
|
- baths - beds |
show details | |

|
#23
S 16th St
Nederland, TX 77627
|
1,380 sq. feet
|
- baths - beds |
show details | |

|
#24
S 2nd St
Nederland, TX 77627
|
1,320 sq. feet
|
- baths - beds |
show details | |

|
#25
Canal Ave
Nederland, TX 77627
|
- sq. feet
|
- baths - beds |
show details | |

|
#26
Divya Blvd
Nederland, TX 77627
|
- sq. feet
|
- baths - beds |
show details | |

|
#27
S 12th St
Nederland, TX 77627
|
- sq. feet
|
- baths - beds |
show details | |

|
#28
N 10th St
Nederland, TX 77627
|
1,120 sq. feet
|
- baths - beds |
show details | |

|
#29
S 21st St
Nederland, TX 77627
|
1,848 sq. feet
|
- baths - beds |
show details | |

|
#30
Avenue C
Nederland, TX 77627
|
- sq. feet
|
- baths - beds |
show details |
| Photo | Address | Area | Beds / Baths | Price | Details |
|---|---|---|---|---|---|

|
#31
N 31st St
Nederland, TX 77627
|
- sq. feet
|
- baths - beds |
show details | |

|
Check over 1 million property listings on Foreclosure.com!
|
browse all offers | |||

Latest news about housing in Nederland, TX collected exclusively by city-data.com from local newspapers, TV, and radio stations

 | Nederland Senior Apartments (0 replies) |
| Having to relocate to Orange, Tx for work - Apartments? (7 replies) |
| Where all in Texas have y'all lived??? (62 replies) |
| Is Dallas green with trees? Are people friendly? (161 replies) |
| If you work near Sabine Pass.... (2 replies) |
| Changed my mind! I'm moving to Houston (34 replies) |
Median year apartment built: 1980
Household type by relationship:
Households: 18,269- Male householders: 3,337 (881 living alone), Female householders: 3,817 (1,124 living alone)
3,491 spouses (3,460 opposite-sex spouses), 378 unmarried partners, (364 opposite-sex unmarried partners), 5,881 children (5,045 natural, 372 adopted, 463 stepchildren), 382 grandchildren, 232 brothers or sisters, 213 parents, 0 foster children, 162 other relatives, 364 non-relatives
- In group quarters: 7
Size of family households: 1,945 2-persons, 1,360 3-persons, 1,045 4-persons, 707 5-persons, 47 6-persons, 129 7-or-more-persons.
Size of nonfamily households: 1,879 1-person, 454 2-persons, 25 3-persons.
2,952 married couples with children.
1,028 single-parent households (182 men, 846 women).
86.7% of residents of Nederland speak English at home.
9.5% of residents speak Spanish at home (64% speak English very well, 26% speak English well, 9% speak English not well, 1% don't speak English at all).
2.0% of residents speak other Indo-European language at home (59% speak English very well, 15% speak English well, 22% speak English not well, 3% don't speak English at all).
1.1% of residents speak Asian or Pacific Island language at home (58% speak English very well, 17% speak English well, 13% speak English not well, 11% don't speak English at all).
0.6% of residents speak other language at home (31% speak English very well, 60% speak English well, 10% don't speak English at all).
Foreign born population: 1,004 (5.5%)
(56.9% of them are naturalized citizens)
| Here: | 6.0 |
| State: | 6.3 |
| Here: | 4.9 |
| State: | 4.0 |
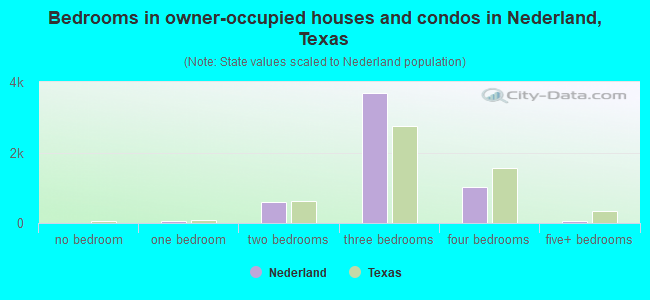
- Bedrooms in owner-occupied houses and condos in Nederland, Texas
- 12no bedroom
- 501 bedroom
- 6002 bedrooms
- 3,7003 bedrooms
- 1,0094 bedrooms
- 605+ bedrooms
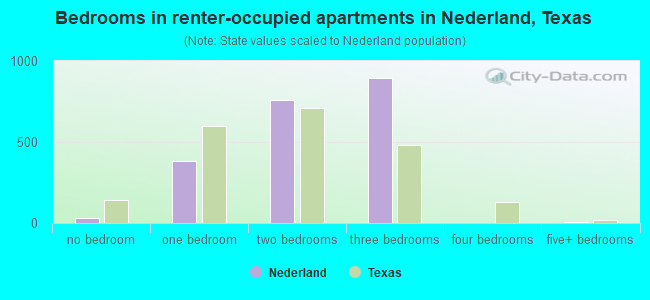
- Bedrooms in renter-occupied apartments in Nederland, Texas
- 29no bedroom
- 3841 bedroom
- 7602 bedrooms
- 8943 bedrooms
- 04 bedrooms
- 85+ bedrooms
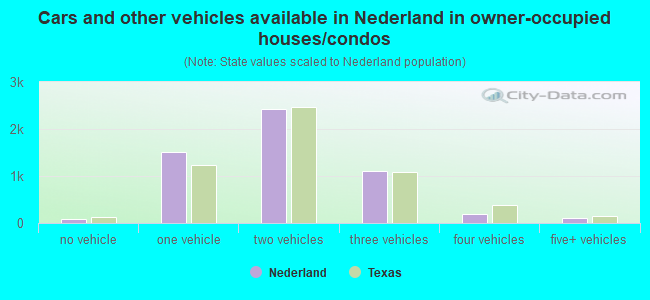
- Cars and other vehicles available in Nederland in owner-occupied houses/condos
- 87no vehicle
- 1,5151 vehicle
- 2,4272 vehicles
- 1,1113 vehicles
- 1914 vehicles
- 995+ vehicles
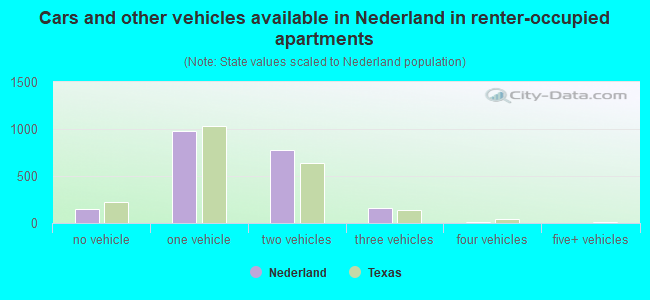
- Cars and other vehicles available in Nederland in renter-occupied apartments
- 149no vehicle
- 9841 vehicle
- 7722 vehicles
- 1623 vehicles
- 74 vehicles
- 05+ vehicles
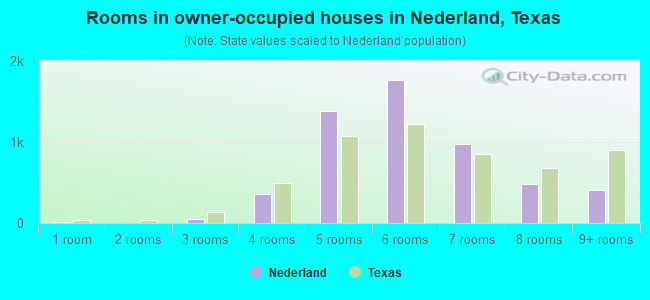
- Rooms in owner-occupied houses in Nederland, Texas
- 121 room
- 02 rooms
- 523 rooms
- 3564 rooms
- 1,3805 rooms
- 1,7696 rooms
- 9797 rooms
- 4798 rooms
- 4039+ rooms
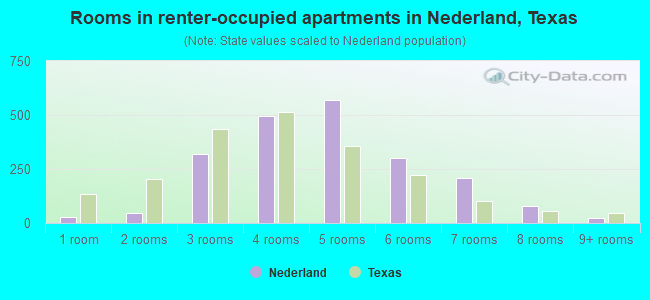
- Rooms in renter-occupied apartments in Nederland, Texas
- 291 room
- 472 rooms
- 3183 rooms
- 4954 rooms
- 5715 rooms
- 3006 rooms
- 2097 rooms
- 808 rooms
- 249+ rooms
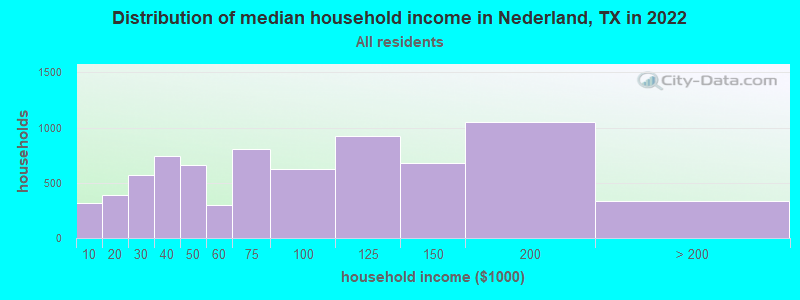
Nederland, TX household income distribution

- 318Less than $10,000
- 385$10,000 to $19,999
- 570$20,000 to $29,999
- 744$30,000 to $39,999
- 663$40,000 to $49,999
- 295$50,000 to $59,999
- 810$60,000 to $74,999
- 627$75,000 to $99,999
- 924$100,000 to $124,999
- 677$125,000 to $149,999
- 1,050$150,000 to $199,999
- 331$200,000 or more
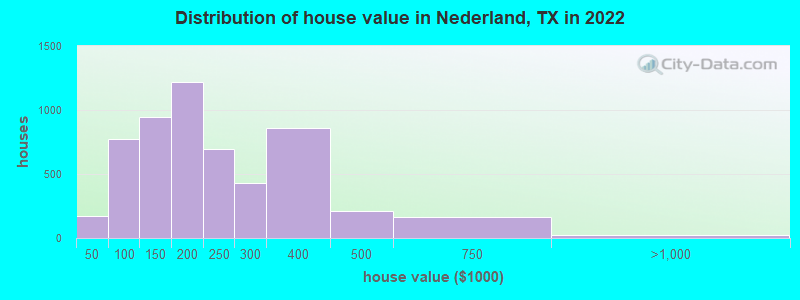
Home value of owner - occupied houses in 2022 in Nederland, TX
-
- 61Less than $10,000
- 44$15,000 to $19,999
- 12$20,000 to $24,999
- 13$25,000 to $29,999
- 31$30,000 to $34,999
- 5$40,000 to $49,999
- 104$50,000 to $59,999
- 59$60,000 to $69,999
- 201$70,000 to $79,999
- 272$80,000 to $89,999
- 131$90,000 to $99,999
- 421$100,000 to $124,999
- 521$125,000 to $149,999
- 690$150,000 to $174,999
- 527$175,000 to $199,999
- 694$200,000 to $249,999
- 429$250,000 to $299,999
- 859$300,000 to $399,999
- 214$400,000 to $499,999
- 165$500,000 to $749,999
- 27$750,000 to $999,999
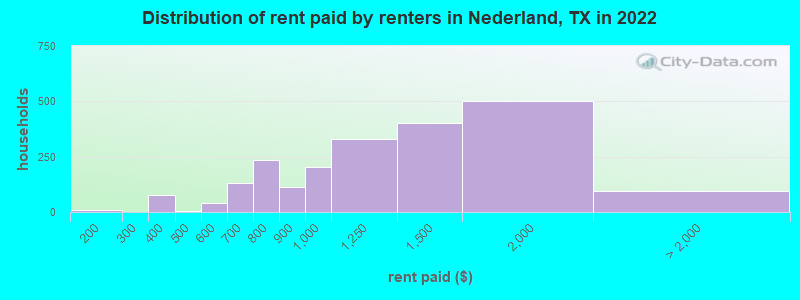
Rent paid by renters in 2022 in Nederland, TX
-
- 10$100 to $149
- 38$300 to $349
- 35$350 to $399
- 3$450 to $499
- 31$500 to $549
- 8$550 to $599
- 63$600 to $649
- 68$650 to $699
- 31$700 to $749
- 203$750 to $799
- 111$800 to $899
- 201$900 to $999
- 330$1,000 to $1,249
- 403$1,250 to $1,499
- 501$1,500 to $1,999
- 93No cash rent
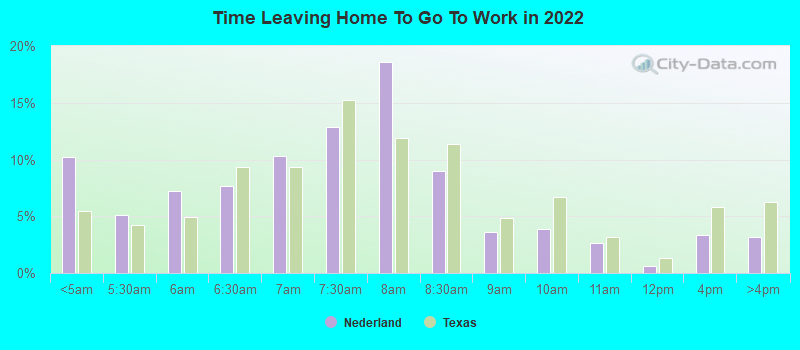
Percentage of workers working in this county: 94.2%
Number of people working at home: 318 (3.5% of all workers)
Travel time to work (commute)
- Less than 5 minutes: 335
- 5 to 9 minutes: 1,231
- 10 to 14 minutes: 1,355
- 15 to 19 minutes: 1,461
- 20 to 24 minutes: 1,939
- 25 to 29 minutes: 245
- 30 to 34 minutes: 859
- 35 to 39 minutes: 141
- 40 to 44 minutes: 77
- 45 to 59 minutes: 77
- 60 to 89 minutes: 173
- 90 or more minutes: 159
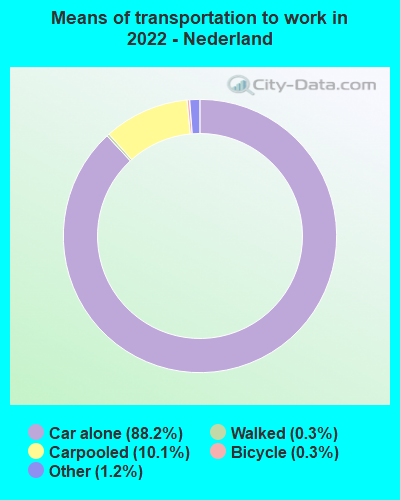
Means of transportation to work:
- Drove a car alone: 5,836 (80.8%)
- Carpooled: 729 (10.1%)
- Taxi: 94 (1.3%)
- Bicycle: 17 (0.2%)
- Walked: 18 (0.2%)
- Worked at home: 318 (4.4%)
- Unemployment by race in 2022
- Unemployment rate for White non-Hispanic residents
- 5.6%Males
- 1.7%Females
- Unemployment rate for Black residents
- 1.6%Females
- Unemployment rate for Asian residents
- 10.5%Males
- Unemployment rate for two or more race residents
- 6.5%Males
- 16.1%Females
- Unemployment rate for Hispanic or Latino residents
- 3.7%Males
- 7.1%Females
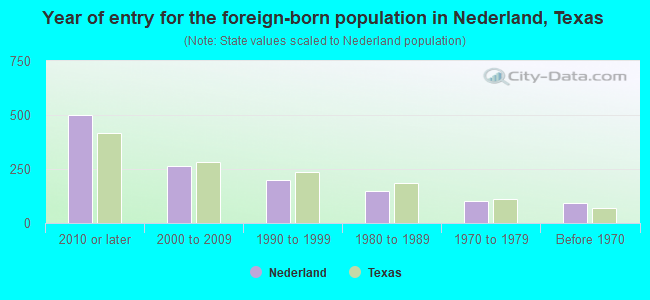
- Year of entry for the foreign-born population in Nederland, Texas
- 5012010 or later
- 2632000 to 2009
- 1991990 to 1999
- 1461980 to 1989
- 1011970 to 1979
- 94Before 1970
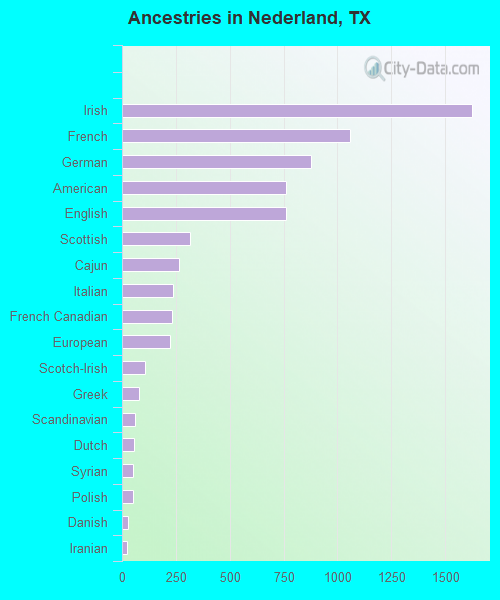
First ancestries reported:
- Irish: 1,623 (16.8%)
- French: 1,059 (11.0%)
- German: 877 (9.1%)
- American: 762 (7.9%)
- English: 760 (7.9%)
- Scottish: 318 (3.3%)
- Cajun: 265 (2.8%)
- Italian: 239 (2.5%)
- French Canadian: 231 (2.4%)
- European: 223 (2.3%)
- Scotch-Irish: 107 (1.1%)
- Greek: 80 (0.8%)
- Scandinavian: 61 (0.6%)
- Dutch: 54 (0.6%)
- Syrian: 53 (0.6%)
- Polish: 51 (0.5%)
- Danish: 27 (0.3%)
- Iranian: 23 (0.2%)
- British: 14 (0.1%)
- Eastern European: 13 (0.1%)
- Finnish: 13 (0.1%)
- Northern European: 9 (0.09%)
- Hungarian: 8 (0.08%)
- Norwegian: 8 (0.08%)
- Welsh: 7 (0.07%)
- Czech: 5 (0.05%)
Most common places of birth for foreign-born residents (%):
| Nederland: | 33.4% (351) |
| Texas: | 48.4% (2,411,723) |
| Nederland: | 15.5% (163) |
| Texas: | 3.0% (147,182) |
| Nederland: | 13.6% (143) |
| Texas: | 2.1% (103,148) |
| Nederland: | 8.4% (88) |
| Texas: | 1.3% (62,978) |
| Nederland: | 7.1% (75) |
| Texas: | 4.5% (224,455) |
| Nederland: | 5.1% (54) |
| Texas: | 6.1% (306,347) |
| Nederland: | 4.9% (52) |
| Texas: | 0.4% (21,746) |
| Nederland: | 3.3% (35) |
| Texas: | 3.7% (184,770) |
| Nederland: | 2.8% (29) |
| Texas: | 0.1% (6,586) |
| Nederland: | 1.6% (17) |
| Texas: | 0.1% (5,595) |
| Nederland: | 1.5% (16) |
| Texas: | 0.1% (4,409) |
Place of birth for U.S.-born residents:
- This state: 12,836
- Other state: 4,067
- Northeast: 272
- Midwest: 593
- South: 1,997
- West: 1,185
88.1% of Nederland residents lived in the same house 1 years ago.
Out of people who lived in different houses, 31.8% lived in this county.
Out of people who lived in different counties, 53.7% lived in Texas.
| Nederland: | 88.1% |
| State average: | 85.7% |
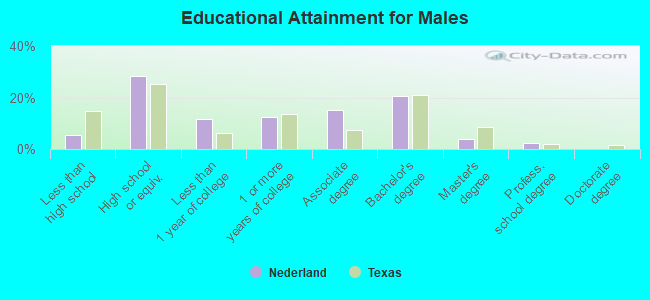
Education attainment for males 25 years and older:
- No schooling: 45
- Nursery to 4th grade: 0
- 5th and 6th grade: 7
- 7th and 8th grade: 0
- 9th grade: 64
- 10th grade: 2
- 11th grade: 83
- 12th grade, no diploma: 123
- High school graduate (or equivalency): 1,653
- Less than 1 year of college: 678
- Some college more than 1 year, no degree: 710
- Associate degree: 875
- Bachelor's degree: 1,191
- Master's degree: 232
- Professional school degree: 127
- Doctorate degree: 4
Education attainment for females 25 years and older:
- No schooling: 103
- Nursery to 4th grade: 30
- 5th and 6th grade: 9
- 7th and 8th grade: 30
- 9th grade: 55
- 10th grade: 108
- 11th grade: 35
- 12th grade, no diploma: 61
- High school graduate (or equivalency): 1,496
- Less than 1 year of college: 569
- Some college more than 1 year, no degree: 922
- Associate degree: 1,178
- Bachelor's degree: 1,664
- Master's degree: 396
- Professional school degree: 41
- Doctorate degree: 21

Housing units in structures:
- One, detached: 6,757
- One, attached: 120
- Two: 174
- 3 or 4: 80
- 5 to 9: 493
- 10 to 19: 167
- 50 or more: 109
- Mobile homes: 266
- Boats, RVs, vans, etc.: 58
Median worth of mobile homes: $77,070
Housing units lacking complete kitchen facilities in 2022: 5.2%
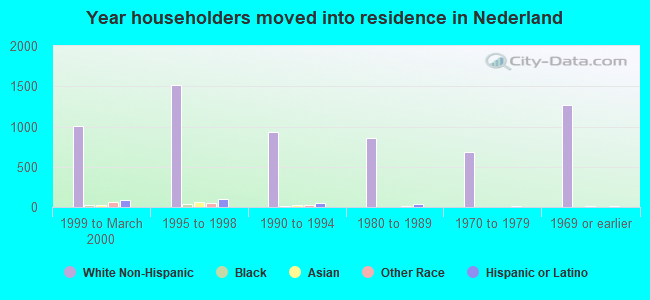
House/condo owner moved in on average 13 years ago
Renter moved in on average 3 years ago
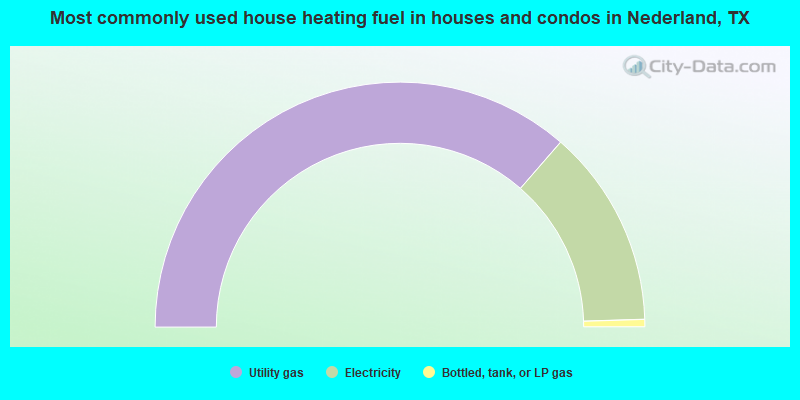
- 72.8%Utility gas
- 26.2%Electricity
- 1.0%Bottled, tank, or LP gas
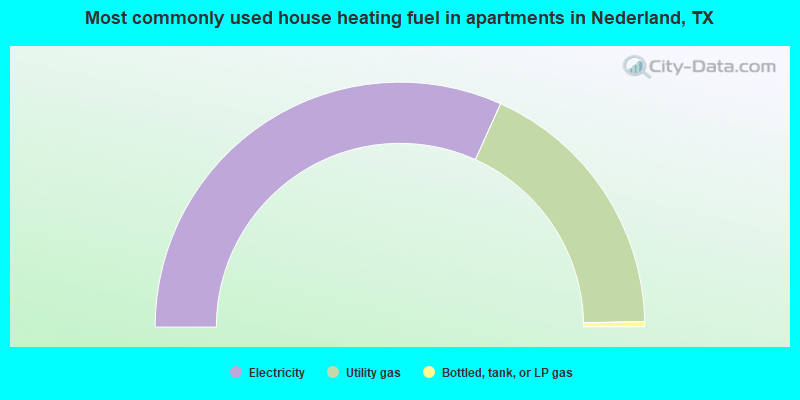
- 63.5%Electricity
- 35.8%Utility gas
- 0.7%Bottled, tank, or LP gas
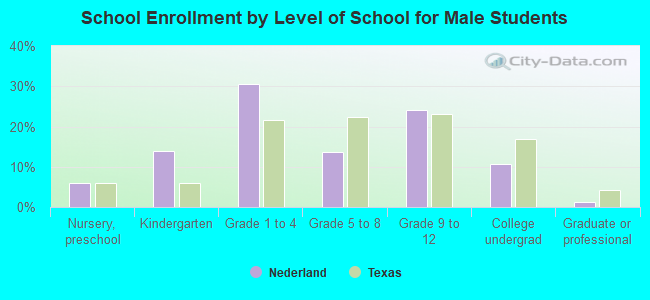
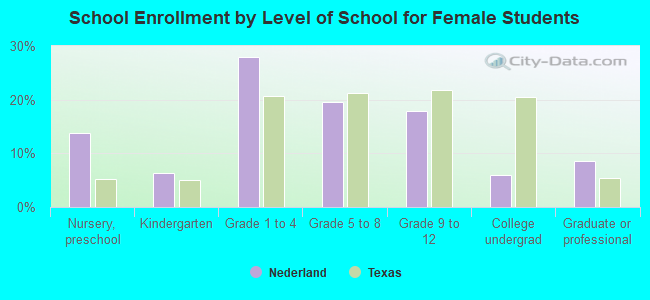
Private vs. public school enrollment:
| Here: | 7.8% |
| Texas: | 8.8% |
| Here: | 10.2% |
| Texas: | 8.0% |
| Here: | 15.8% |
| Texas: | 16.2% |