Neptune City, NJ (New Jersey) Houses and Residents
| Neptune City: | $408,636 |
| New Jersey: | $428,900 |
Mean price in 2022:
Detached houses: $412,832
Here: $412,832 State: $537,591 Townhouses or other attached units: $437,641
Here: $437,641 State: $381,113 In 5-or-more-unit structures: $322,474
Here: $322,474 State: $368,745 Mobile homes: $72,313
Here: $72,313 State: $119,788
Total population: 4,827 (All urban)
Houses: 2,399 (2,230 occupied: 1,317 owner occupied, 952 renter occupied)
| % of renters here: | 42% |
| State: | 35% |
Housing density: 2,640 houses/condos per square mile
Median price asked for vacant for-sale houses and condos in 2022 in this county: $430,351.
Median contract rent in 2022: $1,191 (lower quartile is $1,034, upper quartile is $1,484)
Median rent asked for vacant for-rent units in 2022: $1,182
Median gross rent in Neptune City, NJ in 2022: $1,304
Housing units in Neptune City with a mortgage: 1,042 (158 second mortgage, 0 home equity loan, 101 both second mortgage and home equity loan)
Houses without a mortgage: 30
Median household income for houses/condos with a mortgage: $105,673
Median household income for apartments without a mortgage: $84,199
Median monthly housing costs: $1,621
Compare current foreclosures near Neptune City, NJ:
| Photo | Address | Area | Beds / Baths | Price | Details |
|---|---|---|---|---|---|

|
#1
-11 Spring St
Red Bank, NJ 07701
|
1,096 sq. feet
|
1 baths 2 beds |
show details | |

|
#2
Crawford Street
Red Bank, NJ 07701
|
1,280 sq. feet
|
1 baths 2 beds |
show details | |

|
#3
Church Rd
Toms River, NJ 08753
|
2,300 sq. feet
|
3 baths 3 beds |
show details | |

|
#4
Maple Manor Ct
Toms River, NJ 08755
|
5,243 sq. feet
|
5 baths 6 beds |
show details | |

|
#5
Oakwood Rd
Point Pleasant Beach, NJ 08742
|
960 sq. feet
|
1 baths 3 beds |
show details | |

|
#6
Argyll Cir
Lakewood, NJ 08701
|
858 sq. feet
|
1 baths 2 beds |
show details | |

|
#7
Brighton Ave
Belmar, NJ 07719
|
3,232 sq. feet
|
3 baths 4 beds |
show details | |

|
#8
Hanover Way
Toms River, NJ 08755
|
- sq. feet
|
3 baths 5 beds |
show details | |

|
#9
Knolls Dr
Jackson, NJ 08527
|
3,200 sq. feet
|
3 baths 4 beds |
show details | |

|
#10
Crestwood Dr
Freehold, NJ 07728
|
1,708 sq. feet
|
3 baths 3 beds |
show details |
| Photo | Address | Area | Beds / Baths | Price | Details |
|---|---|---|---|---|---|

|
#11
Forest Glen Ct
Toms River, NJ 08755
|
3,509 sq. feet
|
4 baths 5 beds |
show details | |

|
#12
Orange Dr
Marlboro, NJ 07746
|
1,800 sq. feet
|
2 baths 2 beds |
show details | |

|
#13
Maple St
Belmar, NJ 07719
|
4,173 sq. feet
|
3 baths 3 beds |
show details | |

|
#14
Drs James Parker Blvd
Red Bank, NJ 07701
|
1,032 sq. feet
|
1 baths 2 beds |
show details | |

|
#15
Wilkinson Dr
Toms River, NJ 08755
|
2,370 sq. feet
|
2 baths 4 beds |
show details | |

|
#16
Sunset Ave
Point Pleasant Beach, NJ 08742
|
1,504 sq. feet
|
2 baths 3 beds |
show details | |

|
#17
Fife Ct
Lakewood, NJ 08701
|
982 sq. feet
|
1 baths 2 beds |
show details | |

|
#18
Curtis Ave
Point Pleasant Beach, NJ 08742
|
1,664 sq. feet
|
2 baths 3 beds |
show details | |

|
#19
Birch Bark Dr
Brick, NJ 08723
|
1,872 sq. feet
|
2 baths 3 beds |
show details | |

|
#20
Algonkin Trl
Manasquan, NJ 08736
|
2,190 sq. feet
|
2 baths 3 beds |
show details |
| Photo | Address | Area | Beds / Baths | Price | Details |
|---|---|---|---|---|---|

|
#21
Palmer Ave
Neptune, NJ 07753
|
1,262 sq. feet
|
2 baths 3 beds |
show details | |

|
#22
Dudley St
Long Branch, NJ 07740
|
1,668 sq. feet
|
1 baths 3 beds |
show details | |

|
#23
Main St
Belmar, NJ 07719
|
1,404 sq. feet
|
1 baths 3 beds |
show details | |

|
#24
Maurice Ave
Holmdel, NJ 07733
|
1,296 sq. feet
|
2 baths 3 beds |
show details | |

|
#25
Summerfield Ave
Asbury Park, NJ 07712
|
1,215 sq. feet
|
2 baths 3 beds |
show details | |

|
#26
Crine Rd
Morganville, NJ 07751
|
3,058 sq. feet
|
3 baths 5 beds |
show details | |

|
#27
Horizon Dr
Toms River, NJ 08755
|
1,284 sq. feet
|
3 baths 3 beds |
show details | |

|
#28
Bangs Ave
Asbury Park, NJ 07712
|
1,564 sq. feet
|
2 baths 6 beds |
show details | |

|
#29
Stokes St
Freehold, NJ 07728
|
1,120 sq. feet
|
2 baths 3 beds |
show details | |

|
#30
Yellowwood Ct
Jackson, NJ 08527
|
2,376 sq. feet
|
3 baths 4 beds |
show details |
| Photo | Address | Area | Beds / Baths | Price | Details |
|---|---|---|---|---|---|

|
#31
Curtis Ave
Point Pleasant Beach, NJ 08742
|
920 sq. feet
|
1 baths 2 beds |
show details | |

|
#32
Christy Ln
Asbury Park, NJ 07712
|
2,405 sq. feet
|
3 baths 4 beds |
show details | |

|
#33
Leone Dr
Brick, NJ 08724
|
1,538 sq. feet
|
2 baths 4 beds |
show details | |

|
#34
Nicholas Rd
Brick, NJ 08724
|
1,904 sq. feet
|
2 baths 3 beds |
show details | |

|
#35
Sewall Ave
Asbury Park, NJ 07712
|
1,070 sq. feet
|
1 baths 3 beds |
show details | |

|
#36
Brookfield Dr
Brick, NJ 08723
|
1,634 sq. feet
|
2 baths 4 beds |
show details | |

|
#37
Sunset Ave
Point Pleasant Beach, NJ 08742
|
1,137 sq. feet
|
1 baths 3 beds |
show details | |

|
#38
Sewall Ave
Asbury Park, NJ 07712
|
1,280 sq. feet
|
2 baths 3 beds |
show details | |

|
#39
Asbury Ave
Asbury Park, NJ 07712
|
1,284 sq. feet
|
2 baths 3 beds |
show details | |

|
#40
1st Ave
Asbury Park, NJ 07712
|
1,318 sq. feet
|
1 baths 2 beds |
show details |
| Photo | Address | Area | Beds / Baths | Price | Details |
|---|---|---|---|---|---|

|
#41
Lexington Ct
Jackson, NJ 08527
|
960 sq. feet
|
2 baths 2 beds |
show details | |

|
#42
15th Ave
Belmar, NJ 07719
|
1,138 sq. feet
|
1 baths 3 beds |
show details | |

|
#43
Monmouth Ave Apt B3
Spring Lake, NJ 07762
|
1,108 sq. feet
|
2 baths 2 beds |
show details | |

|
#44
Shoreland Ter
Middletown, NJ 07748
|
2,052 sq. feet
|
3 baths 2 beds |
show details | |

|
#45
Highland Ave
Long Branch, NJ 07740
|
2,608 sq. feet
|
2 baths 5 beds |
show details | |

|
#46
Sunset Ave
Point Pleasant Beach, NJ 08742
|
1,040 sq. feet
|
1 baths 4 beds |
show details | |

|
#47
Mattapan Ave
Point Pleasant Beach, NJ 08742
|
2,675 sq. feet
|
3 baths 4 beds |
show details | |

|
#48
Hurley Pond Rd
Belmar, NJ 07719
|
2,070 sq. feet
|
2 baths 2 beds |
show details | |

|
#49
Timberline Rd
Toms River, NJ 08753
|
960 sq. feet
|
1 baths 3 beds |
show details | |

|
Check over 1 million property listings on Foreclosure.com!
|
browse all offers | |||


 | Get Excited, You're Going to Keansburg! (93 replies) |
| Ocean/Monmouth Counties: Best Places to Live (85 replies) |
| Neptune City? (10 replies) |
| Where is the good pizza in nj? (148 replies) |
| Relocating Neptune City (1 reply) |
| Ocean (Monmouth) Township Vs Brick Township? (14 replies) |

Median year apartment built: 1977
Household type by relationship:
Households: 4,626- Male householders: 1,190 (366 living alone), Female householders: 1,031 (452 living alone)
761 spouses (761 opposite-sex spouses), 163 unmarried partners, (163 opposite-sex unmarried partners), 979 children (916 natural, 0 adopted, 63 stepchildren), 6 grandchildren, 37 brothers or sisters, 118 parents, 52 foster children, 22 other relatives, 181 non-relatives
- In group quarters: 83
Size of family households: 766 2-persons, 244 3-persons, 203 4-persons, 24 5-persons, 14 6-persons, 22 7-or-more-persons.
Size of nonfamily households: 816 1-person, 173 2-persons.
346 married couples with children.
430 single-parent households (178 men, 252 women).
88.9% of residents of Neptune City speak English at home.
0.6% of residents speak Spanish at home (100% speak English very well).
11.1% of residents speak other Indo-European language at home (77% speak English very well, 23% speak English well).
0.5% of residents speak other language at home (100% speak English very well).
Foreign born population: 348 (7.5%)
(54.3% of them are naturalized citizens)
| Here: | 5.6 |
| State: | 6.8 |
| Here: | 3.6 |
| State: | 3.9 |

- Bedrooms in owner-occupied houses and condos in Neptune City, New Jersey
- 0no bedroom
- 161 bedroom
- 5522 bedrooms
- 5293 bedrooms
- 1304 bedrooms
- 905+ bedrooms

- Bedrooms in renter-occupied apartments in Neptune City, New Jersey
- 0no bedroom
- 7971 bedroom
- 1382 bedrooms
- 173 bedrooms
- 04 bedrooms
- 05+ bedrooms

- Cars and other vehicles available in Neptune City in owner-occupied houses/condos
- 17no vehicle
- 2941 vehicle
- 7292 vehicles
- 1953 vehicles
- 574 vehicles
- 255+ vehicles

- Cars and other vehicles available in Neptune City in renter-occupied apartments
- 69no vehicle
- 6241 vehicle
- 2212 vehicles
- 173 vehicles
- 214 vehicles
- 05+ vehicles

- Rooms in owner-occupied houses in Neptune City, New Jersey
- 01 room
- 02 rooms
- 433 rooms
- 2264 rooms
- 3465 rooms
- 3126 rooms
- 1667 rooms
- 1598 rooms
- 669+ rooms

- Rooms in renter-occupied apartments in Neptune City, New Jersey
- 01 room
- 1182 rooms
- 3363 rooms
- 4284 rooms
- 715 rooms
- 06 rooms
- 07 rooms
- 08 rooms
- 09+ rooms


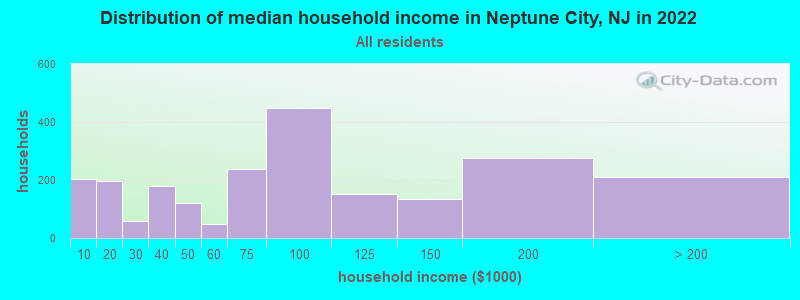
Neptune City, NJ household income distribution

- 204Less than $10,000
- 198$10,000 to $19,999
- 60$20,000 to $29,999
- 180$30,000 to $39,999
- 121$40,000 to $49,999
- 48$50,000 to $59,999
- 238$60,000 to $74,999
- 449$75,000 to $99,999
- 152$100,000 to $124,999
- 135$125,000 to $149,999
- 275$150,000 to $199,999
- 210$200,000 or more
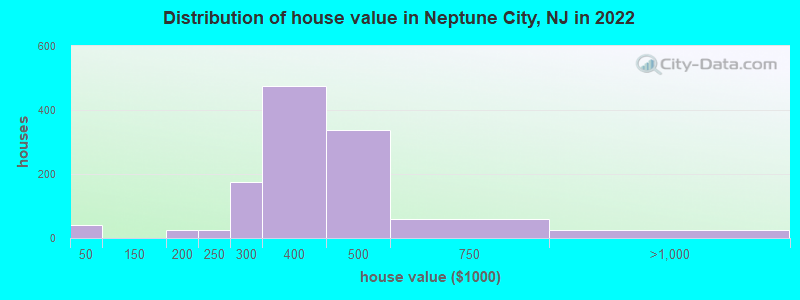
Home value of owner - occupied houses in 2022 in Neptune City, NJ
-
- 41Less than $10,000
- 23$175,000 to $199,999
- 24$200,000 to $249,999
- 175$250,000 to $299,999
- 475$300,000 to $399,999
- 337$400,000 to $499,999
- 59$500,000 to $749,999
- 24$750,000 to $999,999
Rent paid by renters in 2022 in Neptune City, NJ
-
- 96Less than $100
- 20$100 to $149
- 367$1,000 to $1,249
- 211$1,250 to $1,499
- 174$1,500 to $1,999
- 17$2,000 to $2,499


Percentage of workers working in this county: 75.8%
Number of people working at home: 208 (7.3% of all workers)
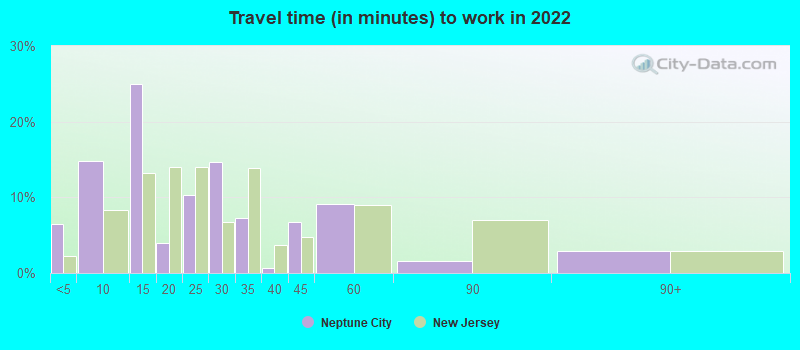
Travel time to work (commute)
- Less than 5 minutes: 120
- 5 to 9 minutes: 333
- 10 to 14 minutes: 619
- 15 to 19 minutes: 387
- 20 to 24 minutes: 191
- 25 to 29 minutes: 27
- 30 to 34 minutes: 189
- 35 to 39 minutes: 150
- 40 to 44 minutes: 33
- 45 to 59 minutes: 269
- 60 to 89 minutes: 148
- 90 or more minutes: 109
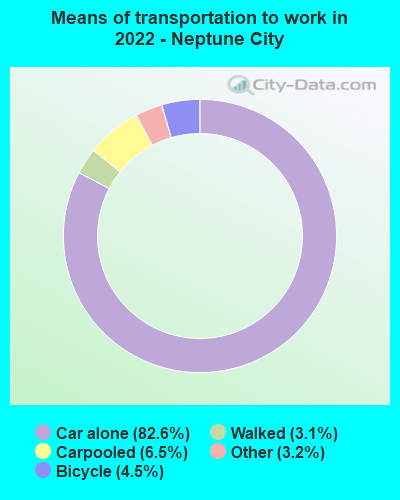
Means of transportation to work:
- Drove a car alone: 1,341 (68.1%)
- Carpooled: 126 (6.4%)
- Taxi: 80 (4.1%)
- Bicycle: 53 (2.7%)
- Walked: 76 (3.9%)
- Worked at home: 208 (10.6%)

- Unemployment by race in 2022
- Unemployment rate for White non-Hispanic residents
- 1.1%Females
- Unemployment rate for Black residents
- 21.0%Males
- 18.6%Females

- Year of entry for the foreign-born population in Neptune City, New Jersey
- 2482010 or later
- 02000 to 2009
- 01990 to 1999
- 481980 to 1989
- 521970 to 1979
- 95Before 1970

First ancestries reported:
- Irish: 580 (24.3%)
- American: 387 (16.2%)
- Italian: 299 (12.5%)
- Haitian: 231 (9.7%)
- Jamaican: 98 (4.1%)
- Guyanese: 94 (3.9%)
- Polish: 80 (3.4%)
- West Indian: 64 (2.7%)
- English: 40 (1.7%)
- European: 32 (1.3%)
- German: 23 (1.0%)
- Scotch-Irish: 11 (0.5%)
- Albanian: 5 (0.2%)
- Austrian: 3 (0.1%)
- Turkish: 3 (0.1%)
Most common places of birth for foreign-born residents (%):
| Neptune City: | 41.5% (144) |
| New Jersey: | 2.2% (47,365) |
| Neptune City: | 38.3% (133) |
| New Jersey: | 2.3% (49,491) |
| Neptune City: | 11.5% (40) |
| New Jersey: | 0.5% (10,886) |
Place of birth for U.S.-born residents:
- This state: 3,416
- Other state: 846
- Northeast: 349
- Midwest: 286
- South: 211
- West: 18
89.0% of Neptune City residents lived in the same house 1 years ago.
Out of people who lived in different houses, 46.1% lived in this county.
Out of people who lived in different counties, 32.3% lived in New Jersey.
| Neptune City: | 89.0% |
| State average: | 90.4% |
Education attainment for males 25 years and older:
- No schooling: 0
- Nursery to 4th grade: 0
- 5th and 6th grade: 0
- 7th and 8th grade: 0
- 9th grade: 10
- 10th grade: 4
- 11th grade: 0
- 12th grade, no diploma: 26
- High school graduate (or equivalency): 463
- Less than 1 year of college: 224
- Some college more than 1 year, no degree: 323
- Associate degree: 93
- Bachelor's degree: 237
- Master's degree: 180
- Professional school degree: 0
- Doctorate degree: 0

Education attainment for females 25 years and older:
- No schooling: 23
- Nursery to 4th grade: 0
- 5th and 6th grade: 0
- 7th and 8th grade: 0
- 9th grade: 0
- 10th grade: 18
- 11th grade: 0
- 12th grade, no diploma: 0
- High school graduate (or equivalency): 324
- Less than 1 year of college: 84
- Some college more than 1 year, no degree: 435
- Associate degree: 130
- Bachelor's degree: 499
- Master's degree: 218
- Professional school degree: 18
- Doctorate degree: 0


Housing units in structures:
- One, detached: 1,334
- One, attached: 120
- Two: 110
- 3 or 4: 98
- 5 to 9: 36
- 10 to 19: 25
- 20 to 49: 400
- 50 or more: 236
- Mobile homes: 38
House/condo owner moved in on average 11 years ago
Renter moved in on average 5 years ago

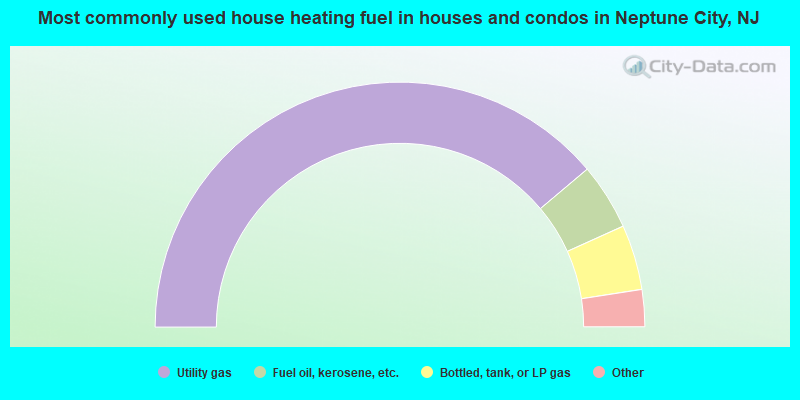
- 77.8%Utility gas
- 8.8%Fuel oil, kerosene, etc.
- 8.6%Bottled, tank, or LP gas
- 3.2%Electricity
- 1.6%Solar energy
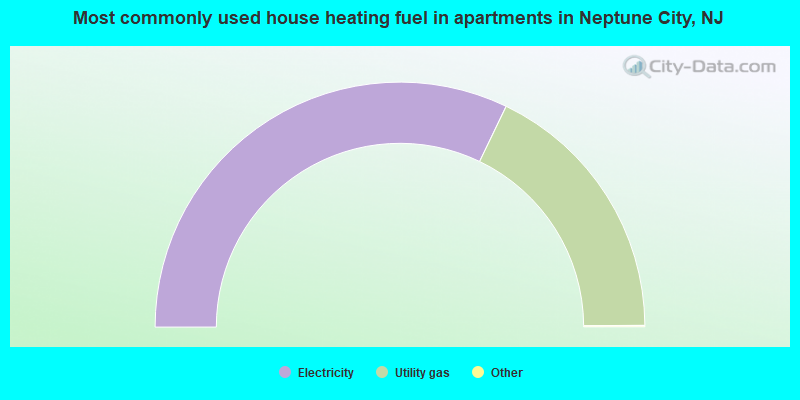
- 64.4%Electricity
- 35.6%Utility gas
Private vs. public school enrollment:
| Here: | 7.2% |
| New Jersey: | 12.3% |
| Here: | 0.0% |
| New Jersey: | 13.1% |
| Here: | 9.1% |
| New Jersey: | 33.2% |


