Nesquehoning, PA (Pennsylvania) Houses and Residents
| Nesquehoning: | $110,605 |
| Pennsylvania: | $245,500 |
Mean price in 2022:
Detached houses: $139,845
Here: $139,845 State: $317,202 Townhouses or other attached units: $126,777
Here: $126,777 State: $254,369
Total population: 3,279 (Urban population: 0, Rural population: 3,202 (all nonfarm))
Houses: 1,498 (1,188 occupied: 711 owner occupied, 529 renter occupied)
| % of renters here: | 43% |
| State: | 31% |
Housing density: 71 houses/condos per square mile
Median price asked for vacant for-sale houses and condos in 2022: $801,139.
Median contract rent in 2022: $790 (lower quartile is $559, upper quartile is $1,097)
Median rent asked for vacant for-rent units in 2022: $849
Median gross rent in Nesquehoning, PA in 2022: $856
Housing units in Nesquehoning with a mortgage: 396 (40 second mortgage, 0 home equity loan, 37 both second mortgage and home equity loan)
Houses without a mortgage: 27
Median household income for houses/condos with a mortgage: $75,997
Median household income for apartments without a mortgage: $56,302
Median monthly housing costs: $791
Compare current foreclosures near Nesquehoning, PA:
| Photo | Address | Area | Beds / Baths | Price | Details |
|---|---|---|---|---|---|

|
#1
W Catawissa St
Nesquehoning, PA 18240
|
1,276 sq. feet
|
1 baths 2 beds |
show details | |

|
#2
4th Ave
Nesquehoning, PA 18240
|
2,305 sq. feet
|
2 baths 4 beds |
show details | |

|
#3
W Catawissa St
Nesquehoning, PA 18240
|
- sq. feet
|
- baths - beds |
show details | |

|
#4
Carney Rd
Palmerton, PA 18071
|
1,842 sq. feet
|
1 baths 3 beds |
$367,500
|
show details |

|
#5
W Kline Ave
Lansford, PA 18232
|
998 sq. feet
|
1 baths 2 beds |
$104,500
|
show details |

|
#6
Hotel Ln
Barnesville, PA 18214
|
1,316 sq. feet
|
1 baths 3 beds |
$140,761
|
show details |

|
#7
Hazle St
Tamaqua, PA 18252
|
1,576 sq. feet
|
1 baths 3 beds |
$69,864
|
show details |

|
#8
Ash Cir
Andreas, PA 18211
|
988 sq. feet
|
1 baths 2 beds |
$24,215
|
show details |

|
#9
Orwigsburg St
Tamaqua, PA 18252
|
1,455 sq. feet
|
1 baths 3 beds |
$47,280
|
show details |

|
#10
Golf Rd
Barnesville, PA 18214
|
1,440 sq. feet
|
1 baths 2 beds |
$3,893
|
show details |
| Photo | Address | Area | Beds / Baths | Price | Details |
|---|---|---|---|---|---|

|
#11
1st St
Coaldale, PA 18218
|
1,519 sq. feet
|
1 baths 2 beds |
$3,066
|
show details |

|
#12
Market St
Tamaqua, PA 18252
|
1,265 sq. feet
|
1 baths 3 beds |
$63,376
|
show details |

|
#13
E Fell St
Summit Hill, PA 18250
|
1,024 sq. feet
|
1 baths 3 beds |
show details | |

|
#14
Saint Ann St
Barnesville, PA 18214
|
1,312 sq. feet
|
1 baths 3 beds |
show details | |

|
#15
Ginkgo Rd
Palmerton, PA 18071
|
1,276 sq. feet
|
2 baths 3 beds |
show details | |

|
#16
Washington St
Middleport, PA 17953
|
- sq. feet
|
1 baths 2 beds |
show details | |

|
#17
Horseshoe Ln
Lehighton, PA 18235
|
1,307 sq. feet
|
1 baths 3 beds |
show details | |

|
#18
Pohopoco Dr N
Kunkletown, PA 18058
|
2,706 sq. feet
|
2 baths 4 beds |
show details | |

|
#19
N James St
Kelayres, PA 18231
|
- sq. feet
|
1 baths 3 beds |
show details | |

|
#20
W 23rd St
Hazleton, PA 18202
|
- sq. feet
|
1 baths 3 beds |
show details |
| Photo | Address | Area | Beds / Baths | Price | Details |
|---|---|---|---|---|---|

|
#21
North St
Freeland, PA 18224
|
1,744 sq. feet
|
2 baths 3 beds |
show details | |

|
#22
Fig Way
Palmerton, PA 18071
|
2,018 sq. feet
|
2 baths 2 beds |
show details | |

|
#23
Lakeside Lane
Albrightsville, PA 18210
|
768 sq. feet
|
1 baths 2 beds |
show details | |

|
#24
Woodside Dr
Freeland, PA 18224
|
1,322 sq. feet
|
1 baths 3 beds |
show details | |

|
#25
Flint Hill Rd
New Tripoli, PA 18066
|
2,704 sq. feet
|
2 baths 4 beds |
show details | |

|
#26
Main St
Hazleton, PA 18201
|
1,194 sq. feet
|
1 baths 2 beds |
show details | |

|
#27
Woodhaven Dr
White Haven, PA 18661
|
- sq. feet
|
- baths - beds |
$29,900
|
show details |

|
#28
Forest Inn Rd
Palmerton, PA 18071
|
925 sq. feet
|
1 baths 2 beds |
show details | |

|
#29
Log Fence Rd
Palmerton, PA 18071
|
1,200 sq. feet
|
1 baths 3 beds |
show details | |

|
#30
Washington St
Walnutport, PA 18088
|
1,096 sq. feet
|
1 baths 3 beds |
show details |
| Photo | Address | Area | Beds / Baths | Price | Details |
|---|---|---|---|---|---|

|
#31
Hawk Rd
Lehighton, PA 18235
|
- sq. feet
|
2 baths 4 beds |
show details | |

|
#32
Brobst Hill Rd
New Tripoli, PA 18066
|
1,890 sq. feet
|
2 baths 4 beds |
show details | |

|
#33
Shingle Mill Dr
Drums, PA 18222
|
1,418 sq. feet
|
2 baths 3 beds |
show details | |

|
#34
Walnut St
White Haven, PA 18661
|
1,175 sq. feet
|
1 baths 2 beds |
show details | |

|
#35
Pa Route 873
Slatington, PA 18080
|
1,758 sq. feet
|
2 baths 4 beds |
show details | |

|
#36
Buck Ridge Dr
Drums, PA 18222
|
1,418 sq. feet
|
2 baths 3 beds |
show details | |

|
#37
Cedar Dr
Walnutport, PA 18088
|
1,652 sq. feet
|
1 baths 3 beds |
show details | |

|
#38
E Ludlow St
Summit Hill, PA 18250
|
1,184 sq. feet
|
1 baths 3 beds |
show details | |

|
#39
E Phillips St
Coaldale, PA 18218
|
1,281 sq. feet
|
1 baths 2 beds |
show details | |

|
#40
Lauderburn Ave
Weatherly, PA 18255
|
1,652 sq. feet
|
1 baths 3 beds |
show details |
| Photo | Address | Area | Beds / Baths | Price | Details |
|---|---|---|---|---|---|

|
#41
North St
Jim Thorpe, PA 18229
|
1,138 sq. feet
|
2 baths 4 beds |
show details | |

|
#42
S 9th St
Lehighton, PA 18235
|
1,456 sq. feet
|
1 baths 3 beds |
show details | |

|
#43
Walnut Street
Delano, PA 18220
|
- sq. feet
|
- baths - beds |
$58,737
|
show details |

|
#44
Center Ave
Jim Thorpe, PA 18229
|
1,750 sq. feet
|
2 baths 4 beds |
show details | |

|
#45
Lincoln Ct
New Tripoli, PA 18066
|
1,440 sq. feet
|
2 baths 3 beds |
show details | |

|
#46
2nd St
Slatington, PA 18080
|
1,340 sq. feet
|
1 baths 3 beds |
show details | |

|
#47
E Church St
Slatington, PA 18080
|
1,188 sq. feet
|
1 baths 3 beds |
show details | |

|
#48
Memorial Rd
Germansville, PA 18053
|
1,680 sq. feet
|
1 baths 3 beds |
show details | |

|
#49
7th St
Slatington, PA 18080
|
1,792 sq. feet
|
1 baths 3 beds |
show details | |

|
Check over 1 million property listings on Foreclosure.com!
|
browse all offers | |||

Latest news about housing in Nesquehoning, PA collected exclusively by city-data.com from local newspapers, TV, and radio stations

 | NEED HOUSE PAINTER - Carbon County (0 replies) |
| Northampton for family? (12 replies) |
| Lansford,Pa (3 replies) |
| Lansford area (2 replies) |

Median year apartment built: 1925
Household type by relationship:
Households: 3,363- Male householders: 612 (174 living alone), Female householders: 578 (134 living alone)
461 spouses (461 opposite-sex spouses), 223 unmarried partners, (223 opposite-sex unmarried partners), 885 children (817 natural, 8 adopted, 60 stepchildren), 150 grandchildren, 21 brothers or sisters, 98 parents, 0 foster children, 19 other relatives, 89 non-relatives
- In group quarters: 223
Size of family households: 293 2-persons, 305 3-persons, 29 4-persons, 213 5-persons, 14 7-or-more-persons.
Size of nonfamily households: 294 1-person, 99 2-persons, 50 5-persons.
408 married couples with children.
185 single-parent households (107 men, 78 women).
96.2% of residents of Nesquehoning speak English at home.
2.5% of residents speak Spanish at home (100% speak English very well).
0.2% of residents speak other Indo-European language at home (100% speak English very well).
0.5% of residents speak Asian or Pacific Island language at home (100% speak English well).
Foreign born population: 43 (1.3%)
(88.4% of them are naturalized citizens)
| Here: | 7.0 |
| State: | 6.8 |
| Here: | 5.0 |
| State: | 4.3 |

- Bedrooms in owner-occupied houses and condos in Nesquehoning, Pennsylvania
- 13no bedroom
- 01 bedroom
- 2532 bedrooms
- 3303 bedrooms
- 1054 bedrooms
- 105+ bedrooms

- Bedrooms in renter-occupied apartments in Nesquehoning, Pennsylvania
- 69no bedroom
- 391 bedroom
- 1872 bedrooms
- 2143 bedrooms
- 04 bedrooms
- 215+ bedrooms

- Cars and other vehicles available in Nesquehoning in owner-occupied houses/condos
- 73no vehicle
- 2181 vehicle
- 2722 vehicles
- 1163 vehicles
- 104 vehicles
- 215+ vehicles

- Cars and other vehicles available in Nesquehoning in renter-occupied apartments
- 57no vehicle
- 2091 vehicle
- 1632 vehicles
- 1023 vehicles
- 04 vehicles
- 05+ vehicles

- Rooms in owner-occupied houses in Nesquehoning, Pennsylvania
- 131 room
- 02 rooms
- 73 rooms
- 244 rooms
- 915 rooms
- 1286 rooms
- 1967 rooms
- 1838 rooms
- 699+ rooms

- Rooms in renter-occupied apartments in Nesquehoning, Pennsylvania
- 551 room
- 242 rooms
- 293 rooms
- 1454 rooms
- 815 rooms
- 1516 rooms
- 177 rooms
- 218 rooms
- 79+ rooms


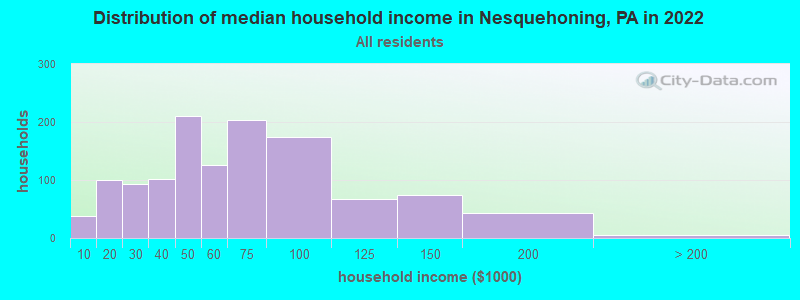
Nesquehoning, PA household income distribution

- 38Less than $10,000
- 100$10,000 to $19,999
- 93$20,000 to $29,999
- 102$30,000 to $39,999
- 211$40,000 to $49,999
- 126$50,000 to $59,999
- 203$60,000 to $74,999
- 175$75,000 to $99,999
- 67$100,000 to $124,999
- 74$125,000 to $149,999
- 43$150,000 to $199,999
- 6$200,000 or more
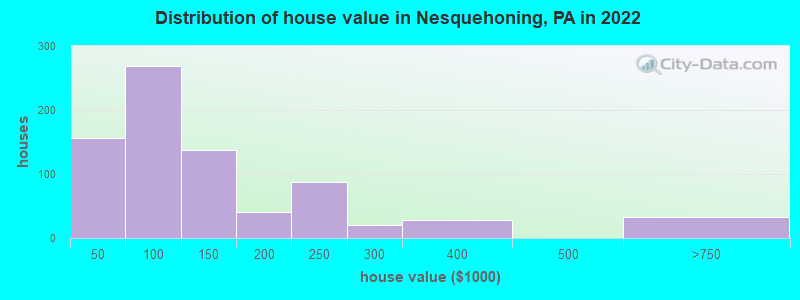
Home value of owner - occupied houses in 2022 in Nesquehoning, PA
-
- 7$25,000 to $29,999
- 85$30,000 to $34,999
- 8$35,000 to $39,999
- 54$40,000 to $49,999
- 51$50,000 to $59,999
- 54$60,000 to $69,999
- 56$70,000 to $79,999
- 33$80,000 to $89,999
- 16$90,000 to $99,999
- 51$100,000 to $124,999
- 85$125,000 to $149,999
- 10$150,000 to $174,999
- 30$175,000 to $199,999
- 88$200,000 to $249,999
- 19$250,000 to $299,999
- 27$300,000 to $399,999
- 33$500,000 to $749,999
Rent paid by renters in 2022 in Nesquehoning, PA
-
- 5$250 to $299
- 15$300 to $349
- 12$350 to $399
- 64$400 to $449
- 116$500 to $549
- 20$700 to $749
- 50$750 to $799
- 39$800 to $899
- 37$900 to $999
- 142$1,000 to $1,249
- 18$1,500 to $1,999
- 6No cash rent


Percentage of workers working in this county: 41.1%
Number of people working at home: 0 (0.0% of all workers)
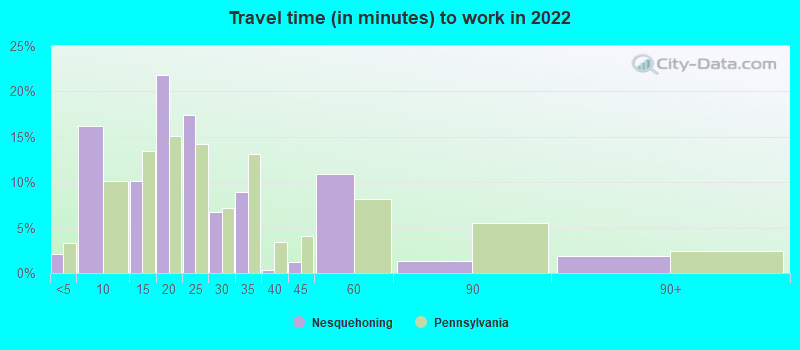
Travel time to work (commute)
- Less than 5 minutes: 33
- 5 to 9 minutes: 56
- 10 to 14 minutes: 53
- 15 to 19 minutes: 116
- 20 to 24 minutes: 237
- 25 to 29 minutes: 67
- 30 to 34 minutes: 157
- 35 to 39 minutes: 0
- 40 to 44 minutes: 0
- 45 to 59 minutes: 154
- 60 to 89 minutes: 101
- 90 or more minutes: 41
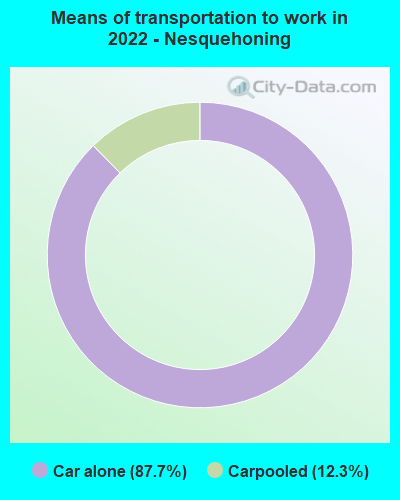
Means of transportation to work:
- Drove a car alone: 970 (84.8%)
- Carpooled: 135 (11.8%)

- Unemployment by race in 2022
- Unemployment rate for White non-Hispanic residents
- 23.2%Males
- 17.1%Females

- Year of entry for the foreign-born population in Nesquehoning, Pennsylvania
- 02010 or later
- 262000 to 2009
- 141990 to 1999
- 61980 to 1989
- 01970 to 1979
- 33Before 1970

First ancestries reported:
- German: 450 (31.0%)
- Italian: 195 (13.4%)
- Pennsylvania German: 117 (8.1%)
- Ukrainian: 90 (6.2%)
- American: 57 (3.9%)
- English: 46 (3.2%)
- Irish: 45 (3.1%)
- Dutch: 34 (2.3%)
- Slovak: 34 (2.3%)
- Russian: 23 (1.6%)
- Polish: 21 (1.4%)
- Welsh: 21 (1.4%)
- Slavic: 20 (1.4%)
- Greek: 12 (0.8%)
- Hungarian: 12 (0.8%)
- Carpatho Rusyn: 10 (0.7%)
Most common places of birth for foreign-born residents (%):
| Nesquehoning: | 61.9% (26) |
| Pennsylvania: | 1.8% (17,032) |
| Nesquehoning: | 38.1% (16) |
| Pennsylvania: | 0.0% (291) |
Place of birth for U.S.-born residents:
- This state: 2,874
- Other state: 436
- Northeast: 233
- Midwest: 21
- South: 174
- West: 3
80.2% of Nesquehoning residents lived in the same house 1 years ago.
Out of people who lived in different houses, 39.7% lived in this county.
Out of people who lived in different counties, 64.6% lived in Pennsylvania.
| Nesquehoning: | 80.2% |
| State average: | 89.3% |
Education attainment for males 25 years and older:
- No schooling: 0
- Nursery to 4th grade: 0
- 5th and 6th grade: 1
- 7th and 8th grade: 12
- 9th grade: 9
- 10th grade: 44
- 11th grade: 18
- 12th grade, no diploma: 10
- High school graduate (or equivalency): 601
- Less than 1 year of college: 23
- Some college more than 1 year, no degree: 230
- Associate degree: 121
- Bachelor's degree: 207
- Master's degree: 9
- Professional school degree: 0
- Doctorate degree: 0

Education attainment for females 25 years and older:
- No schooling: 0
- Nursery to 4th grade: 0
- 5th and 6th grade: 0
- 7th and 8th grade: 0
- 9th grade: 0
- 10th grade: 17
- 11th grade: 101
- 12th grade, no diploma: 50
- High school graduate (or equivalency): 570
- Less than 1 year of college: 39
- Some college more than 1 year, no degree: 69
- Associate degree: 108
- Bachelor's degree: 117
- Master's degree: 60
- Professional school degree: 0
- Doctorate degree: 0


Housing units in structures:
- One, detached: 715
- One, attached: 487
- Two: 152
- 5 to 9: 63
- 10 to 19: 12
- 20 to 49: 14
- 50 or more: 54
Housing units lacking complete kitchen facilities in 2022: 9.9%
House/condo owner moved in on average 25 years ago
Renter moved in on average -1 years ago

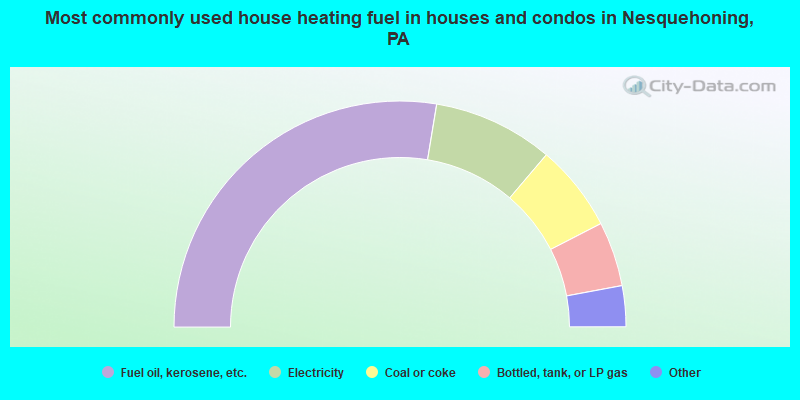
- 55.5%Fuel oil, kerosene, etc.
- 17.3%Electricity
- 12.5%Coal or coke
- 9.3%Bottled, tank, or LP gas
- 3.8%Utility gas
- 1.6%Solar energy
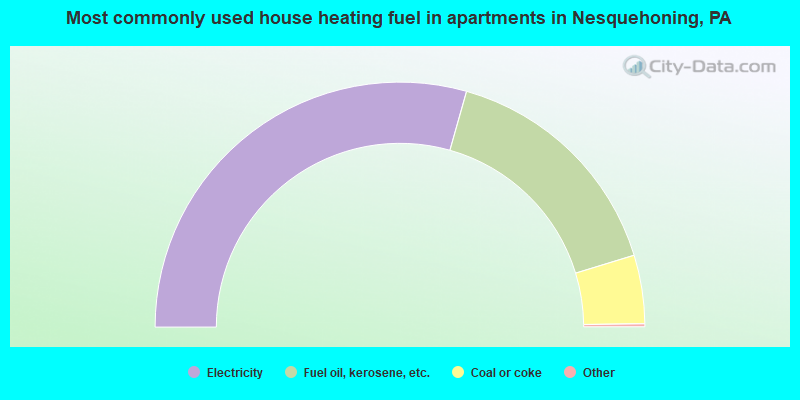
- 59.0%Electricity
- 31.9%Fuel oil, kerosene, etc.
- 9.1%Coal or coke
Private vs. public school enrollment:
| Here: | 18.1% |
| Pennsylvania: | 15.7% |
| Here: | 12.1% |
| Pennsylvania: | 13.4% |
| Here: | 0.0% |
| Pennsylvania: | 39.8% |


