New Ashford, MA (Massachusetts) Houses and Residents
| New Ashford: | $423,860 |
| Massachusetts: | $534,700 |
Total population: 228 (Urban population: 0, Rural population: 232 (all nonfarm))
Houses: 105 (90 occupied: 67 owner occupied, 23 renter occupied)
| % of renters here: | 26% |
| State: | 38% |
Housing density: 8 houses/condos per square mile
Median price asked for vacant for-sale houses and condos in 2022 in this county: $708,441.
Median contract rent in 2022: $1,000 (lower quartile is $701, upper quartile is $1,165)
Median rent asked for vacant for-rent units in 2022: $1,011
Median gross rent in New Ashford, MA in 2022: $1,051
Housing units in New Ashford with a mortgage: 30 (0 second mortgage, 1 home equity loan, 0 both second mortgage and home equity loan)
Houses without a mortgage: 13
Compare current foreclosures near New Ashford, MA:
| Photo | Address | Area | Beds / Baths | Price | Details |
|---|---|---|---|---|---|

|
#1
Elmwood Ave
North Adams, MA 01247
|
2,777 sq. feet
|
3 baths 5 beds |
$215,000
|
show details |

|
#2
North St
Pittsfield, MA 01201
|
1,661 sq. feet
|
2 baths 4 beds |
show details | |

|
#3
North St
North Adams, MA 01247
|
1,164 sq. feet
|
1 baths 3 beds |
show details | |

|
#4
Circular Ave
Pittsfield, MA 01201
|
2,808 sq. feet
|
4 baths 8 beds |
show details | |

|
#5
Robbins Ave
Pittsfield, MA 01201
|
1,872 sq. feet
|
2 baths 4 beds |
show details | |

|
#6
Daniels Ave
Pittsfield, MA 01201
|
3,040 sq. feet
|
3 baths 6 beds |
show details | |

|
#7
Madison Ave
Pittsfield, MA 01201
|
2,192 sq. feet
|
2 baths 6 beds |
show details | |

|
#8
Arnold Ct
Cheshire, MA 01225
|
1,600 sq. feet
|
2 baths 2 beds |
show details | |

|
#9
Franklin St
North Adams, MA 01247
|
1,386 sq. feet
|
1 baths 3 beds |
show details | |

|
#10
Dunham Hollow Rd
East Nassau, NY 12062
|
1,640 sq. feet
|
2 baths 4 beds |
show details |
| Photo | Address | Area | Beds / Baths | Price | Details |
|---|---|---|---|---|---|

|
#11
Wilshire Dr
Cheshire, MA 01225
|
4,302 sq. feet
|
2 baths 3 beds |
show details | |

|
#12
Weller Ave
Pittsfield, MA 01201
|
3,376 sq. feet
|
3 baths 6 beds |
show details | |

|
#13
Grove St
Adams, MA 01220
|
2,644 sq. feet
|
2 baths 7 beds |
show details | |

|
#14
Elberon Ave
Pittsfield, MA 01201
|
1,794 sq. feet
|
1 baths 4 beds |
show details | |

|
#15
West St
Pittsfield, MA 01201
|
1,714 sq. feet
|
1 baths 4 beds |
show details | |

|
#16
Summit Ave
Pittsfield, MA 01201
|
1,664 sq. feet
|
2 baths 4 beds |
show details | |

|
#17
W Mountain Rd
Adams, MA 01220
|
1,173 sq. feet
|
1 baths 3 beds |
show details | |

|
#18
Mcarthur St
Pittsfield, MA 01201
|
1,155 sq. feet
|
1 baths 2 beds |
show details | |

|
#19
Phelps Rd
North Adams, MA 01247
|
1,286 sq. feet
|
1 baths 4 beds |
show details | |

|
#20
Imperial Ave
Pittsfield, MA 01201
|
1,326 sq. feet
|
1 baths 3 beds |
show details |
| Photo | Address | Area | Beds / Baths | Price | Details |
|---|---|---|---|---|---|

|
#21
Garfield Ave
Pittsfield, MA 01201
|
2,432 sq. feet
|
2 baths 4 beds |
show details | |

|
#22
Daniels Ave
Pittsfield, MA 01201
|
1,172 sq. feet
|
1 baths 3 beds |
show details | |

|
#23
West St
Pittsfield, MA 01201
|
2,018 sq. feet
|
1 baths 3 beds |
show details | |

|
#24
Longfellow Ave
Pittsfield, MA 01201
|
1,356 sq. feet
|
1 baths 4 beds |
show details | |

|
#25
Donovan St
Pittsfield, MA 01201
|
1,652 sq. feet
|
2 baths 3 beds |
show details | |

|
#26
Legate Hill Rd
Charlemont, MA 01339
|
2,016 sq. feet
|
2 baths 3 beds |
show details | |

|
#27
David Dr
Hinsdale, MA 01235
|
1,664 sq. feet
|
2 baths 3 beds |
show details | |

|
#28
Cranberry Pond Rd
Cropseyville, NY 12052
|
1,152 sq. feet
|
1 baths 2 beds |
show details | |

|
#29
Jennifer St
Lenox, MA 01240
|
1,416 sq. feet
|
1 baths 3 beds |
show details | |

|
#30
Varville Rd
Petersburg, NY 12138
|
1,232 sq. feet
|
1 baths 3 beds |
show details |
| Photo | Address | Area | Beds / Baths | Price | Details |
|---|---|---|---|---|---|

|
#31
Joseph Dr
Pittsfield, MA 01201
|
1,248 sq. feet
|
1 baths 3 beds |
show details | |

|
#32
Anita Dr
Pittsfield, MA 01201
|
1,504 sq. feet
|
2 baths 3 beds |
show details | |

|
#33
E Shore Dr
Petersburg, NY 12138
|
1,000 sq. feet
|
1 baths 6 beds |
show details | |

|
#34
Fox Way
Petersburg, NY 12138
|
1,734 sq. feet
|
1 baths 1 beds |
show details | |

|
#35
Loop Rd
Savoy, MA 01256
|
1,040 sq. feet
|
1 baths 3 beds |
show details | |

|
#36
Rte 9
Windsor, MA 01270
|
1,223 sq. feet
|
1 baths 2 beds |
show details | |

|
#37
Marshall Ave
Pittsfield, MA 01201
|
1,517 sq. feet
|
1 baths 3 beds |
show details | |

|
#38
Williams St
Pittsfield, MA 01201
|
1,245 sq. feet
|
1 baths 3 beds |
show details | |

|
#39
Hill Hollow Rd
Petersburg, NY 12138
|
980 sq. feet
|
1 baths 1 beds |
show details | |

|
#40
Church Rd
Drury, MA 01343
|
2,560 sq. feet
|
2 baths 4 beds |
show details |
| Photo | Address | Area | Beds / Baths | Price | Details |
|---|---|---|---|---|---|

|
#41
Kathy Way
Pittsfield, MA 01201
|
2,136 sq. feet
|
2 baths 3 beds |
show details | |

|
#42
Lenox Ave
Pittsfield, MA 01201
|
1,376 sq. feet
|
1 baths 3 beds |
show details | |

|
#43
Briggs Ave
Pittsfield, MA 01201
|
2,116 sq. feet
|
2 baths 4 beds |
show details | |

|
#44
Crystal St
Pittsfield, MA 01201
|
1,282 sq. feet
|
1 baths 3 beds |
show details | |

|
#45
Lenox Ave
Pittsfield, MA 01201
|
2,290 sq. feet
|
2 baths 6 beds |
show details | |

|
#46
North St
North Adams, MA 01247
|
1,164 sq. feet
|
1 baths 3 beds |
show details | |

|
#47
Valley St
Adams, MA 01220
|
1,680 sq. feet
|
2 baths 4 beds |
show details | |

|
#48
Daniels Ct
Adams, MA 01220
|
1,400 sq. feet
|
1 baths 3 beds |
show details | |

|
#49
Weber St # 12
Adams, MA 01220
|
1,728 sq. feet
|
2 baths 4 beds |
show details | |

|
Check over 1 million property listings on Foreclosure.com!
|
browse all offers | |||

 | How Much Massachusetts Households Make Per Year: Census Data (37 replies) |
| affordable retirement communities in mass, so. nh???? (20 replies) |

Household type by relationship:
Households: 125,060- In family households: 97,905 (22,577 male householders, 11,041 female householders)
24,607 spouses, 32,029 children (29,913 natural, 899 adopted, 1,217 stepchildren), 1,640 grandchildren, 800 brothers or sisters, 888 parents, foster children, 744 other relatives, 3,122 non-relatives
- In nonfamily households: 27,155 (10,008 male householders (7,904 living alone)), 12,465 female householders (10,630 living alone)), 4,682 nonrelatives
- In group quarters: 6,159 (2,280 institutionalized population)
19,886 married couples with children.
7,840 single-parent households (1,582 men, 6,258 women).
93.2% of residents of New Ashford speak English at home.
2.7% of residents speak Spanish at home (100% speak English very well).
4.1% of residents speak other Indo-European language at home (100% speak English very well).
Foreign born population: 13 (5.9%)
(61.5% of them are naturalized citizens)
| Here: | 6.5 |
| State: | 6.5 |
| Here: | 4.2 |
| State: | 4.0 |

- Bedrooms in owner-occupied houses and condos in New Ashford, Massachusetts
- 0no bedroom
- 11 bedroom
- 152 bedrooms
- 323 bedrooms
- 134 bedrooms
- 65+ bedrooms

- Bedrooms in renter-occupied apartments in New Ashford, Massachusetts
- 0no bedroom
- 41 bedroom
- 132 bedrooms
- 43 bedrooms
- 24 bedrooms
- 05+ bedrooms

- Cars and other vehicles available in New Ashford in owner-occupied houses/condos
- 3no vehicle
- 61 vehicle
- 402 vehicles
- 93 vehicles
- 54 vehicles
- 45+ vehicles

- Cars and other vehicles available in New Ashford in renter-occupied apartments
- 2no vehicle
- 81 vehicle
- 112 vehicles
- 23 vehicles
- 04 vehicles
- 05+ vehicles

- Rooms in owner-occupied houses in New Ashford, Massachusetts
- 01 room
- 02 rooms
- 13 rooms
- 04 rooms
- 135 rooms
- 236 rooms
- 117 rooms
- 108 rooms
- 99+ rooms

- Rooms in renter-occupied apartments in New Ashford, Massachusetts
- 01 room
- 02 rooms
- 33 rooms
- 84 rooms
- 85 rooms
- 26 rooms
- 07 rooms
- 28 rooms
- 09+ rooms


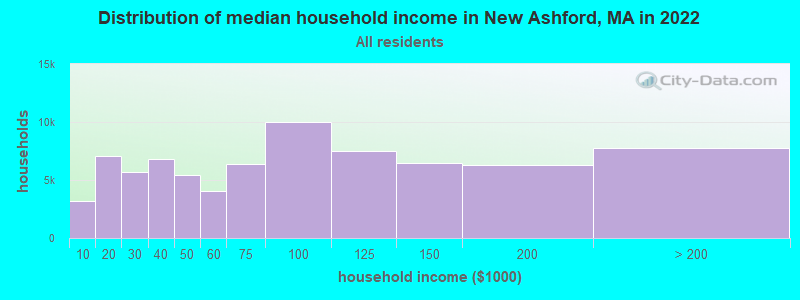
New Ashford, MA household income distribution

- 3,159Less than $10,000
- 7,036$10,000 to $19,999
- 5,715$20,000 to $29,999
- 6,812$30,000 to $39,999
- 5,466$40,000 to $49,999
- 4,010$50,000 to $59,999
- 6,368$60,000 to $74,999
- 10,005$75,000 to $99,999
- 7,530$100,000 to $124,999
- 6,486$125,000 to $149,999
- 6,291$150,000 to $199,999
- 7,733$200,000 or more
Percentage of workers working in this county: 89.7%
Number of people working at home: 28 (18.1% of all workers)
Travel time to work (commute)
- Less than 5 minutes: 11
- 5 to 9 minutes: 16
- 10 to 14 minutes: 12
- 15 to 19 minutes: 32
- 20 to 24 minutes: 18
- 25 to 29 minutes: 21
- 30 to 34 minutes: 8
- 35 to 39 minutes: 5
- 40 to 44 minutes: 3
- 45 to 59 minutes: 4
- 60 to 89 minutes: 4
- 90 or more minutes: 0
Means of transportation to work:
- Drove a car alone: 117 (84.8%)
- Carpooled: 15 (10.9%)
- Walked: 2 (1.4%)
- Worked at home: 4 (2.9%)


- Year of entry for the foreign-born population in New Ashford, Massachusetts
- 01995 to March 2000
- 31990 to 1994
- 01985 to 1989
- 01980 to 1984
- 01975 to 1979
- 01970 to 1974
- 21965 to 1969
- 3Before 1965

First ancestries reported:
- Irish: 59 (18.6%)
- English: 54 (17.0%)
- Other: 39 (12.3%)
- French: 35 (11.0%)
- German: 33 (10.4%)
- Italian: 30 (9.5%)
- Scottish: 19 (6.0%)
- French Canadian: 15 (4.7%)
- Polish: 9 (2.8%)
- Arab: 8 (2.5%)
- Dutch: 7 (2.2%)
- Subsaharan African: 5 (1.6%)
- Swedish: 2 (0.6%)
- Greek: 1 (0.3%)
- United States: 1 (0.3%)
Most common places of birth for foreign-born residents (%):
| New Ashford: | 37.5% (3) |
| Massachusetts: | 3.3% (25,403) |
| New Ashford: | 37.5% (3) |
| Massachusetts: | 0.5% (3,660) |
| New Ashford: | 25.0% (2) |
| Massachusetts: | 1.1% (8,682) |
Place of birth for U.S.-born residents:
- This state: 152
- Other state: 71
- Northeast: 44
- Midwest: 13
- South: 12
- West: 2
59% of New Ashford residents lived in the same house 5 years ago.
Out of people who lived in different houses, 67% lived in this county.
Out of people who lived in different counties, 0% lived in Massachusetts.
Education attainment for males 25 years and older:
- No schooling: 0
- Nursery to 4th grade: 0
- 5th and 6th grade: 0
- 7th and 8th grade: 2
- 9th grade: 0
- 10th grade: 2
- 11th grade: 1
- 12th grade, no diploma: 5
- High school graduate (or equivalency): 10
- Less than 1 year of college: 3
- Some college more than 1 year, no degree: 11
- Associate degree: 9
- Bachelor's degree: 25
- Master's degree: 6
- Professional school degree: 0
- Doctorate degree: 0

Education attainment for females 25 years and older:
- No schooling: 0
- Nursery to 4th grade: 0
- 5th and 6th grade: 0
- 7th and 8th grade: 0
- 9th grade: 0
- 10th grade: 0
- 11th grade: 0
- 12th grade, no diploma: 5
- High school graduate (or equivalency): 28
- Less than 1 year of college: 4
- Some college more than 1 year, no degree: 10
- Associate degree: 9
- Bachelor's degree: 26
- Master's degree: 13
- Professional school degree: 0
- Doctorate degree: 0


Housing units in structures:
- One, detached: 80
- One, attached: 6
- Two: 11
- 3 or 4: 4
- Mobile homes: 4
Median worth of mobile homes: $63,737

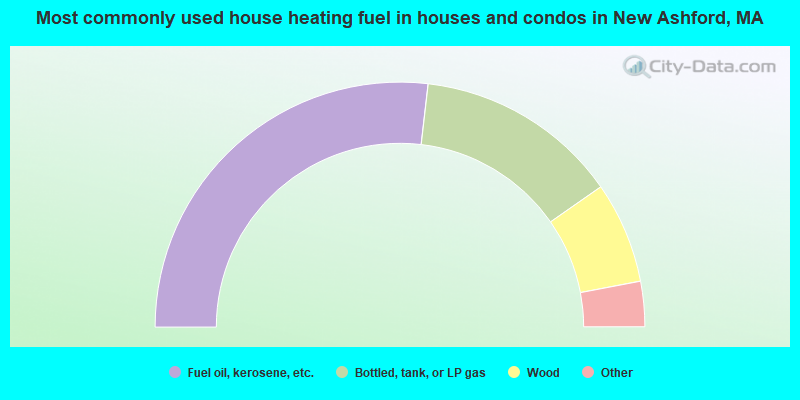
- 53.7%Fuel oil, kerosene, etc.
- 26.9%Bottled, tank, or LP gas
- 13.4%Wood
- 3.0%Electricity
- 3.0%Other fuel
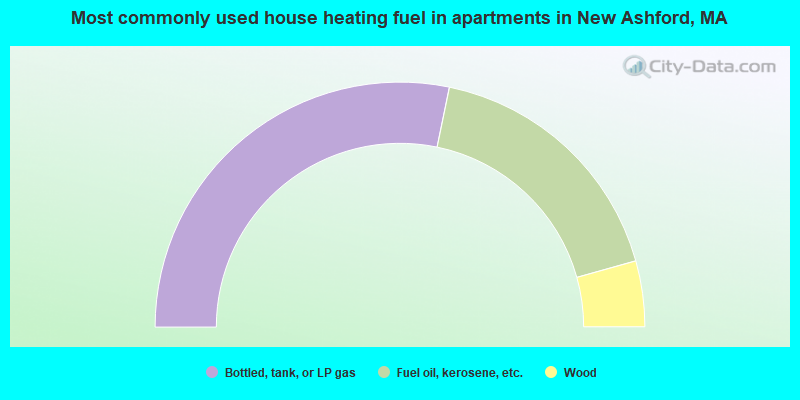
- 56.5%Bottled, tank, or LP gas
- 34.8%Fuel oil, kerosene, etc.
- 8.7%Wood
Private vs. public school enrollment:
| Here: | 8.0% |
| Massachusetts: | 10.8% |
| Here: | 13.3% |
| Massachusetts: | 12.2% |


