New Baltimore, PA (Pennsylvania) Houses and Residents
| New Baltimore: | $89,772 |
| Pennsylvania: | $245,500 |
Total population: 176 (Urban population: 0, Rural population: 192 (all nonfarm))
Houses: 77 (70 occupied: 56 owner occupied, 14 renter occupied)
| % of renters here: | 20% |
| State: | 31% |
Housing density: 244 houses/condos per square mile
Median price asked for vacant for-sale houses and condos in 2022 in this county: $160,718.
Median contract rent in 2022: $504 (lower quartile is $352, upper quartile is $669)
Median gross rent in New Baltimore, PA in 2022: $797
Housing units in New Baltimore with a mortgage: 26 (0 second mortgage, 0 home equity loan, 0 both second mortgage and home equity loan)
Houses without a mortgage: 0
Median household income for houses/condos with a mortgage: $95,457
Median household income for apartments without a mortgage: $60,570
Median monthly housing costs: $606
Compare current foreclosures near New Baltimore, PA:
| Photo | Address | Area | Beds / Baths | Price | Details |
|---|---|---|---|---|---|

|
#1
Juniata St
New Baltimore, PA 15553
|
- sq. feet
|
- baths - beds |
show details | |

|
#2
Bunker Hill Rd
Central City, PA 15926
|
1,769 sq. feet
|
1 baths 3 beds |
$17,900
|
show details |

|
#3
Buck Falls Rd
Bedford, PA 15522
|
- sq. feet
|
1 baths 2 beds |
show details | |

|
#4
S East St
Bedford, PA 15522
|
- sq. feet
|
2 baths 5 beds |
show details | |

|
#5
Indian Eve Rd
New Paris, PA 15554
|
1,300 sq. feet
|
2 baths 3 beds |
show details | |

|
#6
Lincoln Hwy
Schellsburg, PA 15559
|
1,244 sq. feet
|
1 baths 2 beds |
show details | |

|
#7
Village Rd
Friedens, PA 15541
|
1,246 sq. feet
|
1 baths 3 beds |
show details | |

|
#8
Schellsburg St
Hyndman, PA 15545
|
2,032 sq. feet
|
2 baths 4 beds |
show details | |

|
#9
Hayes St
Windber, PA 15963
|
1,191 sq. feet
|
1 baths 2 beds |
show details | |

|
#10
Ridge Rd
Somerset, PA 15501
|
1,092 sq. feet
|
1 baths 3 beds |
show details |
| Photo | Address | Area | Beds / Baths | Price | Details |
|---|---|---|---|---|---|

|
#11
E Main St
Somerset, PA 15501
|
2,170 sq. feet
|
1 baths 4 beds |
show details | |

|
#12
Big Rock Rd
Berlin, PA 15530
|
1,300 sq. feet
|
1 baths 3 beds |
show details | |

|
#13
Village Rd
Friedens, PA 15541
|
1,246 sq. feet
|
1 baths 3 beds |
show details | |

|
#14
Dannys Ln
Fairhope, PA 15538
|
1,352 sq. feet
|
1 baths 3 beds |
show details | |

|
#15
2nd Ave
Hyndman, PA 15545
|
- sq. feet
|
2 baths 4 beds |
show details | |

|
#16
Wilbur Rd
Stoystown, PA 15563
|
1,792 sq. feet
|
1 baths 4 beds |
show details | |

|
#17
Stoystown Rd
Friedens, PA 15541
|
2,093 sq. feet
|
2 baths 3 beds |
show details | |

|
#18
Horner St
Windber, PA 15963
|
1,344 sq. feet
|
1 baths 3 beds |
show details | |

|
#19
Bunker Hill Rd
Central City, PA 15926
|
1,296 sq. feet
|
2 baths 3 beds |
show details | |

|
#20
Main St
Berlin, PA 15530
|
1,344 sq. feet
|
2 baths 3 beds |
show details |
| Photo | Address | Area | Beds / Baths | Price | Details |
|---|---|---|---|---|---|

|
#21
Whispering Pines Rd
Cairnbrook, PA 15924
|
1,547 sq. feet
|
1 baths 4 beds |
show details | |

|
#22
Lambertsville Rd
Stoystown, PA 15563
|
1,728 sq. feet
|
1 baths 4 beds |
show details | |

|
#23
N Edgewood Ave
Somerset, PA 15501
|
2,374 sq. feet
|
- baths 4 beds |
show details | |

|
#24
High St
Somerset, PA 15501
|
2,987 sq. feet
|
- baths 3 beds |
show details | |

|
#25
Walnut St
Central City, PA 15926
|
1,662 sq. feet
|
- baths 2 beds |
show details | |

|
#26
N Center Ave
Somerset, PA 15501
|
- sq. feet
|
- baths - beds |
show details | |

|
#27
W Fairfield Street
Somerset, PA 15501
|
- sq. feet
|
- baths - beds |
show details | |

|
#28
Mountain View Dr
Schellsburg, PA 15559
|
1,476 sq. feet
|
- baths - beds |
show details | |

|
#29
S Richard St
Bedford, PA 15522
|
1,393 sq. feet
|
- baths - beds |
show details | |

|
#30
Siemon Dr
Somerset, PA 15501
|
- sq. feet
|
- baths - beds |
show details |
| Photo | Address | Area | Beds / Baths | Price | Details |
|---|---|---|---|---|---|

|
#31
Water Level Rd
Somerset, PA 15501
|
- sq. feet
|
- baths - beds |
show details | |

|
#32
Martha St
Somerset, PA 15501
|
- sq. feet
|
- baths - beds |
show details | |

|
#33
Highland Park Dr
Somerset, PA 15501
|
- sq. feet
|
- baths - beds |
show details | |

|
#34
Hill Top Hts
Bedford, PA 15522
|
1,458 sq. feet
|
- baths - beds |
show details | |

|
#35
Lynn St
Central City, PA 15926
|
- sq. feet
|
- baths - beds |
show details | |

|
#36
Buck Falls Rd
Bedford, PA 15522
|
656 sq. feet
|
- baths - beds |
show details | |

|
#37
Hyndman Rd
Hyndman, PA 15545
|
1,064 sq. feet
|
- baths - beds |
show details | |

|
#38
Winding Hill Rd
Bedford, PA 15522
|
656 sq. feet
|
- baths - beds |
show details | |

|
#39
Cortland Dr
New Paris, PA 15554
|
- sq. feet
|
- baths - beds |
show details | |

|
#40
Hyndman Rd
Hyndman, PA 15545
|
1,252 sq. feet
|
- baths - beds |
show details |
| Photo | Address | Area | Beds / Baths | Price | Details |
|---|---|---|---|---|---|

|
#41
Calamont Rd
Bedford, PA 15522
|
833 sq. feet
|
- baths - beds |
show details | |

|
#42
Business 220
Bedford, PA 15522
|
- sq. feet
|
- baths - beds |
show details | |

|
#43
Tew Ln
Bedford, PA 15522
|
- sq. feet
|
- baths - beds |
show details | |

|
#44
Short St
Bedford, PA 15522
|
1,104 sq. feet
|
- baths - beds |
show details | |

|
#45
Hyndman Rd
Hyndman, PA 15545
|
1,080 sq. feet
|
- baths - beds |
show details | |

|
#46
Country Ridge Rd
Bedford, PA 15522
|
1,588 sq. feet
|
- baths - beds |
show details | |

|
#47
Green Ln
Bedford, PA 15522
|
1,200 sq. feet
|
- baths - beds |
show details | |

|
#48
Salas Hills Rd
Bedford, PA 15522
|
1,904 sq. feet
|
- baths - beds |
show details | |

|
#49
Markwood Dr
Bedford, PA 15522
|
- sq. feet
|
- baths - beds |
show details | |

|
Check over 1 million property listings on Foreclosure.com!
|
browse all offers | |||


Median year apartment built: 1946
Household type by relationship:
Households: 144- Male householders: 49 (13 living alone), Female householders: 19 (11 living alone)
30 spouses (30 opposite-sex spouses), 3 unmarried partners, (3 opposite-sex unmarried partners), 40 children (39 natural, 0 adopted, 0 stepchildren), 0 grandchildren, 0 brothers or sisters, 0 parents, 0 foster children, 0 other relatives, 0 non-relatives
Size of family households: 17 2-persons, 12 3-persons, 7 4-persons.
Size of nonfamily households: 28 1-person, 6 2-persons.
22 married couples with children.
5 single-parent households (3 men, 2 women).
98.6% of residents of New Baltimore speak English at home.
| Here: | 5.8 |
| State: | 6.8 |
| Here: | 3.9 |
| State: | 4.3 |

- Bedrooms in owner-occupied houses and condos in New Baltimore, Pennsylvania
- 0no bedroom
- 01 bedroom
- 102 bedrooms
- 373 bedrooms
- 104 bedrooms
- 05+ bedrooms

- Bedrooms in renter-occupied apartments in New Baltimore, Pennsylvania
- 0no bedroom
- 41 bedroom
- 32 bedrooms
- 73 bedrooms
- 04 bedrooms
- 05+ bedrooms

- Cars and other vehicles available in New Baltimore in owner-occupied houses/condos
- 0no vehicle
- 121 vehicle
- 332 vehicles
- 63 vehicles
- 64 vehicles
- 05+ vehicles

- Cars and other vehicles available in New Baltimore in renter-occupied apartments
- 4no vehicle
- 51 vehicle
- 52 vehicles
- 03 vehicles
- 04 vehicles
- 05+ vehicles

- Rooms in owner-occupied houses in New Baltimore, Pennsylvania
- 01 room
- 02 rooms
- 03 rooms
- 04 rooms
- 195 rooms
- 266 rooms
- 77 rooms
- 08 rooms
- 49+ rooms

- Rooms in renter-occupied apartments in New Baltimore, Pennsylvania
- 01 room
- 02 rooms
- 43 rooms
- 64 rooms
- 35 rooms
- 16 rooms
- 07 rooms
- 08 rooms
- 09+ rooms


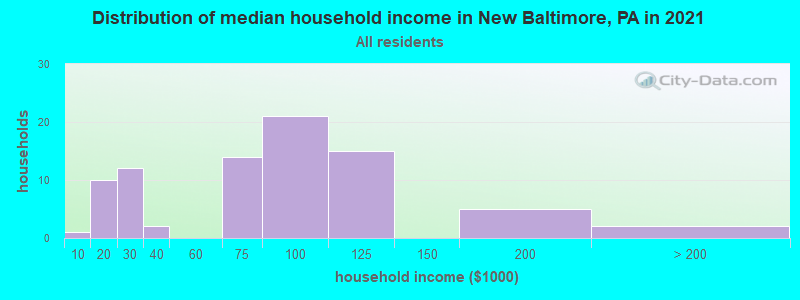
New Baltimore, PA household income distribution

- 3Less than $10,000
- 9$10,000 to $19,999
- 8$20,000 to $29,999
- 11$30,000 to $39,999
- 1$40,000 to $49,999
- 6$60,000 to $74,999
- 15$75,000 to $99,999
- 7$100,000 to $124,999
- 7$125,000 to $149,999
- 4$200,000 or more
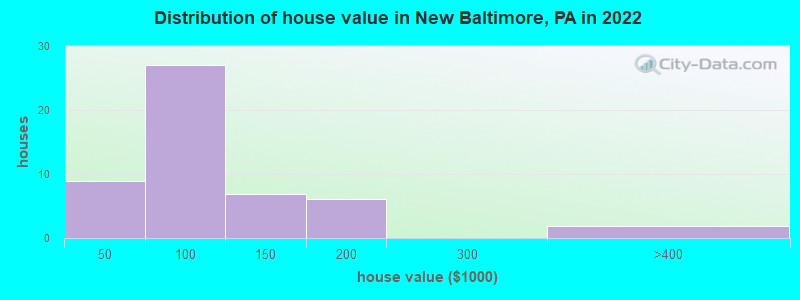
Home value of owner - occupied houses in 2022 in New Baltimore, PA
-
- 6$10,000 to $14,999
- 2$35,000 to $39,999
- 6$50,000 to $59,999
- 7$70,000 to $79,999
- 9$80,000 to $89,999
- 2$90,000 to $99,999
- 5$100,000 to $124,999
- 1$125,000 to $149,999
- 6$150,000 to $174,999
- 1$300,000 to $399,999
Rent paid by renters in 2022 in New Baltimore, PA
-
- 3$250 to $299
- 1$350 to $399
- 1$450 to $499
- 5$500 to $549
- 3$700 to $749


Percentage of workers working in this county: 25.0%
Number of people working at home: 0 (0.0% of all workers)
Travel time to work (commute)
- Less than 5 minutes: 0
- 5 to 9 minutes: 3
- 10 to 14 minutes: 3
- 15 to 19 minutes: 4
- 20 to 24 minutes: 4
- 25 to 29 minutes: 20
- 30 to 34 minutes: 23
- 35 to 39 minutes: 0
- 40 to 44 minutes: 3
- 45 to 59 minutes: 7
- 60 to 89 minutes: 2
- 90 or more minutes: 8
Means of transportation to work:
- Drove a car alone: 74 (82.2%)
- Carpooled: 5 (5.6%)
- Walked: 6 (6.7%)
- Other means: 3 (3.3%)
- Worked at home: 2 (2.2%)


First ancestries reported:
- German: 53 (84.9%)
- Dutch: 3 (4.8%)
- English: 2 (3.2%)
- Italian: 1 (1.6%)
Place of birth for U.S.-born residents:
- This state: 138
- Other state: 7
- Northeast: 0
- Midwest: 0
- South: 7
- West: 0
96.5% of New Baltimore residents lived in the same house 1 years ago.
Out of people who lived in different houses, 16.7% lived in this county.
Out of people who lived in different counties, 100.0% lived in Pennsylvania.
| New Baltimore: | 96.5% |
| State average: | 89.3% |
Education attainment for males 25 years and older:
- No schooling: 0
- Nursery to 4th grade: 0
- 5th and 6th grade: 0
- 7th and 8th grade: 0
- 9th grade: 0
- 10th grade: 2
- 11th grade: 0
- 12th grade, no diploma: 0
- High school graduate (or equivalency): 37
- Less than 1 year of college: 2
- Some college more than 1 year, no degree: 7
- Associate degree: 0
- Bachelor's degree: 5
- Master's degree: 0
- Professional school degree: 0
- Doctorate degree: 0

Education attainment for females 25 years and older:
- No schooling: 0
- Nursery to 4th grade: 0
- 5th and 6th grade: 0
- 7th and 8th grade: 0
- 9th grade: 0
- 10th grade: 2
- 11th grade: 0
- 12th grade, no diploma: 0
- High school graduate (or equivalency): 16
- Less than 1 year of college: 3
- Some college more than 1 year, no degree: 10
- Associate degree: 3
- Bachelor's degree: 6
- Master's degree: 0
- Professional school degree: 0
- Doctorate degree: 0


Housing units in structures:
- One, detached: 63
- 5 to 9: 8
- Mobile homes: 6
House/condo owner moved in on average 15 years ago
Renter moved in on average 1 years ago

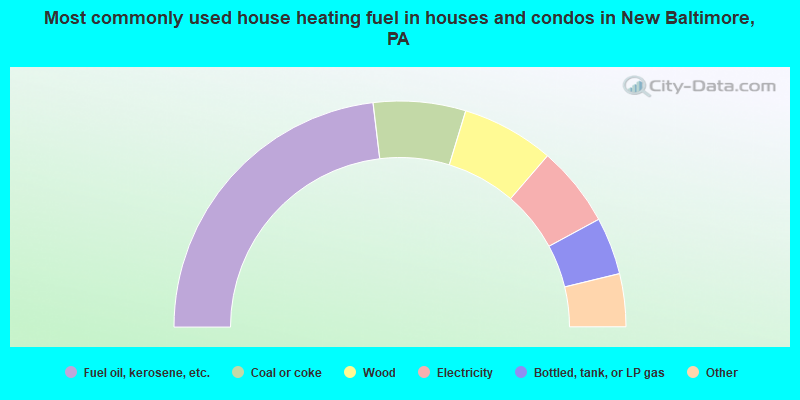
- 50.0%Fuel oil, kerosene, etc.
- 14.3%Coal or coke
- 14.3%Wood
- 12.5%Electricity
- 8.9%Bottled, tank, or LP gas
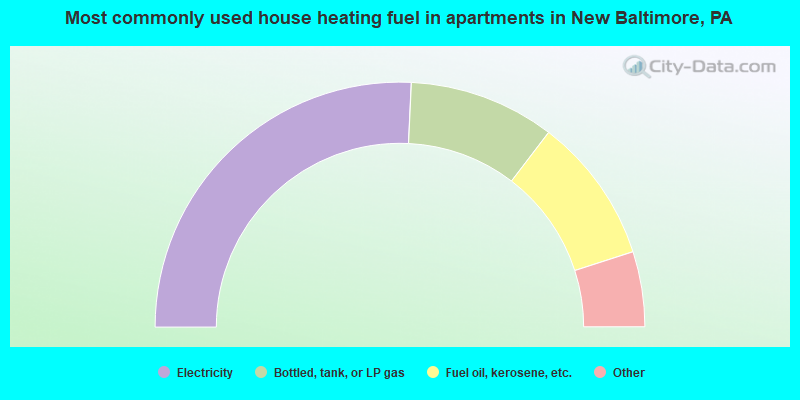
- 57.1%Electricity
- 21.4%Bottled, tank, or LP gas
- 21.4%Fuel oil, kerosene, etc.
Private vs. public school enrollment:
| Here: | 0.0% |
| Pennsylvania: | 15.7% |
| Here: | 0.0% |
| Pennsylvania: | 13.4% |
| Here: | 0.0% |
| Pennsylvania: | 39.8% |


