New Bedford, MA (Massachusetts) Houses and Residents
| New Bedford: | $337,200 |
| Massachusetts: | $534,700 |
Mean price in 2022:
Detached houses: $338,047
Here: $338,047 State: $651,570 Townhouses or other attached units: $182,958
Here: $182,958 State: $617,749 In 2-unit structures: $245,790
Here: $245,790 State: $594,808 In 3-to-4-unit structures: $306,078
Here: $306,078 State: $601,912 In 5-or-more-unit structures: $234,081
Here: $234,081 State: $555,768
Total population: 94,845 (Urban population: 93,465, Rural population: 303 (all nonfarm))
Houses: 46,956 (44,322 occupied: 17,167 owner occupied, 27,155 renter occupied)
| % of renters here: | 61% |
| State: | 38% |
Housing density: 2,334 houses/condos per square mile
Median price asked for vacant for-sale houses and condos in 2022: $481,168.
Median contract rent in 2022: $858 (lower quartile is $652, upper quartile is $1,109)
Median rent asked for vacant for-rent units in 2022: $1,760
Median gross rent in New Bedford, MA in 2022: $1,037
Housing units in New Bedford with a mortgage: 9,997 (693 second mortgage, 0 home equity loan, 507 both second mortgage and home equity loan)
Houses without a mortgage: 470
Median household income for houses/condos with a mortgage: $99,565
Median household income for apartments without a mortgage: $59,344
Median monthly housing costs: $1,088
Compare current foreclosures in New Bedford, MA:
| Photo | Address | Area | Beds / Baths | Price | Details |
|---|---|---|---|---|---|

|
#1
Peckham St
New Bedford, MA 02746
|
3,089 sq. feet
|
3 baths 9 beds |
show details | |

|
#2
Willis St
New Bedford, MA 02740
|
1,973 sq. feet
|
2 baths 4 beds |
show details | |

|
#3
Oak St
New Bedford, MA 02740
|
1,460 sq. feet
|
2 baths 3 beds |
show details | |

|
#4
Mill St
New Bedford, MA 02740
|
1,542 sq. feet
|
1 baths 3 beds |
show details | |

|
#5
Belleville Rd
New Bedford, MA 02745
|
- sq. feet
|
2 baths 5 beds |
show details | |

|
#6
Jarry St
New Bedford, MA 02745
|
840 sq. feet
|
1 baths 2 beds |
show details | |

|
#7
Allen St
New Bedford, MA 02740
|
2,202 sq. feet
|
3 baths 5 beds |
show details | |

|
#8
Sagamore St
New Bedford, MA 02740
|
3,303 sq. feet
|
3 baths 9 beds |
show details | |

|
#9
Willis St
New Bedford, MA 02740
|
1,879 sq. feet
|
2 baths 5 beds |
show details | |

|
#10
Holly Tree Ln
New Bedford, MA 02745
|
1,025 sq. feet
|
2 baths 3 beds |
show details |
| Photo | Address | Area | Beds / Baths | Price | Details |
|---|---|---|---|---|---|

|
#11
Chancery St
New Bedford, MA 02740
|
1,327 sq. feet
|
1 baths 3 beds |
show details | |

|
#12
Hatch St
New Bedford, MA 02745
|
1,080 sq. feet
|
2 baths 3 beds |
show details | |

|
#13
Priscilla St
New Bedford, MA 02740
|
1,502 sq. feet
|
1 baths 3 beds |
show details | |

|
#14
Bolton St
New Bedford, MA 02740
|
1,072 sq. feet
|
1 baths 2 beds |
show details | |

|
#15
Park St
New Bedford, MA 02740
|
1,056 sq. feet
|
1 baths 2 beds |
show details | |

|
#16
Covell St
New Bedford, MA 02745
|
4,083 sq. feet
|
3 baths 9 beds |
show details | |

|
#17
Ashland Pl
New Bedford, MA 02740
|
1,228 sq. feet
|
2 baths 3 beds |
show details | |

|
#18
Lawrence St
New Bedford, MA 02745
|
1,150 sq. feet
|
2 baths 3 beds |
show details | |

|
#19
Milford St
New Bedford, MA 02745
|
1,186 sq. feet
|
1 baths 3 beds |
show details | |

|
#20
Erin Ct
New Bedford, MA 02745
|
1,512 sq. feet
|
1 baths 3 beds |
show details |
| Photo | Address | Area | Beds / Baths | Price | Details |
|---|---|---|---|---|---|

|
#21
Rounds St
New Bedford, MA 02740
|
1,450 sq. feet
|
1 baths 4 beds |
show details | |

|
#22
Mount Pleasant St
New Bedford, MA 02746
|
2,575 sq. feet
|
1 baths 4 beds |
show details | |

|
#23
Myrtle St
New Bedford, MA 02746
|
3,162 sq. feet
|
3 baths 9 beds |
show details | |

|
#24
Ocean St
New Bedford, MA 02740
|
2,240 sq. feet
|
2 baths 4 beds |
show details | |

|
#25
Bolton St
New Bedford, MA 02740
|
1,072 sq. feet
|
1 baths 2 beds |
show details | |

|
#26
Brooklawn Ct
New Bedford, MA 02745
|
1,160 sq. feet
|
1 baths 3 beds |
show details | |

|
#27
Reed St
New Bedford, MA 02740
|
1,742 sq. feet
|
1 baths 4 beds |
show details | |

|
#28
Bayview St
New Bedford, MA 02744
|
1,153 sq. feet
|
1 baths 2 beds |
show details | |

|
#29
Austin St # 1
New Bedford, MA 02740
|
2,540 sq. feet
|
2 baths 6 beds |
show details | |

|
#30
Rivet St # 2
New Bedford, MA 02740
|
1,488 sq. feet
|
2 baths 4 beds |
show details |
| Photo | Address | Area | Beds / Baths | Price | Details |
|---|---|---|---|---|---|

|
#31
Beverly St
New Bedford, MA 02745
|
992 sq. feet
|
2 baths 3 beds |
show details | |

|
#32
Lark St
New Bedford, MA 02745
|
1,274 sq. feet
|
1 baths 3 beds |
show details | |

|
#33
Belleville Rd
New Bedford, MA 02745
|
3,024 sq. feet
|
3 baths 7 beds |
show details | |

|
#34
Erin Ct
New Bedford, MA 02745
|
1,804 sq. feet
|
2 baths 3 beds |
show details | |

|
#35
Rockdale Ave
New Bedford, MA 02740
|
1,449 sq. feet
|
1 baths 3 beds |
show details | |

|
#36
Valley View Dr
New Bedford, MA 02740
|
1,232 sq. feet
|
1 baths 3 beds |
show details | |

|
#37
Green St
New Bedford, MA 02740
|
1,755 sq. feet
|
2 baths 4 beds |
show details | |

|
#38
Coffin Ave # 1
New Bedford, MA 02746
|
1,496 sq. feet
|
2 baths 4 beds |
show details | |

|
#39
Geraldine St
New Bedford, MA 02740
|
1,120 sq. feet
|
1 baths 2 beds |
show details | |

|
#40
Hillcrest Rd
New Bedford, MA 02745
|
1,300 sq. feet
|
2 baths 4 beds |
show details |
| Photo | Address | Area | Beds / Baths | Price | Details |
|---|---|---|---|---|---|

|
#41
County St
New Bedford, MA 02740
|
2,624 sq. feet
|
4 baths 4 beds |
show details | |

|
#42
Briarwood Dr
New Bedford, MA 02745
|
1,125 sq. feet
|
1 baths 3 beds |
show details | |

|
#43
Mitchell St
New Bedford, MA 02746
|
3,198 sq. feet
|
3 baths 6 beds |
show details | |

|
#44
Belleville Ave
New Bedford, MA 02745
|
1,118 sq. feet
|
1 baths 3 beds |
show details | |

|
#45
Dartmouth St
New Bedford, MA 02740
|
977 sq. feet
|
1 baths 3 beds |
show details | |

|
#46
Richmond St
New Bedford, MA 02740
|
1,952 sq. feet
|
1 baths 5 beds |
show details | |

|
#47
Elaine Ave
New Bedford, MA 02745
|
1,208 sq. feet
|
2 baths 3 beds |
show details | |

|
#48
Dartmouth St
New Bedford, MA 02740
|
2,724 sq. feet
|
2 baths 5 beds |
show details | |

|
#49
Chestnut St
New Bedford, MA 02740
|
2,860 sq. feet
|
2 baths 4 beds |
show details | |

|
Check over 1 million property listings on Foreclosure.com!
|
browse all offers | |||


 | Parents buying houses for kids (207 replies) |
| How Much Massachusetts Households Make Per Year: Census Data (37 replies) |
| 2022 Real Estate Observations (1122 replies) |
| Another shooting in New Bedford (69 replies) |
| What is going on in the Fall River/New Bedford area??? (111 replies) |
| Resistance to multifamily housing law (67 replies) |

Median year apartment built: 1949
Household type by relationship:
Households: 100,676- Male householders: 20,641 (8,441 living alone), Female householders: 23,681 (8,380 living alone)
12,558 spouses (12,230 opposite-sex spouses), 5,592 unmarried partners, (5,540 opposite-sex unmarried partners), 27,642 children (25,661 natural, 1,547 adopted, 434 stepchildren), 2,493 grandchildren, 642 brothers or sisters, 1,128 parents, 522 foster children, 2,158 other relatives, 2,174 non-relatives
- In group quarters: 1,445
Size of family households: 9,949 2-persons, 5,270 3-persons, 4,705 4-persons, 2,557 5-persons, 939 6-persons, 431 7-or-more-persons.
Size of nonfamily households: 16,821 1-person, 3,204 2-persons, 336 3-persons, 69 5-persons, 41 6-persons.
7,219 married couples with children.
11,921 single-parent households (3,413 men, 8,508 women).
62.7% of residents of New Bedford speak English at home.
16.5% of residents speak Spanish at home (59% speak English very well, 14% speak English well, 16% speak English not well, 11% don't speak English at all).
18.7% of residents speak other Indo-European language at home (60% speak English very well, 23% speak English well, 12% speak English not well, 4% don't speak English at all).
0.8% of residents speak Asian or Pacific Island language at home (60% speak English very well, 25% speak English well, 13% speak English not well, 2% don't speak English at all).
0.9% of residents speak other language at home (47% speak English very well, 14% speak English well, 14% speak English not well, 25% don't speak English at all).
Foreign born population: 22,553 (22.4%)
(51.9% of them are naturalized citizens)
| Here: | 6.0 |
| State: | 6.5 |
| Here: | 4.6 |
| State: | 4.0 |

- Bedrooms in owner-occupied houses and condos in New Bedford, Massachusetts
- 0no bedroom
- 7641 bedroom
- 3,5232 bedrooms
- 9,8313 bedrooms
- 2,6654 bedrooms
- 3845+ bedrooms

- Bedrooms in renter-occupied apartments in New Bedford, Massachusetts
- 1,144no bedroom
- 5,7661 bedroom
- 10,5032 bedrooms
- 8,6663 bedrooms
- 1,0224 bedrooms
- 545+ bedrooms

- Cars and other vehicles available in New Bedford in owner-occupied houses/condos
- 1,430no vehicle
- 5,8681 vehicle
- 6,3982 vehicles
- 2,1293 vehicles
- 1,0094 vehicles
- 3335+ vehicles

- Cars and other vehicles available in New Bedford in renter-occupied apartments
- 6,276no vehicle
- 13,9841 vehicle
- 6,2702 vehicles
- 4623 vehicles
- 1634 vehicles
- 05+ vehicles

- Rooms in owner-occupied houses in New Bedford, Massachusetts
- 01 room
- 2082 rooms
- 2483 rooms
- 2,3684 rooms
- 3,3955 rooms
- 5,1016 rooms
- 2,9107 rooms
- 1,3528 rooms
- 1,5859+ rooms

- Rooms in renter-occupied apartments in New Bedford, Massachusetts
- 9411 room
- 1,4672 rooms
- 4,1503 rooms
- 6,2344 rooms
- 6,9825 rooms
- 5,5556 rooms
- 1,2677 rooms
- 5058 rooms
- 549+ rooms


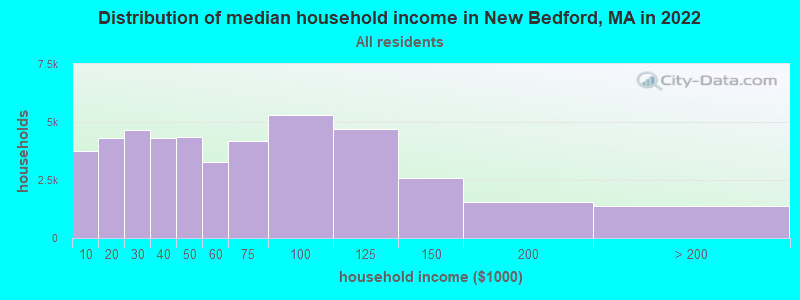
New Bedford, MA household income distribution

- 3,743Less than $10,000
- 4,302$10,000 to $19,999
- 4,668$20,000 to $29,999
- 4,319$30,000 to $39,999
- 4,350$40,000 to $49,999
- 3,262$50,000 to $59,999
- 4,168$60,000 to $74,999
- 5,296$75,000 to $99,999
- 4,708$100,000 to $124,999
- 2,591$125,000 to $149,999
- 1,557$150,000 to $199,999
- 1,358$200,000 or more
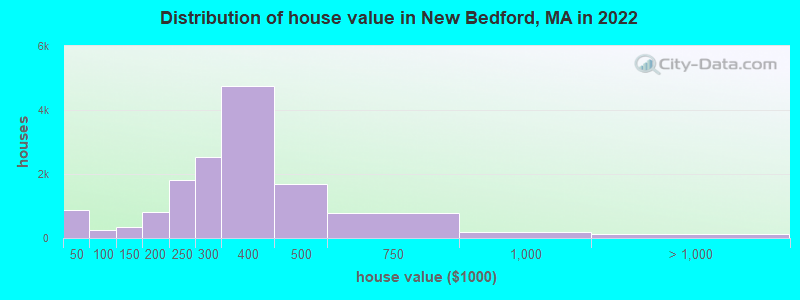
Home value of owner - occupied houses in 2022 in New Bedford, MA
-
- 568Less than $10,000
- 18$10,000 to $14,999
- 12$15,000 to $19,999
- 38$20,000 to $24,999
- 75$25,000 to $29,999
- 88$30,000 to $34,999
- 11$35,000 to $39,999
- 56$40,000 to $49,999
- 59$50,000 to $59,999
- 37$60,000 to $69,999
- 29$80,000 to $89,999
- 75$90,000 to $99,999
- 243$100,000 to $124,999
- 88$125,000 to $149,999
- 402$150,000 to $174,999
- 420$175,000 to $199,999
- 1,819$200,000 to $249,999
- 2,544$250,000 to $299,999
- 4,737$300,000 to $399,999
- 1,674$400,000 to $499,999
- 774$500,000 to $749,999
- 175$750,000 to $999,999
- 89$1,000,000 to $1,499,999
- 34$2,000,000 or more
Rent paid by renters in 2022 in New Bedford, MA
-
- 709$100 to $149
- 75$150 to $199
- 316$200 to $249
- 625$250 to $299
- 789$300 to $349
- 120$350 to $399
- 834$400 to $449
- 761$450 to $499
- 785$500 to $549
- 192$550 to $599
- 1,199$600 to $649
- 1,166$650 to $699
- 1,590$700 to $749
- 1,787$750 to $799
- 3,369$800 to $899
- 3,103$900 to $999
- 4,476$1,000 to $1,249
- 1,161$1,250 to $1,499
- 2,572$1,500 to $1,999
- 134$2,000 to $2,499
- 59$3,500 or more
- 1,333No cash rent


Percentage of workers working in this county: 78.7%
Number of people working at home: 2,697 (5.7% of all workers)
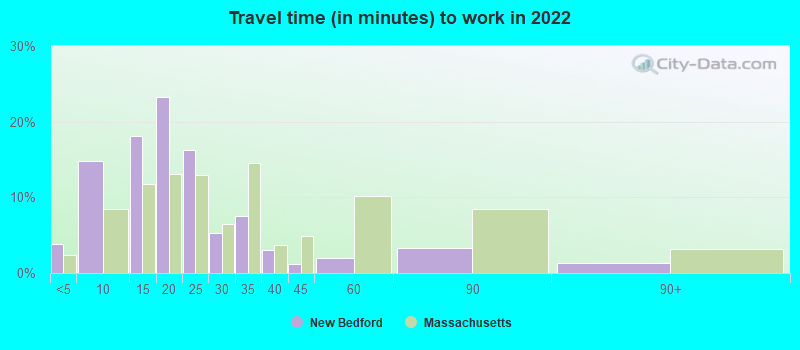
Travel time to work (commute)
- Less than 5 minutes: 762
- 5 to 9 minutes: 5,548
- 10 to 14 minutes: 7,361
- 15 to 19 minutes: 9,494
- 20 to 24 minutes: 6,393
- 25 to 29 minutes: 2,941
- 30 to 34 minutes: 3,266
- 35 to 39 minutes: 950
- 40 to 44 minutes: 1,570
- 45 to 59 minutes: 1,774
- 60 to 89 minutes: 2,194
- 90 or more minutes: 1,231
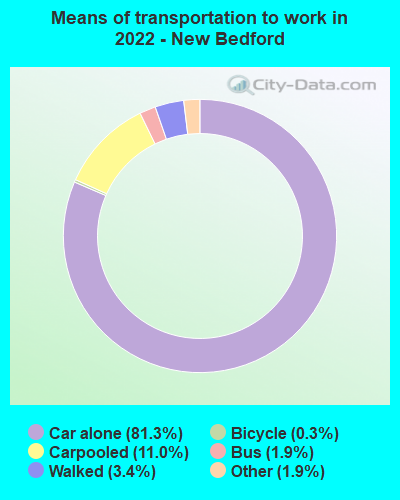
Means of transportation to work:
- Drove a car alone: 27,094 (73.7%)
- Carpooled: 4,074 (11.1%)
- Bus: 574 (1.6%)
- Subway or elevated rail: 10 (0.0%)
- Long-distance train or commuter rail: 53 (0.1%)
- Ferryboat: 11 (0.0%)
- Taxi: 724 (2.0%)
- Bicycle: 76 (0.2%)
- Walked: 801 (2.2%)
- Worked at home: 2,697 (7.3%)

- Unemployment by race in 2022
- Unemployment rate for White non-Hispanic residents
- 5.7%Males
- 3.7%Females
- Unemployment rate for Black residents
- 1.3%Males
- 8.7%Females
- Unemployment rate for American Indian and Alaska Native residents
- 6.8%Females
- Unemployment rate for Asian residents
- 3.1%Males
- Unemployment rate for other race residents
- 9.5%Males
- 2.7%Females
- Unemployment rate for two or more race residents
- 9.3%Males
- 11.7%Females
- Unemployment rate for Hispanic or Latino residents
- 4.5%Males
- 7.5%Females

- Year of entry for the foreign-born population in New Bedford, Massachusetts
- 8,1542010 or later
- 3,5142000 to 2009
- 2,3991990 to 1999
- 4,0911980 to 1989
- 5,5141970 to 1979
- 5,406Before 1970
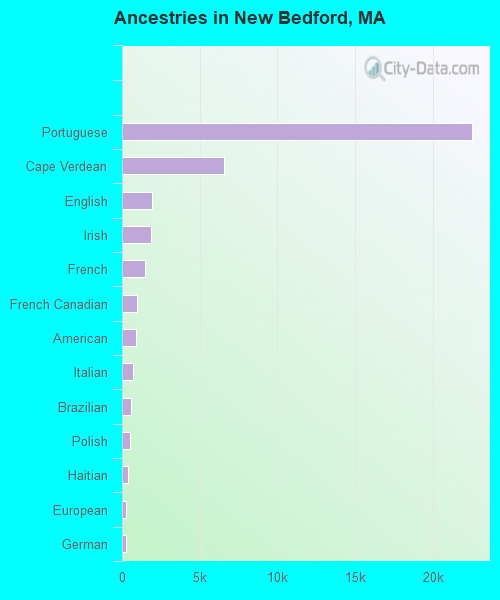
First ancestries reported:
- Portuguese: 22,498 (37.0%)
- Cape Verdean: 6,566 (10.8%)
- English: 1,920 (3.2%)
- Irish: 1,884 (3.1%)
- French: 1,459 (2.4%)
- French Canadian: 996 (1.6%)
- American: 927 (1.5%)
- Italian: 740 (1.2%)
- Brazilian: 573 (0.9%)
- Polish: 539 (0.9%)
- Haitian: 418 (0.7%)
- European: 246 (0.4%)
- German: 238 (0.4%)
- Canadian: 105 (0.2%)
- African: 105 (0.2%)
- Armenian: 101 (0.2%)
- Swedish: 100 (0.2%)
- Lebanese: 98 (0.2%)
- Jamaican: 75 (0.1%)
- Norwegian: 72 (0.1%)
- Egyptian: 59 (0.10%)
- South African: 58 (0.10%)
- Barbadian: 58 (0.10%)
- Scotch-Irish: 57 (0.09%)
- Scottish: 31 (0.05%)
- Nigerian: 30 (0.05%)
- Greek: 30 (0.05%)
- Eastern European: 23 (0.04%)
- Russian: 20 (0.03%)
- Jordanian: 18 (0.03%)
- Austrian: 16 (0.03%)
- West Indian: 15 (0.02%)
- Arab: 14 (0.02%)
- Scandinavian: 14 (0.02%)
- British West Indian: 14 (0.02%)
- Ethiopian: 13 (0.02%)
- Czech: 12 (0.02%)
- British: 11 (0.02%)
- Serbian: 10 (0.02%)
- Kenyan: 8 (0.01%)
- Lithuanian: 8 (0.01%)
- Danish: 7 (0.01%)
- Swiss: 7 (0.01%)
- Senegalese: 7 (0.01%)
- Ukrainian: 5 (0.01%)
- Bahamian: 5 (0.01%)
Most common places of birth for foreign-born residents (%):
| New Bedford: | 34.7% (7,228) |
| Massachusetts: | 4.1% (50,360) |
| New Bedford: | 14.4% (2,996) |
| Massachusetts: | 2.6% (32,354) |
| New Bedford: | 9.2% (1,906) |
| Massachusetts: | 2.7% (32,733) |
| New Bedford: | 6.3% (1,319) |
| Massachusetts: | 1.1% (13,563) |
| New Bedford: | 5.1% (1,067) |
| Massachusetts: | 3.7% (45,667) |
| New Bedford: | 4.9% (1,020) |
| Massachusetts: | 8.3% (101,767) |
| New Bedford: | 4.5% (933) |
| Massachusetts: | 7.6% (92,959) |
| New Bedford: | 3.4% (718) |
| Massachusetts: | 0.9% (10,768) |
| New Bedford: | 2.6% (533) |
| Massachusetts: | 1.1% (13,065) |
| New Bedford: | 1.9% (387) |
| Massachusetts: | 4.9% (60,432) |
Place of birth for U.S.-born residents:
- This state: 59,621
- Other state: 10,523
- Northeast: 6,757
- Midwest: 561
- South: 2,433
- West: 772
88.4% of New Bedford residents lived in the same house 1 years ago.
Out of people who lived in different houses, 41.5% lived in this county.
Out of people who lived in different counties, 59.7% lived in Massachusetts.
| New Bedford: | 88.4% |
| State average: | 87.7% |
Education attainment for males 25 years and older:
- No schooling: 1,654
- Nursery to 4th grade: 955
- 5th and 6th grade: 902
- 7th and 8th grade: 759
- 9th grade: 902
- 10th grade: 2,007
- 11th grade: 1,211
- 12th grade, no diploma: 743
- High school graduate (or equivalency): 13,521
- Less than 1 year of college: 1,543
- Some college more than 1 year, no degree: 3,661
- Associate degree: 1,551
- Bachelor's degree: 2,504
- Master's degree: 1,352
- Professional school degree: 297
- Doctorate degree: 208

Education attainment for females 25 years and older:
- No schooling: 1,357
- Nursery to 4th grade: 1,732
- 5th and 6th grade: 337
- 7th and 8th grade: 842
- 9th grade: 571
- 10th grade: 574
- 11th grade: 1,131
- 12th grade, no diploma: 919
- High school graduate (or equivalency): 12,586
- Less than 1 year of college: 1,739
- Some college more than 1 year, no degree: 3,336
- Associate degree: 3,572
- Bachelor's degree: 4,892
- Master's degree: 1,923
- Professional school degree: 89
- Doctorate degree: 221


Housing units in structures:
- One, detached: 12,648
- One, attached: 816
- Two: 8,985
- 3 or 4: 13,177
- 5 to 9: 4,852
- 10 to 19: 1,935
- 20 to 49: 1,446
- 50 or more: 3,097
Housing units lacking complete kitchen facilities in 2022: 3.2%
House/condo owner moved in on average 14 years ago
Renter moved in on average 4 years ago

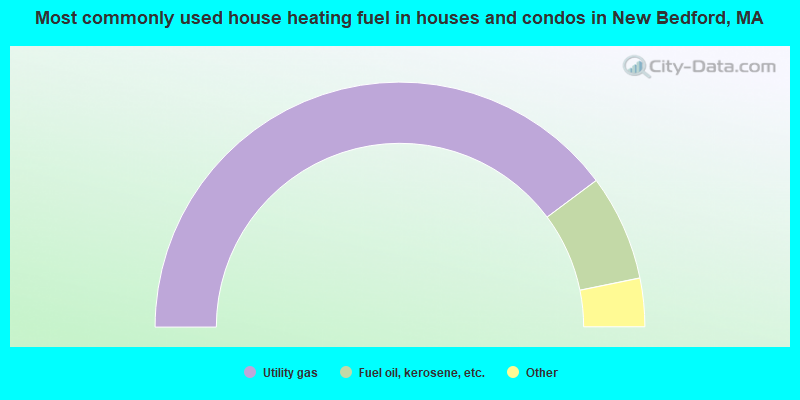
- 79.6%Utility gas
- 14.0%Fuel oil, kerosene, etc.
- 3.2%Electricity
- 1.9%Bottled, tank, or LP gas
- 0.5%Wood
- 0.5%Solar energy
- 0.3%Other fuel
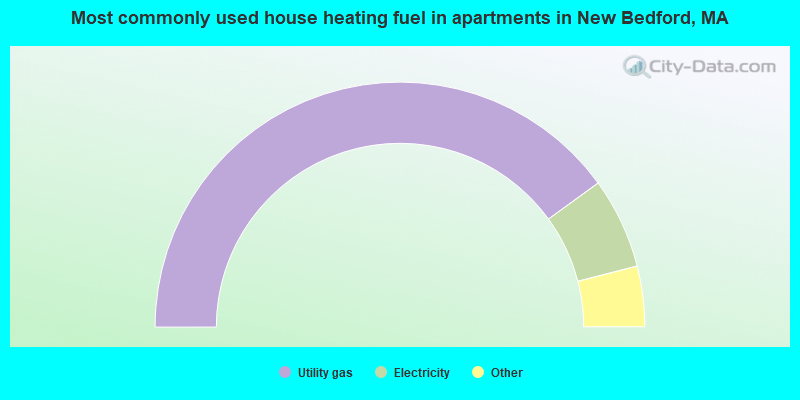
- 80.1%Utility gas
- 12.0%Electricity
- 3.9%Fuel oil, kerosene, etc.
- 2.2%Bottled, tank, or LP gas
- 1.4%No fuel used
- 0.3%Solar energy
- 0.1%Other fuel
Private vs. public school enrollment:
| Here: | 9.3% |
| Massachusetts: | 10.3% |
| Here: | 5.4% |
| Massachusetts: | 12.3% |
| Here: | 7.3% |
| Massachusetts: | 51.2% |


