New Berlin, WI (Wisconsin) Houses and Residents
Estimated median house or condo value in 2022: $345,456 (it was $161,100 in 2000 )
New Berlin:
$345,456Wisconsin:
$252,800
Lower value quartile - upper value quartile: $283,434 - $451,331Mean price in 2022: Detached houses: $365,862 Here:
$365,862State:
$308,468
Townhouses or other attached units: $232,660 Here:
$232,660State:
$265,873
In 2-unit structures: $228,234 Here:
$228,234State:
$203,667
In 3-to-4-unit structures: $267,036 Here:
$267,036State:
$216,833
In 5-or-more-unit structures: $215,984 Here:
$215,984State:
$280,537
Total population: 39,842 (Urban population: 35,359, Rural population: 3,003 (70 farm, 2,933 nonfarm ))
Houses: 17,884 (17,554 occupied: 13,675 owner occupied, 4,066 renter occupied )
% of renters here:
23%State:
32%
Housing density: 485 houses/condos per square mile
Median price asked for vacant for-sale houses and condos in 2022: $807,156.
Median contract rent in 2022: $1,230 (lower quartile is $1,012, upper quartile is $1,480)
Median rent asked for vacant for-rent units in 2022: $2,345
Median gross rent in New Berlin, WI in 2022: $1,347
Housing units in New Berlin with a mortgage: 7,752 (1,228 second mortgage, 76 home equity loan, 1,012 both second mortgage and home equity loan )Houses without a mortgage: 504
Median household income for houses/condos with a mortgage: $125,847
Median household income for apartments without a mortgage: $78,580
Median monthly housing costs: $1,306
Data:
Median house or condo value ($)
Median house or condo value ($ change since 2000)
Median house or condo value ($) - White
Median house or condo value ($) - Black or African American
Median house or condo value ($) - Asian
Median house or condo value ($) - Hispanic or Latino
Median house or condo value ($) - American Indian and Alaska Native
Median house or condo value ($) - Multirace
Median house or condo value ($) - Other Race
Median price asked for mobile homes ($)
Household density (households per square mile)
Mean house or condo value by units in structure - 1, detached ($)
Mean house or condo value by units in structure - 1, attached ($)
Mean house or condo value by units in structure - 2 ($)
Mean house or condo value by units in structure by units in structure - 3 or 4 ($)
Mean house or condo value by units in structure - 5 or more ($)
Mean house or condo value by units in structure - Boat, RV, van, etc. ($)
Mean house or condo value by units in structure - Mobile home ($)
Median contract rent ($)
Median contract rent - Lower quartile ($)
Median contract rent - Upper quartile ($)
Median gross rent ($)
Urban houses (%)
Rural houses (%)
Houses occupied (%)
Houses occupied (% change since 2000)
Houses owner occupied (%)
Houses owner occupied (% change since 2000)
Houses renter occupied (%)
Houses renter occupied (% change since 2000)
Vacant housing units - For rent (%)
Vacant housing units - For rent (% change since 2000)
Vacant housing units - For sale only (%)
Vacant housing units - For sale only (% change since 2000)
Vacant housing units - Rented or sold, not occupied (%)
Vacant housing units - Rented or sold, not occupied (% change since 2000)
Vacant housing units - For seasonal, recreational, or occasional use (%)
Vacant housing units - For seasonal, recreational, or occasional use (% change since 2000)
Vacant housing units - For migrant workers (%)
Vacant housing units - For migrant workers (% change since 2000)
Vacant housing units - Other vacant (%)
Vacant housing units - Other vacant (% change since 2000)
Median monthly housing costs ($)
Median household income for houses/condos with a mortgage ($)
Median household income for houses/condos without a mortgage ($)
Median household income ($)
Median household income ($) - White
Median household income ($) - Black or African American
Median household income ($) - Asian
Median household income ($) - Hispanic or Latino
Median household income ($) - American Indian and Alaska Native
Median household income ($) - Multirace
Median household income ($) - Other Race
Mortgage status - with mortgage (%)
Mortgage status - with second mortgage (%)
Mortgage status - with home equity loan (%)
Mortgage status - with both second mortgage and home equity loan (%)
Mortgage status - without a mortgage (%)
Median year house/condo built
Median year apartment built
Household type by relationship - Male householder living alone (%)
Household type by relationship - Male householder not living alone (%)
Household type by relationship - Female householder living alone (%)
Household type by relationship - Female householder not living alone (%)
Household type by relationship - Opposite-Sex spouse (%)
Household type by relationship - Same-Sex spouse (%)
Household type by relationship - Opposite-Sex unmarried partner (%)
Household type by relationship - Same-Sex unmarried partner (%)
Household type by relationship - In group quarters (%)
Size of family households - 2-person household (%)
Size of family households - 3-person household (%)
Size of family households - 4-person household (%)
Size of family households - 5-person household (%)
Size of family households - 6-person household (%)
Size of family households - 7-or-more-person household (%)
Size of nonfamily households - 1-person household (%)
Size of nonfamily households - 2-person household (%)
Size of nonfamily households - 3-person household (%)
Size of nonfamily households - 4-person household (%)
Size of nonfamily households - 5-person household (%)
Size of nonfamily households - 6-person household (%)
Size of nonfamily households - 7-or-moreperson household (%)
Year house built - Built 2010 or later (%)
Year house built - Built 2000 to 2009 (%)
Year house built - Built 1990 to 1999 (%)
Year house built - Built 1980 to 1989 (%)
Year house built - Built 1970 to 1979 (%)
Year house built - Built 1960 to 1969 (%)
Year house built - Built 1950 to 1959 (%)
Year house built - Built 1940 to 1949 (%)
Year house built - Built 1939 or earlier (%)
Median number of rooms in houses and condos
Median number of rooms in apartments
Median number of bedrooms in owner occupied houses
Mean number of bedrooms in owner occupied houses
Median number of bedrooms in renter occupied houses
Mean number of bedrooms in renter occupied houses
Median number of vehichles in owner occupied houses
Mean number of vehichles in owner occupied houses
Median number of vehichles in renter occupied houses
Mean number of vehichles in renter occupied houses
Rooms in owner-occupied houses - 1 room (%)
Rooms in owner-occupied houses - 2 rooms (%)
Rooms in owner-occupied houses - 3 rooms (%)
Rooms in owner-occupied houses - 4 rooms (%)
Rooms in owner-occupied houses - 5 rooms (%)
Rooms in owner-occupied houses - 6 rooms (%)
Rooms in owner-occupied houses - 7 rooms (%)
Rooms in owner-occupied houses - 8 rooms (%)
Rooms in owner-occupied houses - 9+ rooms (%)
Rooms in renter-occupied houses - 1 room (%)
Rooms in renter-occupied houses - 2 rooms (%)
Rooms in renter-occupied houses - 3 rooms (%)
Rooms in renter-occupied houses - 4 rooms (%)
Rooms in renter-occupied houses - 5 rooms (%)
Rooms in renter-occupied houses - 6 rooms (%)
Rooms in renter-occupied houses - 7 rooms (%)
Rooms in renter-occupied houses - 8 rooms (%)
Rooms in renter-occupied houses - 9+ rooms (%)
Bedrooms in owner-occupied houses - no bedrooms (%)
Bedrooms in owner-occupied houses - 1 bedroom (%)
Bedrooms in owner-occupied houses - 2 bedrooms (%)
Bedrooms in owner-occupied houses - 3 bedrooms (%)
Bedrooms in owner-occupied houses - 4 bedrooms (%)
Bedrooms in owner-occupied houses - 5+ bedrooms (%)
Bedrooms in renter-occupied houses - no bedrooms (%)
Bedrooms in renter-occupied houses - 1 bedroom (%)
Bedrooms in renter-occupied houses - 2 bedrooms (%)
Bedrooms in renter-occupied houses - 3 bedrooms (%)
Bedrooms in renter-occupied houses - 4 bedrooms (%)
Bedrooms in renter-occupied houses - 5+ bedrooms (%)
Vehicles available in owner-occupied houses - no vehicle available (%)
Vehicles available in owner-occupied houses - 1 vehicle available(%)
Vehicles available in owner-occupied houses - 2 Vehicles available (%)
Vehicles available in owner-occupied houses - 3 Vehicles available (%)
Vehicles available in owner-occupied houses - 4 Vehicles available (%)
Vehicles available in owner-occupied houses - 5+ Vehicles available (%)
Vehicles available in renter-occupied houses - no vehicle available (%)
Vehicles available in renter-occupied houses - 1 vehicle available (%)
Vehicles available in renter-occupied houses - 2 Vehicles available (%)
Vehicles available in renter-occupied houses - 3 Vehicles available (%)
Vehicles available in renter-occupied houses - 4 Vehicles available (%)
Vehicles available in renter-occupied houses - 5+ Vehicles available (%)
Housing units in structures - 1, detached (%)
Housing units in structures - 1, attached (%)
Housing units in structures - 2 (%)
Housing units in structures - 3 or 4 (%)
Housing units in structures - 5 to 9 (%)
Housing units in structures - 10 to 19 (%)
Housing units in structures - 20 to 49 (%)
Housing units in structures - 50 or more (%)
Housing units in structures - Mobile home (%)
Housing units in structures - Boat, RV, van, etc. (%)
Housing units in structures - Owners - 1, detached (%)
Housing units in structures - Owners - 1, attached (%)
Housing units in structures - Owners - 2 (%)
Housing units in structures - Owners - 3 or 4 (%)
Housing units in structures - Owners - 5 to 9 (%)
Housing units in structures - Owners - 10 to 19 (%)
Housing units in structures - Owners - 20 to 49 (%)
Housing units in structures - Owners - 50 or more (%)
Housing units in structures - Owners - Mobile home (%)
Housing units in structures - Owners - Boat, RV, van, etc. (%)
Housing units in structures - Renters - 1, detached (%)
Housing units in structures - Renters - 1, attached (%)
Housing units in structures - Renters - 2 (%)
Housing units in structures - Renters - 3 or 4 (%)
Housing units in structures - Renters - 5 to 9 (%)
Housing units in structures - Renters - 10 to 19 (%)
Housing units in structures - Renters - 20 to 49 (%)
Housing units in structures - Renters - 50 or more (%)
Housing units in structures - Renters - Mobile home (%)
Housing units in structures - Renters - Boat, RV, van, etc. (%)
House/condo owner moved in on average (years ago)
Renter moved in on average (years ago)
Year householder moved into unit - Moved in 1999 to March 2000 (%)
Year householder moved into unit - Moved in 1999 to March 2000 (%) - White
Year householder moved into unit - Moved in 1999 to March 2000 (%) - Black or African American
Year householder moved into unit - Moved in 1999 to March 2000 (%) - Asian
Year householder moved into unit - Moved in 1999 to March 2000 (%) - Hispanic or Latino
Year householder moved into unit - Moved in 1999 to March 2000 (%) - American Indian and Alaska Native
Year householder moved into unit - Moved in 1999 to March 2000 (%) - Multirace
Year householder moved into unit - Moved in 1999 to March 2000 (%) - Other Race
Year householder moved into unit - Moved in 1995 to 1998 (%)
Year householder moved into unit - Moved in 1995 to 1998 (%) - White
Year householder moved into unit - Moved in 1995 to 1998 (%) - Black or African American
Year householder moved into unit - Moved in 1995 to 1998 (%) - Asian
Year householder moved into unit - Moved in 1995 to 1998 (%) - Hispanic or Latino
Year householder moved into unit - Moved in 1995 to 1998 (%) - American Indian and Alaska Native
Year householder moved into unit - Moved in 1995 to 1998 (%) - Multirace
Year householder moved into unit - Moved in 1995 to 1998 (%) - Other Race
Year householder moved into unit - Moved in 1990 to 1994 (%)
Year householder moved into unit - Moved in 1990 to 1994 (%) - White
Year householder moved into unit - Moved in 1990 to 1994 (%) - Black or African American
Year householder moved into unit - Moved in 1990 to 1994 (%) - Asian
Year householder moved into unit - Moved in 1990 to 1994 (%) - Hispanic or Latino
Year householder moved into unit - Moved in 1990 to 1994 (%) - American Indian and Alaska Native
Year householder moved into unit - Moved in 1990 to 1994 (%) - Multirace
Year householder moved into unit - Moved in 1990 to 1994 (%) - Other Race
Year householder moved into unit - Moved in 1980 to 1989 (%)
Year householder moved into unit - Moved in 1980 to 1989 (%) - White
Year householder moved into unit - Moved in 1980 to 1989 (%) - Black or African American
Year householder moved into unit - Moved in 1980 to 1989 (%) - Asian
Year householder moved into unit - Moved in 1980 to 1989 (%) - Hispanic or Latino
Year householder moved into unit - Moved in 1980 to 1989 (%) - American Indian and Alaska Native
Year householder moved into unit - Moved in 1980 to 1989 (%) - Multirace
Year householder moved into unit - Moved in 1980 to 1989 (%) - Other Race
Year householder moved into unit - Moved in 1970 to 1979 (%)
Year householder moved into unit - Moved in 1970 to 1979 (%) - White
Year householder moved into unit - Moved in 1970 to 1979 (%) - Black or African American
Year householder moved into unit - Moved in 1970 to 1979 (%) - Asian
Year householder moved into unit - Moved in 1970 to 1979 (%) - Hispanic or Latino
Year householder moved into unit - Moved in 1970 to 1979 (%) - American Indian and Alaska Native
Year householder moved into unit - Moved in 1970 to 1979 (%) - Multirace
Year householder moved into unit - Moved in 1970 to 1979 (%) - Other Race
Year householder moved into unit - Moved in 1969 or earlier (%)
Year householder moved into unit - Moved in 1969 or earlier (%) - White
Year householder moved into unit - Moved in 1969 or earlier (%) - Black or African American
Year householder moved into unit - Moved in 1969 or earlier (%) - Asian
Year householder moved into unit - Moved in 1969 or earlier (%) - Hispanic or Latino
Year householder moved into unit - Moved in 1969 or earlier (%) - American Indian and Alaska Native
Year householder moved into unit - Moved in 1969 or earlier (%) - Multirace
Year householder moved into unit - Moved in 1969 or earlier (%) - Other Race
Housing units lacking complete plumbing facilities (%)
Housing units lacking complete kitchen facilities (%)
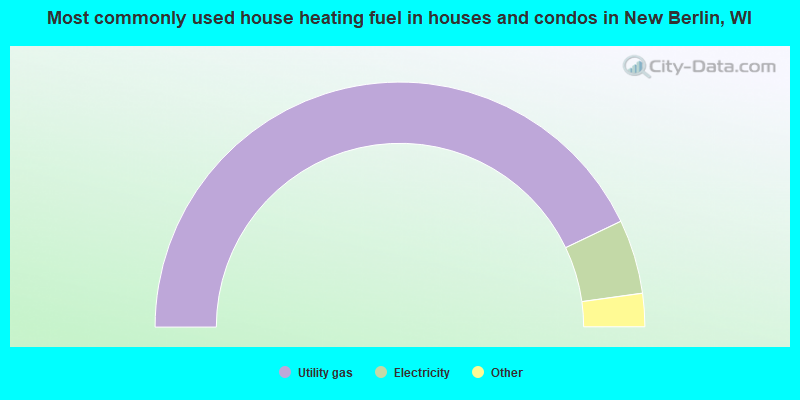
House heating fuel used in houses and condos - Utility gas (%)
House heating fuel used in houses and condos - Bottled, tank, or LP gas (%)
House heating fuel used in houses and condos - Electricity (%)
House heating fuel used in houses and condos - Fuel oil, kerosene, etc. (%)
House heating fuel used in houses and condos - Coal or coke (%)
House heating fuel used in houses and condos - Wood (%)
House heating fuel used in houses and condos - Solar energy (%)
House heating fuel used in houses and condos - Other fuel (%)
House heating fuel used in houses and condos - No fuel used (%)
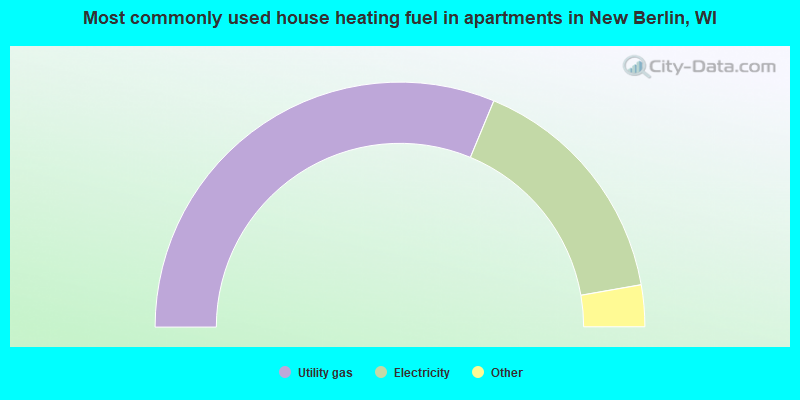
House heating fuel used in apartments - Utility gas (%)
House heating fuel used in apartments - Bottled, tank, or LP gas (%)
House heating fuel used in apartments - Electricity (%)
House heating fuel used in apartments - Fuel oil, kerosene, etc. (%)
House heating fuel used in apartments - Coal or coke (%)
House heating fuel used in apartments - Wood (%)
House heating fuel used in apartments - Solar energy (%)
House heating fuel used in apartments - Other fuel (%)
House heating fuel used in apartments - No fuel used (%)
Median year house/condo built: 1974Median year apartment built: 1992Household type by relationship:
Households: 40,698
Male householders: 8,923 (1,819 living alone ), Female householders: 8,495 (2,794 living alone )10,071 spouses (10,016 opposite-sex spouses ), 793 unmarried partners , (728 opposite-sex unmarried partners ), 10,489 children (10,066 natural , 231 adopted , 191 stepchildren ), 389 grandchildren , 112 brothers or sisters , 470 parents , 43 foster children , 202 other relatives , 499 non-relatives In group quarters: 207
Size of family households: 6,765 2-persons , 2,297 3-persons , 2,233 4-persons , 808 5-persons , 82 6-persons , 16 7-or-more-persons .
Size of nonfamily households: 4,915 1-person , 654 2-persons , 47 3-persons , 14 4-persons .
6,111 married couples with children. single-parent households (171 men , 1,038 women ).
93.0% of residents of New Berlin speak English at home. of residents speak Spanish at home (68% speak English very well , 24% speak English well , 7% speak English not well ).of residents speak other Indo-European language at home (88% speak English very well , 11% speak English well , 1% speak English not well ).of residents speak Asian or Pacific Island language at home (66% speak English very well , 15% speak English well , 14% speak English not well , 4% don't speak English at all ).
Foreign born population: 2,507 (6.2%)of them are naturalized citizens )
Median number of rooms in houses and condos:
Median number of rooms in apartments
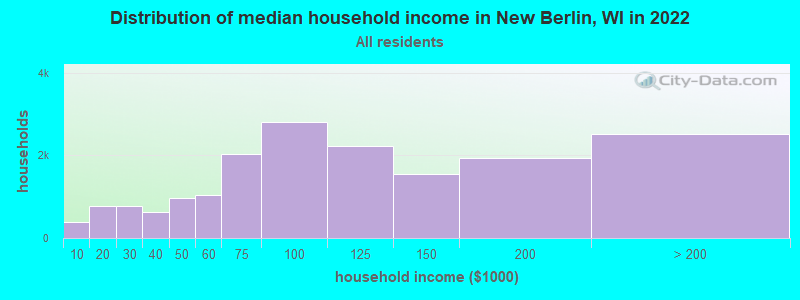
New Berlin, WI household income distribution 388 Less than $10,000767 $10,000 to $19,999767 $20,000 to $29,999628 $30,000 to $39,999961 $40,000 to $49,9991,053 $50,000 to $59,9992,024 $60,000 to $74,9992,808 $75,000 to $99,9992,221 $100,000 to $124,9991,538 $125,000 to $149,9991,942 $150,000 to $199,9992,514 $200,000 or more
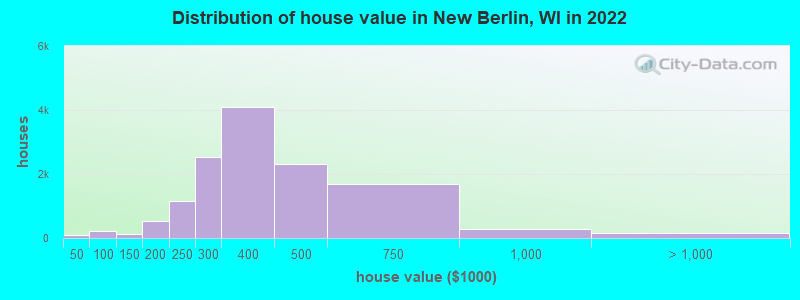
Home value of owner - occupied houses in 2022 in New Berlin, WI 32 Less than $10,00042 $20,000 to $24,99911 $25,000 to $29,99918 $30,000 to $34,99932 $60,000 to $69,99922 $70,000 to $79,99962 $80,000 to $89,99990 $90,000 to $99,99924 $100,000 to $124,99992 $125,000 to $149,999271 $150,000 to $174,999266 $175,000 to $199,9991,154 $200,000 to $249,9992,534 $250,000 to $299,9994,103 $300,000 to $399,9992,297 $400,000 to $499,9991,690 $500,000 to $749,999277 $750,000 to $999,99952 $1,000,000 to $1,499,99938 $1,500,000 to $1,999,99970 $2,000,000 or moreRent paid by renters in 2022 in New Berlin, WI 36 $200 to $24953 $250 to $2998 $350 to $39920 $400 to $44923 $450 to $49922 $500 to $54918 $600 to $649117 $700 to $74972 $750 to $799243 $800 to $899302 $900 to $9991,082 $1,000 to $1,249994 $1,250 to $1,499665 $1,500 to $1,999186 $2,000 to $2,49956 $2,500 to $2,99934 No cash rent
Percentage of workers working in this county: 55.6%Number of people working at home: 2,855 (13.6% of all workers )
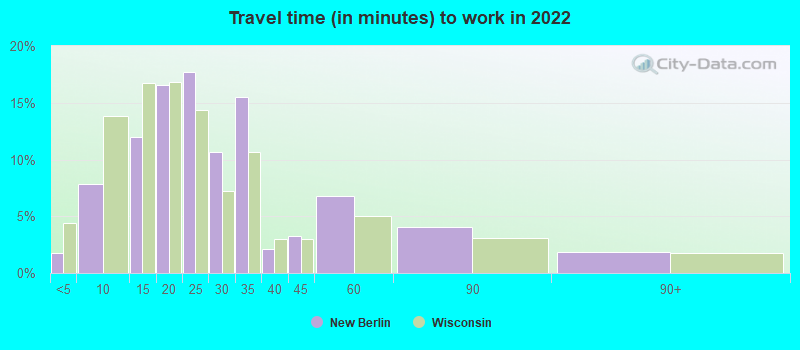
Travel time to work (commute)
Less than 5 minutes: 2825 to 9 minutes: 1,64010 to 14 minutes: 2,30515 to 19 minutes: 3,01820 to 24 minutes: 3,84825 to 29 minutes: 2,33930 to 34 minutes: 2,55735 to 39 minutes: 49740 to 44 minutes: 55845 to 59 minutes: 40260 to 89 minutes: 33090 or more minutes: 203
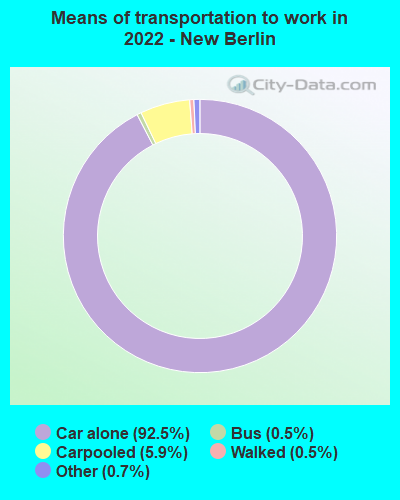
Means of transportation to work:
Drove a car alone: 19,112 (81.0%)Carpooled: 1,342 (5.7%)Bus : 51 (0.2%)Taxi: 165 (0.7%)Bicycle: 3 (0.0%)Walked: 65 (0.3%)Worked at home: 2,855 (12.1%)
Unemployment by race in 2022
Unemployment rate for White non-Hispanic residents 2.4% Males2.1% FemalesUnemployment rate for Black residents 6.2% FemalesUnemployment rate for Asian residents 2.0% MalesUnemployment rate for two or more race residents 6.6% Males2.1% Females
Year of entry for the foreign-born population in New Berlin, Wisconsin
634 2010 or later 431 2000 to 2009 567 1990 to 1999 258 1980 to 1989 226 1970 to 1979 679 Before 1970
First ancestries reported:
German: 6,184 (35.5%)
Polish: 2,084 (12.0%)
American: 1,031 (5.9%)
Irish: 777 (4.5%)
European: 698 (4.0%)
Italian: 584 (3.4%)
Norwegian: 545 (3.1%)
English: 530 (3.0%)
Scottish: 161 (0.9%)
Dutch: 136 (0.8%)
Greek: 108 (0.6%)
French: 106 (0.6%)
Swiss: 105 (0.6%)
Danish: 103 (0.6%)
Hungarian: 96 (0.6%)
Slovene: 78 (0.4%)
Swedish: 75 (0.4%)
Czechoslovakian: 66 (0.4%)
Ukrainian: 66 (0.4%)
Croatian: 51 (0.3%)
Canadian: 49 (0.3%)
Yugoslavian: 48 (0.3%)
Russian: 48 (0.3%)
Austrian: 47 (0.3%)
Eastern European: 46 (0.3%)
Scandinavian: 38 (0.2%)
Senegalese: 38 (0.2%)
British: 35 (0.2%)
Scotch-Irish: 35 (0.2%)
Finnish: 25 (0.1%)
Celtic: 25 (0.1%)
Czech: 24 (0.1%)
Belgian: 20 (0.1%)
Welsh: 20 (0.1%)
Australian: 16 (0.09%)
Luxembourger: 15 (0.09%)
Lithuanian: 14 (0.08%)
Slovak: 12 (0.07%)
French Canadian: 12 (0.07%)
Romanian: 11 (0.06%)
Macedonian: 11 (0.06%)
Serbian: 10 (0.06%)
Portuguese: 9 (0.05%)
Northern European: 6 (0.03%)
Latvian: 1 (0.01%) Most common places of birth for foreign-born residents (%): India New Berlin:
28.0% (707)Wisconsin:
8.0% (23,594)
Vietnam New Berlin:
9.3% (234)Wisconsin:
1.5% (4,400)
China, excluding Hong Kong and Taiwan New Berlin:
6.1% (155)Wisconsin:
5.1% (15,165)
Germany New Berlin:
5.9% (150)Wisconsin:
3.0% (8,773)
Mexico New Berlin:
4.0% (102)Wisconsin:
29.5% (87,182)
Korea New Berlin:
4.0% (100)Wisconsin:
1.8% (5,320)
Taiwan New Berlin:
3.5% (88)Wisconsin:
0.7% (1,987)
Canada New Berlin:
3.4% (87)Wisconsin:
2.3% (6,747)
Philippines New Berlin:
2.9% (72)Wisconsin:
3.1% (9,280)
Brazil New Berlin:
2.9% (72)Wisconsin:
0.7% (2,101)
Hungary New Berlin:
2.7% (68)Wisconsin:
0.3% (858)
Greece New Berlin:
2.4% (60)Wisconsin:
0.3% (843)
United Kingdom, excluding England and Scotland New Berlin:
1.9% (49)Wisconsin:
0.8% (2,427)
Bangladesh New Berlin:
1.5% (38)Wisconsin:
0.3% (1,015)
Italy New Berlin:
1.5% (38)Wisconsin:
0.7% (2,099)
Place of birth for U.S.-born residents:
This state: 31,589Other state: 6,269Northeast: 558Midwest: 4,284South: 759West: 663 92.1% of New Berlin residents lived in the same house 1 years ago.
Out of people who lived in different houses, 25.8% lived in this county.
Out of people who lived in different counties, 76.6% lived in Wisconsin.
New Berlin:
92.1%State average:
87.7%
Education attainment for males 25 years and older:
No schooling: 68Nursery to 4th grade: 135th and 6th grade: 117th and 8th grade: 09th grade: 2810th grade: 4311th grade: 8912th grade, no diploma: 202High school graduate (or equivalency): 3,544Less than 1 year of college: 972Some college more than 1 year, no degree: 1,378Associate degree: 1,797Bachelor's degree: 4,323Master's degree: 1,751Professional school degree: 491Doctorate degree: 262
Education attainment for females 25 years and older:
No schooling: 105Nursery to 4th grade: 475th and 6th grade: 247th and 8th grade: 169th grade: 010th grade: 611th grade: 4312th grade, no diploma: 51High school graduate (or equivalency): 3,669Less than 1 year of college: 836Some college more than 1 year, no degree: 1,530Associate degree: 1,655Bachelor's degree: 4,976Master's degree: 1,956Professional school degree: 337Doctorate degree: 251
Housing units in structures:
One, detached: 12,518One, attached: 1,271Two: 433 or 4: 3605 to 9: 88510 to 19: 77420 to 49: 1,14950 or more: 850Mobile homes: 30Housing units lacking complete plumbing facilities in 2022: 0.4%Housing units lacking complete kitchen facilities in 2022: 0.6%House/condo owner moved in on average 17 years ago
Renter moved in on average 2 years ago
Private vs. public school enrollment:
Students in private schools in grades 1 to 8 (elementary and middle school): 619 Here:
21.2%Wisconsin:
16.7%
Students in private schools in grades 9 to 12 (high school): 244 Here:
11.8%Wisconsin:
12.5%
Students in private undergraduate colleges: 284 Here:
22.8%Wisconsin:
17.5%